. 2023 Sep;621(7979):543-549.
doi: 10.1038/s41586-023-05995-9. Epub 2023 Aug 9.

Intrinsic dopamine and acetylcholine dynamics in the striatum of mice

Affiliations

Intrinsic dopamine and acetylcholine dynamics in the striatum of mice

Anne C Krok et al. Nature. 2023 Sep.

Abstract

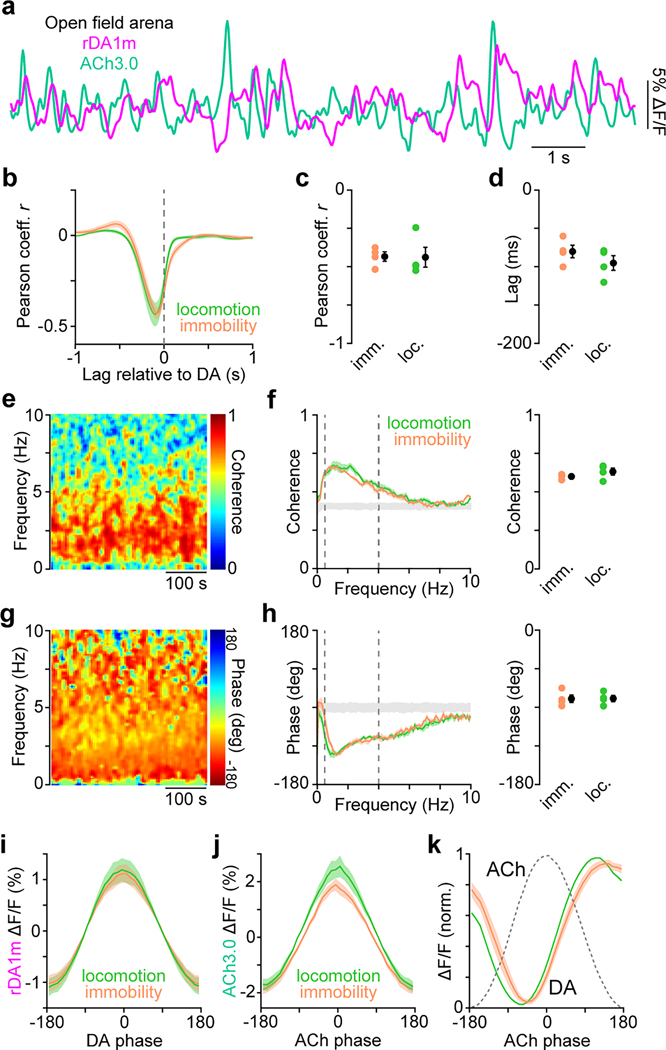
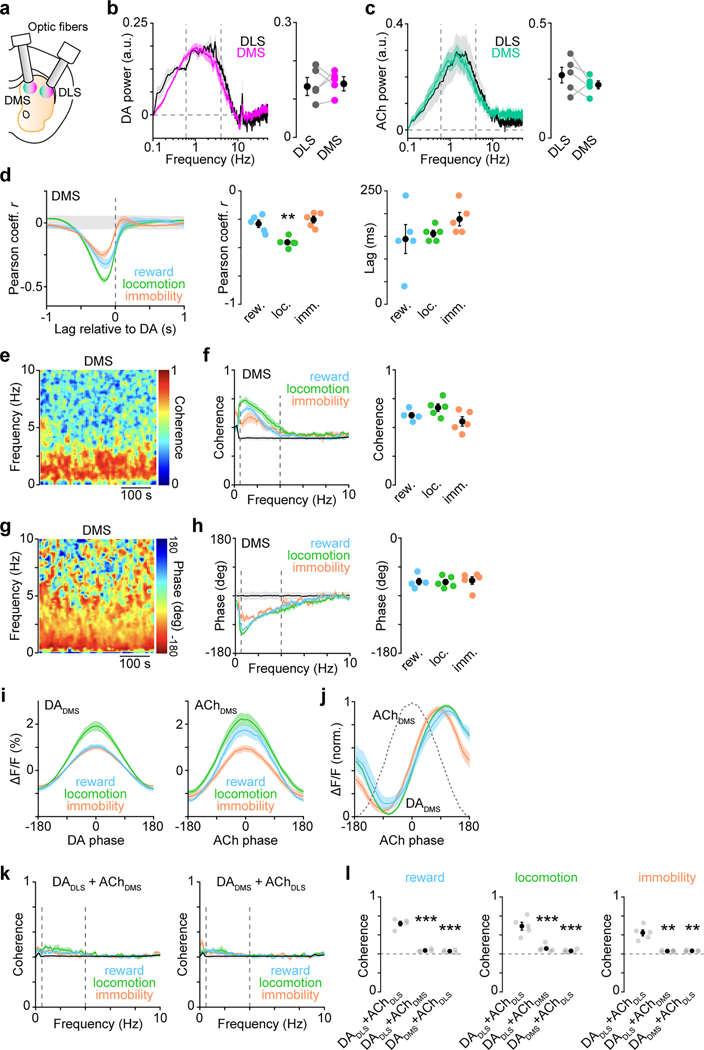
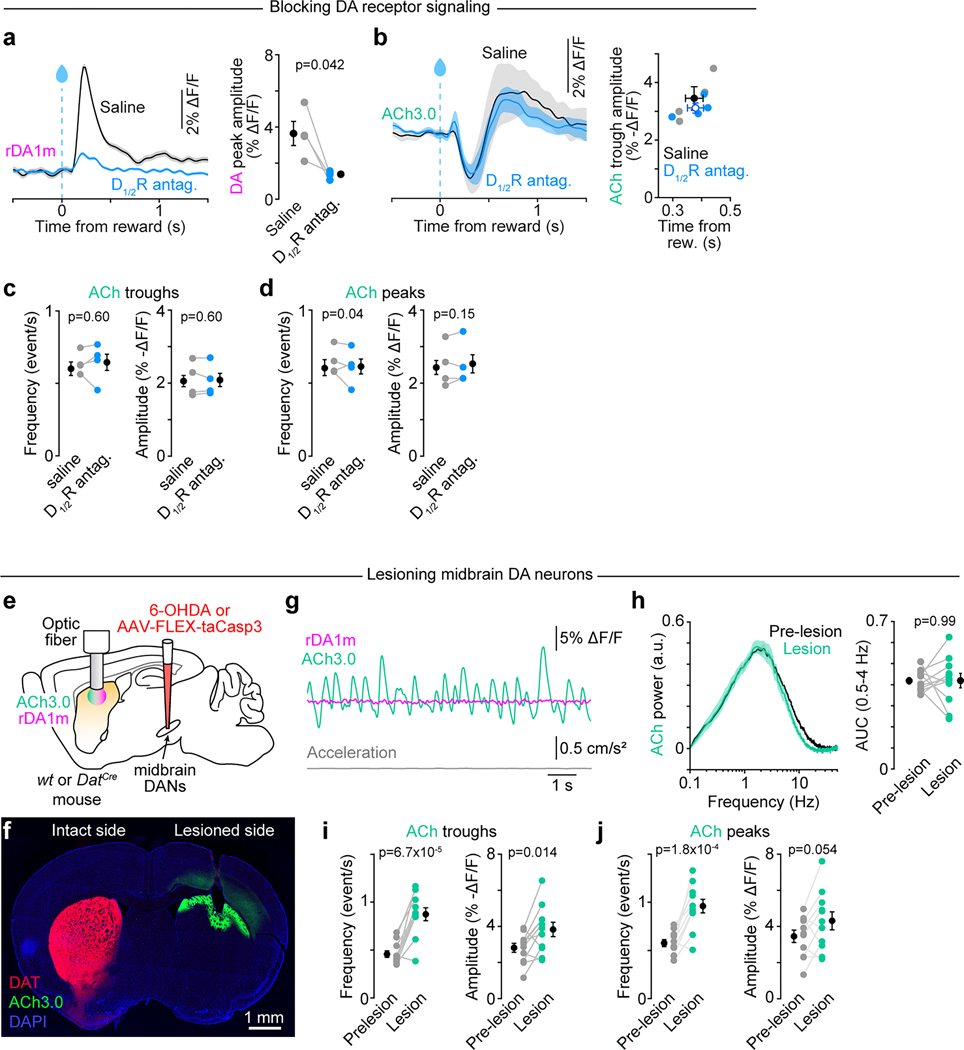
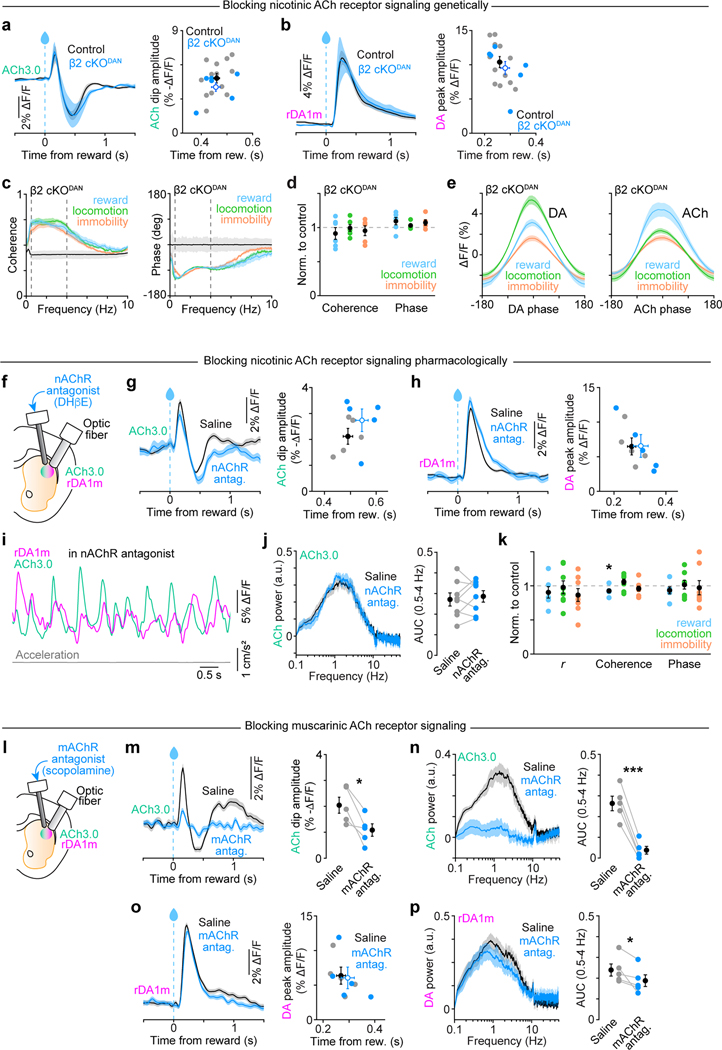
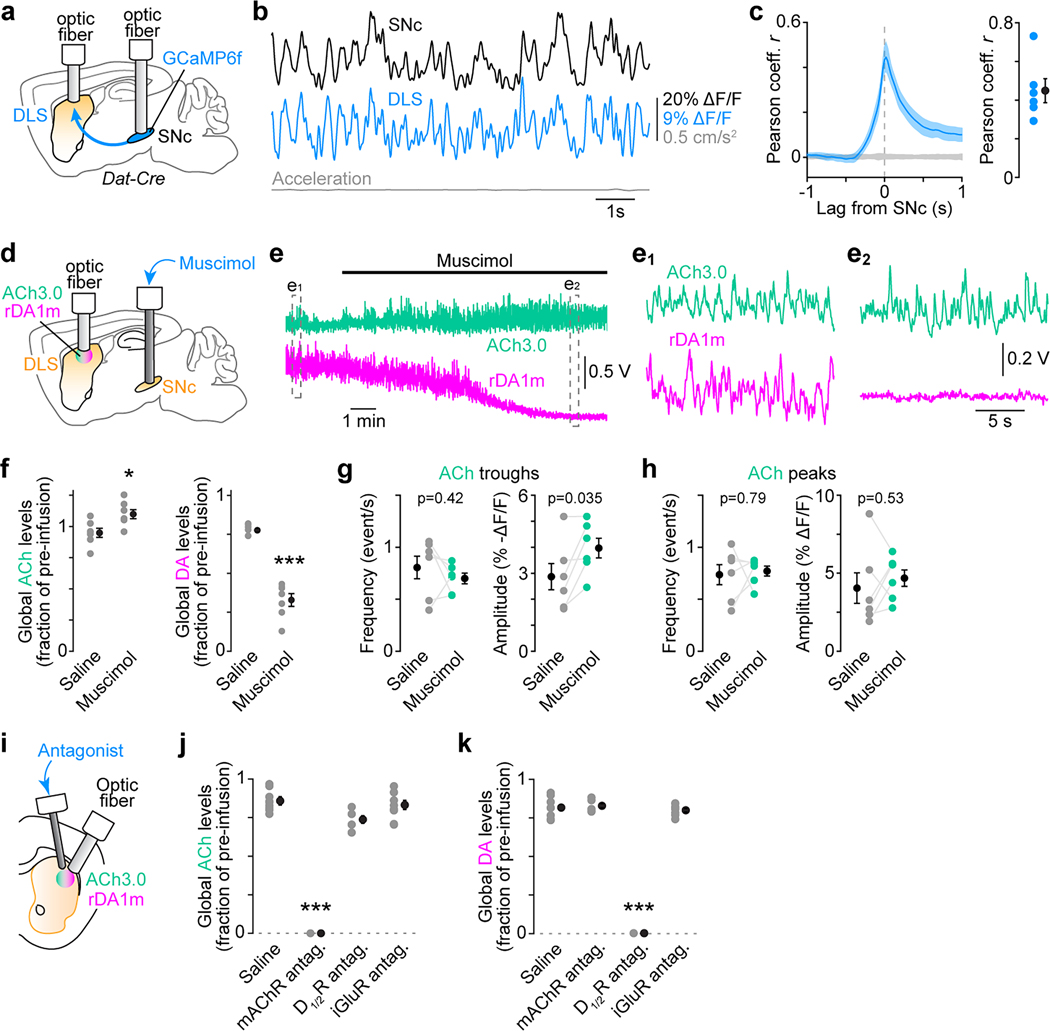
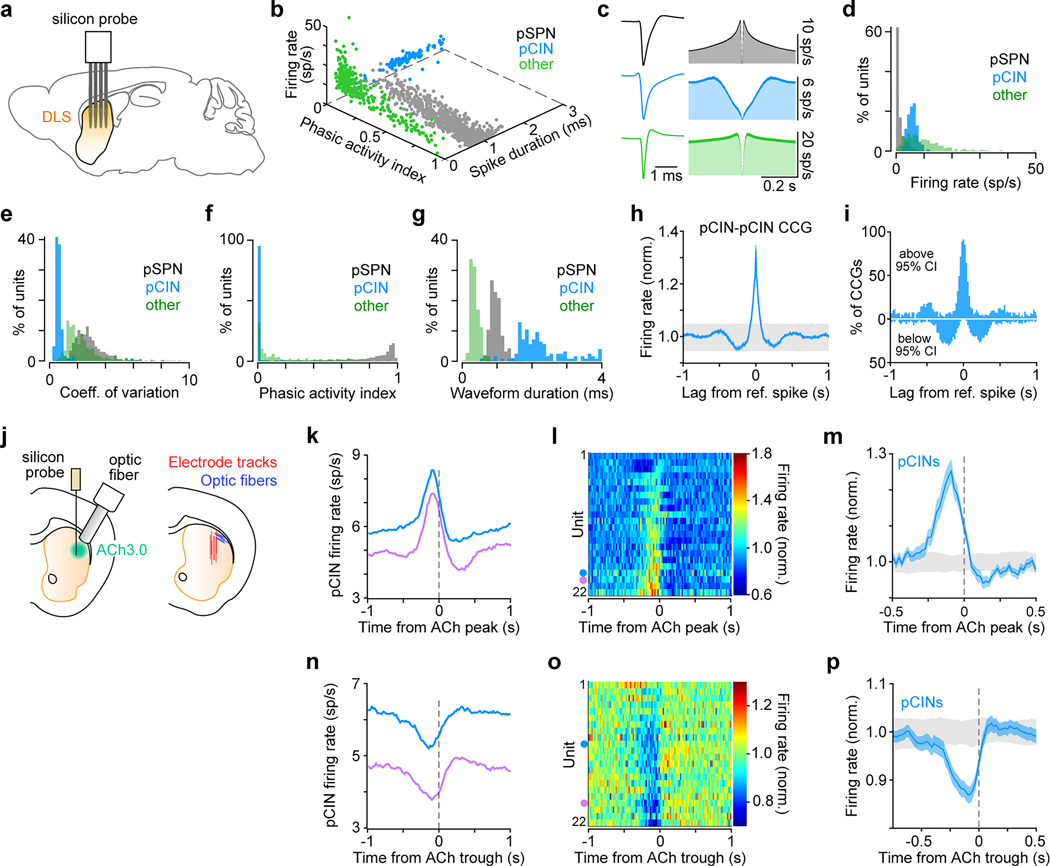
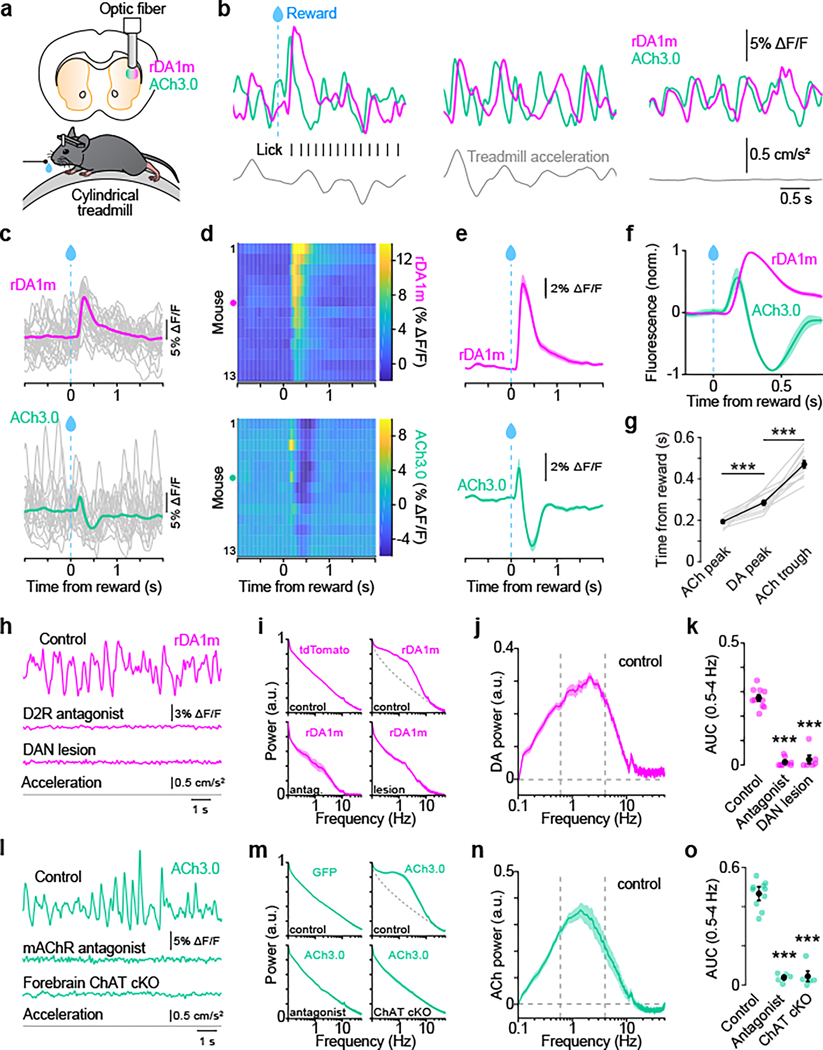
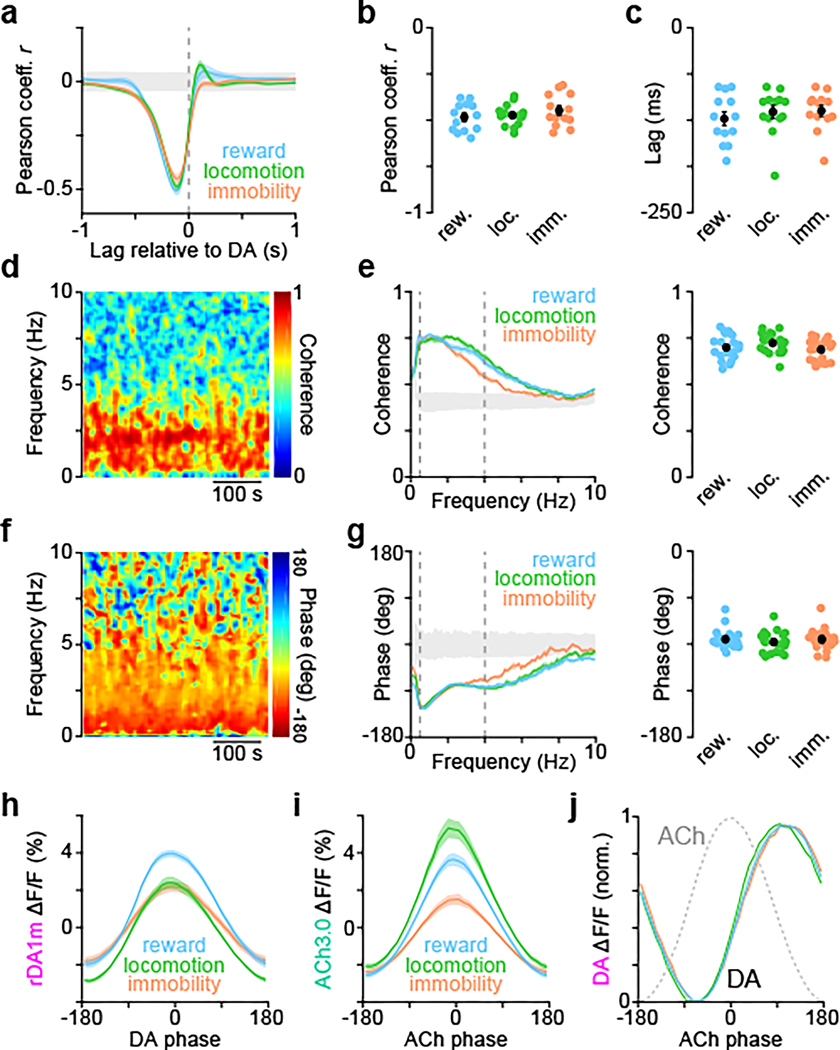
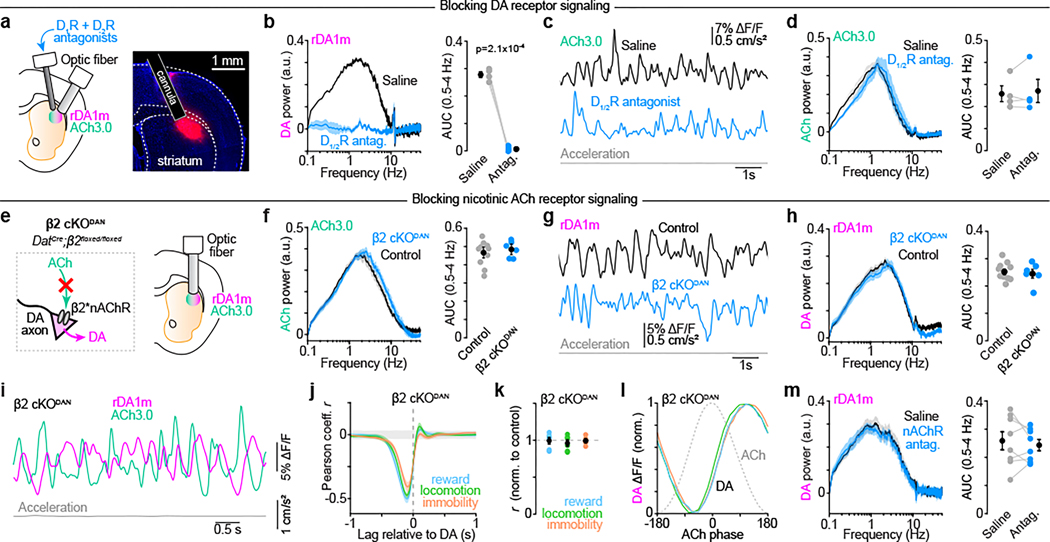
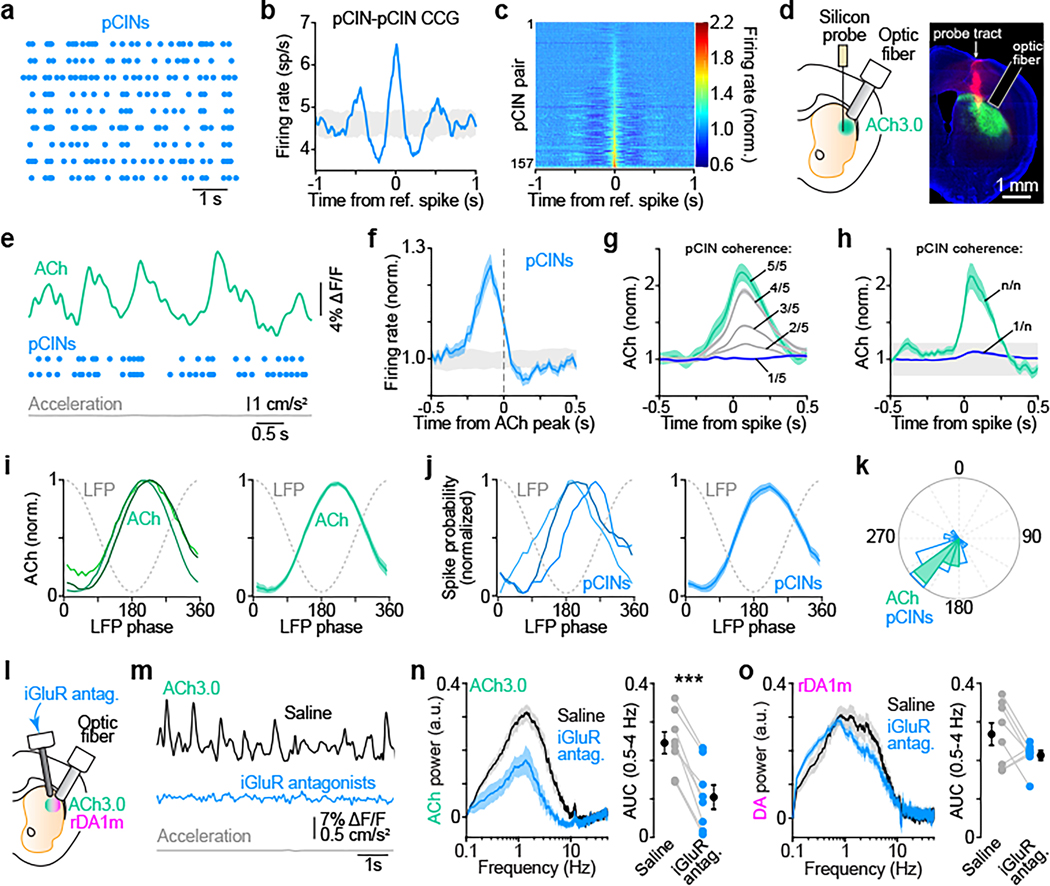
External rewards such as food and money are potent modifiers of behaviour1,2. Pioneering studies established that these salient sensory stimuli briefly interrupt the tonic discharge of neurons that produce the neuromodulators dopamine (DA) and acetylcholine (ACh): midbrain DA neurons (DANs) fire a burst of action potentials that broadly elevates DA in the striatum3,4 at the same time that striatal cholinergic interneurons (CINs) produce a characteristic pause in firing5,6. These phasic responses are thought to create unique, temporally limited conditions that motivate action and promote learning7-11. However, the dynamics of DA and ACh outside explicitly rewarded situations remain poorly understood. Here we show that extracellular DA and ACh levels fluctuate spontaneously and periodically at a frequency of approximately 2 Hz in the dorsal striatum of mice and maintain the same temporal relationship relative to one another as that evoked by reward. We show that this neuromodulatory coordination does not arise from direct interactions between DA and ACh within the striatum. Instead, we provide evidence that periodic fluctuations in striatal DA are inherited from midbrain DANs, while striatal ACh transients are driven by glutamatergic inputs, which act to locally synchronize the spiking of CINs. Together, our findings show that striatal neuromodulatory dynamics are autonomously organized by distributed extra-striatal afferents. The dominance of intrinsic rhythms in DA and ACh offers new insights for explaining how reward-associated neural dynamics emerge and how the brain motivates action and promotes learning from within.


Figures

Extended Data Fig. 1.
Extended Data Fig. 1.. Characterization of rDA1m and ACh3.0 expression.
a, Epifluorescence images of endogenous rDA1m (left) and ACh3.0 (middle) fluorescence in a coronal section of the striatum. Right, merged image overlaid with DAPI nuclear stain (blue). Similar results were obtained in n = 16 other brains recovered for post-hoc validation of GRAB sensor expression and fiber optic placement. b, Epifluorescence images of immuno-enhanced rDA1m and ACh3.0 expressed in the dorsal striatum. Note the presence of rDA1m- and ACh3.0-positive axonal projections in the globus pallidus externus (GPe) and internus (GPi), consistent with the subcellular distribution of dopamine and muscarinic receptors in both direct and indirect-pathway SPNs. c, High magnification confocal images (single optical plane) of immuno-enhanced rDA1m and ACh3.0 in a coronal striatal section. Note the localization of both sensors to the somatic membranes of striatal neurons and throughout the neuropil, and their exclusion from corticofugal axon bundles (asterisks). Note also that some rDA1m forms intracellular aggregates. d, Same as c for a sagittal section of the substantia nigra pars reticulata. Subcellular localization of immuno-enhanced rDA1m and ACh3.0 by high magnification confocal microscopy was independently confirmed in four mice. e, Schematic showing the tip of all recovered fiber optic implants in the DLS (blue) and DMS (green) at 3 different anterior-posterior levels relative to bregma (in mm).
Extended Data Fig. 2.
Extended Data Fig. 2.. Kinetics of ACh3.0 sensor in the striatum in vivo.
a, Experimental preparation to optogenetically evoke ACh release in vivo using ChrimsonR while simultaneously monitoring ACh levels with ACh3.0 photometry via the same fiber optic. ChrimsonR and ACh3.0 were both virally-expressed. b, Example ACh3.0 recording (teal). ChrimsonR was stimulated every 200 s with 635 nm light flashes (20 Hz, 1 s; shown in magenta). c, detail of dashed box in b showing ChrimsonR-evoked ACh release. d, Overlay of individual ACh3.0 transients (light teal) from b aligned to optogenetic stimulation onset. Group mean shown in dark teal with overlaid exponential fits used to calculate onset (τon) and offset (τoff) time constants in black. e, ACh3.0 τon (left) and τoff (right). Mean (± s.e.m.) shown in black (τon: 138 ± 10 ms; τoff: 247 ± 32 ms; n = 12 trials from 3 mice).
Extended Data Fig. 3.
Extended Data Fig. 3.. Reward-evoked DA and ACh responses in the DLS.
a, Example continuous recording of rDA1m (magenta) and ACh3.0 (teal) fluorescence, lick events (black) and treadmill acceleration (gray) illustrating the temporal dynamics of both sensors. Dashed blue lines depict uncued solenoid valve opening, which in this example did not generate large DA and ACh reward transients. b, Other reward response from same mouse. c, Example DA and ACh reward responses for a different mouse. d, Mean rDA1m (magenta) and ACh3.0 (teal) fluorescence aligned to solenoid valve opening for all uncued water deliveries followed within 1 s by consummatory licking (n = 13 mice). e, Same as d for water deliveries not followed by consummatory licking. Gray: 95% confidence interval. f, Same as d, but aligned to first lick after solenoid valve opening (i.e., first rewarded lick). g, Mean rDA1m and ACh3.0 fluorescence aligned to licks occurring between consummatory licking bouts (i.e., unrewarded licks). Gray: 95% confidence interval. h-j, Latency of first rewarded lick from solenoid valve opening (h; p = 0.52), fraction of rewards consumed within 1 s of valve opening (i; p = 0.14) and number of consummatory licks per reward delivery (j; p = 0.59) during the first (early) and last (late) quartiles of each imaging session in n = 13 mice suggest that the motivation to consume rewards is stable. k, Mean reward-aligned DA and ACh responses imaged during the first (early; gray) and last (late; colored) quartiles of each imaging session are similar in amplitude and kinetics (n = 13 mice). l, Scatterplot of the mean amplitude of reward-evoked DA peaks (left; p=0.24) and ACh throughs (right; p = 0.74) at the beginning (early) vs. end (late) of each imaging session (n = 13 mice). m, Scatterplot of the amplitude of individual DA peaks and concurrent ACh troughs imaged during reward (blue) and periods of immobility (orange) in one example recording session. Amplitude distribution for ACh (top) and DA (right) with overlap shown in gray. n, Mean distribution of DA peak (left) and ACh trough (right) amplitudes for all mice (n = 13) normalized to the mode of reward distributions showing considerable overlap between reward and immobility states. o, Left, power spectrum of DA signal recorded in the DLS during immobility in n = 10 female mice (black) and n = 8 male mice (magenta). Right, Area under the curve of DA power spectra in the 0.5–4 Hz frequency band (p = 0.65). p, Same as o, for ACh (p = 0.84). Group means (± s.e.m.) in h-j, o and p are shown in black. Shaded regions in d-g, k, n, o and p denote s.e.m. Statistical comparisons are Student’s paired t-tests in h-j and l, and Student’s two-sample t-tests in o and p.
Extended Data Fig. 4.
Extended Data Fig. 4.. Locomotion-evoked DA and ACh responses in the DLS.
a-b, Experimental setup: virally-expressed rDA1m and ACh3.0 were imaged in the DLS (a) of mice head-fixed on a transparent cylindrical treadmill (b). c, Example rDA1m and ACh3.0 fluorescence from 2 separate mice during immobility (left) and spontaneous locomotion on the treadmill (right). d, Mean standard deviation of photometry signal during immobility and locomotion for ACh3.0 (top; p=6.5×10⁻⁸, Student’s paired t-test) and rDA1m (bottom; p=3.6×10⁻⁴; Student’s paired t-test). Group mean (± s.e.m.) shown in black (n = 13 mice). e, Left, mean ACh (top) and DA (bottom) power density spectrum during locomotion (n = 13 mice). Right, Area under the curve (AUC) in 0.5–4 Hz frequency band. Group mean (± s.e.m.) shown in black. f, Heatmap of mean ACh3.0 (top) and rDA1m (bottom) fluorescence aligned to momentary peaks in treadmill acceleration during locomotion across mice. g, Group-averaged ACh3.0 (top) and rDA1m (bottom) fluorescence aligned to acceleration peaks stratified into tertiles according to acceleration magnitude. ACh and DA levels co-vary with acceleration magnitude. ACh levels peaking near acceleration maxima, whereas DA levels dip shortly before and crest shortly after acceleration maxima. h, Mean cross-correlation between treadmill acceleration and either ACh3.0 (teal) or rDA1m (magenta) fluorescence (n = 13 mice). i, Mean treadmill acceleration at different phases of periodic ACh fluctuations (dashed teal line) in the 0.5–4 Hz frequency band during locomotion (black) or immobility (gray) in n = 13 mice. During locomotion, periodic ACh fluctuations occur in phase with positive treadmill acceleration. Note that periodic ACh fluctuations during immobility are not associated with movements of the treadmill. j, Same as i for DA fluorescence. Note that DA fluctuations are phase-delayed relative to treadmill acceleration during locomotion, and not associated with micro-movements of the treadmill during immobility. Shaded regions in e, g-j denote s.e.m.
Extended Data Fig. 5.
Extended Data Fig. 5.. Spontaneous fluctuations in striatal DA and ACh in unrestrained mice.
a, Simultaneous photometry recording of rDA1m (magenta) and ACh3.0 (teal) fluorescence from a mouse in an open field arena. b, Mean cross-correlation between simultaneously recorded DA and ACh during locomotion (green) and immobility (orange) in n = 4 mice. c, Peak correlation coefficient between DA and ACh (p = 0.93) during immobility and locomotion (n = 4 mice). d, Same as c for time lag of negative cross-correlation peak (p = 0.06). e, Example coherence between DA and ACh signals across frequency and time domains during a recording in an open field arena. f, Left, mean coherence between DA and ACh at different frequencies (n = 4 mice). Vertical lines depict 0.5 and 4 Hz. Right, median coherence in 0.5–4 Hz frequency band in individual mice (p = 0.25). g-h, Same as e-f for phase offset between DA and ACh (p = 0.93). i, Mean DA fluorescence at different phases of periodic DA fluctuations in the 0.5–4 Hz frequency band (n = 4 mice). j, Same as h for ACh fluorescence. k, Peak-normalized DA fluorescence vs. phase of periodic ACh fluctuations (gray dotted line) in 0.5–4 Hz frequency band during locomotion (green) and immobility (orange). Group means (± s.e.m.) in c, d, f and h shown in black. Shaded areas in b, f, h-k reflect s.e.m. All statistical comparisons are Student’s paired t-tests.
Extended Data Fig. 6.
Extended Data Fig. 6.. DA and ACh levels also fluctuate periodically in DMS.
a, Experimental setup. b, Left, mean power spectrum of DA signal recorded simultaneously from DMS (magenta) and DLS (black) during immobility in n = 5 mice. Right, area under the DA power spectra in the 0.5–4 Hz frequency band in DMS and DLS. Group averages (± s.e.m.) shown in black (p = 0.8, Student’s paired t-test). c, Same as b for ACh (p = 0.3). d, Left, mean cross-correlation between DA and ACh in DMS across different behavioral states. Middle, peak correlation coefficient (Pearson’s r) in individual mice. Group averages (± s.e.m.) shown in black (**p = 0.006 vs. reward and immobility, one-way balanced ANOVA, Dunn’s multiple comparisons; n = 5 mice). Right, time lag of negative cross-correlation peak (p = 0.4, one-way balanced ANOVA). e, Magnitude of coherence between DA and ACh in DMS across frequency and time domains for an example recording. f, Left, mean coherence at different frequencies across behavioral states (n = 5 mice). Vertical lines depict 0.5 and 4 Hz. Right, median coherence in 0.5–4 Hz frequency band in individual mice. Group averages (± s.e.m.) shown in black (p = 0.09, one-way unbalanced ANOVA; n = 5 mice). g, Same as e for phase offset between DA and ACh in DMS. h, Same as f for phase offset between DA and ACh in DMS (p = 0.2, one-way unbalanced ANOVA). i, Left, mean DA fluorescence at different phase of DA fluctuations in the 0.5–4 Hz frequency band in DMS. Right, same for ACh fluorescence vs. phase of ACh fluctuations. j, Peak-normalized DA fluorescence vs. phase of ACh in DMS. k, Left, mean coherence between simultaneously recorded DADLS and AChDMS (n = 5 mice). Right, same for coherence between DADMS and AChDLS. l, Median coherence in 0.5–4 Hz band in individual mice. Group averages (± s.e.m.) shown in black (reward: DADLS+AChDMS p = 8.14×10⁻⁷; DADMS+AChDLS p = 6.07×10⁻⁷; locomotion: DADLS+AChDMS p = 7.46×10⁻⁵; DADMS+AChDLS p = 6.07×10⁻⁵; immobility: DADLS+AChDMS p = 0.004; DADMS+AChDLS p = 0.005; all vs. DADLS+AChDLS, one-way unbalanced ANOVA, Dunn’s multiple comparisons; n = 5 mice). Shaded areas in b-d, f, h-k reflect s.e.m.
Extended Data Fig. 7.
Extended Data Fig. 7.. DA does not drive spontaneous fluctuations in ACh.
a, Left, example session-averaged DA fluorescence aligned to solenoid valve opening for all uncued water deliveries followed within 1 s by consummatory licking after intra-striatal infusion of saline (black) or a cocktail of D1 and D2 receptor antagonists (blue). Right, mean reward-evoked DA amplitude (n = 4 mice). b, Left, same as a for ACh. Right, scatter plot of mean reward-evoked ACh dip amplitude and timing in mice infused with saline or D1/2R antagonists (amplitude: p = 0.2; timing: p = 0.9, both vs. saline). c, Frequency (left) and amplitude (right) of spontaneous dips in ACh fluorescence during immobility (n = 4 mice). d, Same as c for peaks in ACh. e, Experimental preparation to lesion midbrain DA neurons (DANs) unilaterally while imaging DA and ACh in the DLS ipsilaterally. DANs were lesioned using either 6OHDA infusions in wild type mice (n = 7), or AAV-mediated expression of Cre-dependent caspase-3 (AAV-FLEX-taCasp3) in the midbrain DANs of DatCre mice (n = 4). f, Epifluorescence image of ACh3.0 (green) and DA transporter (DAT; red) immunofluorescence overlaid with DAPI nuclear stain (blue) in a coronal section from a DatCre mouse injected with AAV-FLEX-taCasp3 into the right midbrain. Similar results were obtained in other 10 mice. g, Example DA (magenta) and ACh (teal) fluorescence following DAN lesion during immobility. h, Left, mean ACh power spectrum during immobility before (black) and after DAN lesion (teal; n = 11 mice). Right, ACh power area under the curve (AUC) in 0.5–4 Hz frequency band. i, Same as c before and after DAN lesion (n = 11 mice). Chronic DA depletion causes phasic dips in ACh to become larger and more frequent, hinting at a negative influence of DA on ACh release. j, Same as d before and after DAN lesion (n = 11 mice). Group means (± s.e.m.) in a-d, h-j are shown in black. Shaded areas in a, b and h reflect s.e.m. All statistical comparisons are Student’s paired t-tests.
Extended Data Fig. 8.
Extended Data Fig. 8.. ACh signaling is not required for periodic DA fluctuations.
a, Left, example session-averaged ACh fluorescence aligned to solenoid opening for all uncued water deliveries followed within 1 s by consummatory licking in control (black) and β2 cKODAN (blue) mice. Right, scatter plot of mean reward-evoked ACh dip amplitude and timing in control (gray; n = 13) and β2 cKODAN (blue; n = 6) mice. Group means (± s.e.m.) overlaid (amplitude: p = 0.29; timing: p = 0.89, both vs. control, Student’s two-sample t-test). b, Left, same as a for reward-evoked DA peak (amplitude: p = 0.58; timing, p = 0.33). c, Left, average coherence between DA and ACh signals in β2 cKODAN mice (n = 6) at different frequencies during reward (blue), locomotion (green) and immobility (orange). Vertical lines depict 0.5 and 4 Hz. Right, same for phase offset. d, Median DA–ACh coherence and phase in 0.5–4 Hz band in β2 cKODAN mice (n = 6) normalized to control mice across conditions (coherence: reward p = 0.9, locomotion p = 0.3, immobility p = 0.9; phase: reward p = 0.4, locomotion p = 0.6, immobility p = 0.2; all comparisons vs. control, Student’s two-sample t-test). Group mean (± s.e.m.) shown in black. e, Left, average DA fluorescence at different phases of periodic DA fluctuations in the 0.5–4 Hz frequency band across behavioral states in β2 cKODAN mice (n = 6 mice). Right, same for ACh fluorescence vs. phase of periodic ACh fluctuations. f, Experimental preparation for local pharmacological inhibition of nAChR signaling. g, Same as a after DLS infusion of saline (black) or the nAChR antagonist DHβE (blue; amplitude: p = 0.4; timing: p = 0.13, both vs. saline, Student’s paired t-test, n = 5 mice). h, Same as g for DA (amplitude: p = 0.9; timing: p = 0.15). i, Example DA (magenta) and ACh (teal) traces during infusion of DHβE. j, Left, mean ACh power spectrum during immobility following intra-striatal infusion of saline (black) or DHβE (blue; n = 8 mice). Right, ACh power area under the curve (AUC) in 0.5–4 Hz frequency band (p = 0.6, Student’s paired t-test). k, Same as d for Pearson’s correlation coefficient r (reward: p = 0.2, locomotion: p = 0.5, immobility: p = 0.06), coherence (reward: p = 0.04, locomotion: p = 0.6, immobility: p = 0.09) and phase (reward: p = 0.2, locomotion: p = 0.5, immobility: p = 0.6) in DHβE normalized to saline (all comparisons vs. saline, Student’s paired t-test; n = 8 mice). l, Experimental preparation for local pharmacological inhibition of mAChR signaling in the DLS. m, Left, same as g following infusion of saline (black) or the mAChR antagonist scopolamine (blue). Right, amplitude of reward-evoked dip in ACh fluorescence (p = 0.02; n = 5 mice). n, same as j after infusion of saline or mAChR antagonist (p = 2.5×10⁻⁴, Student’s paired t-test; n = 5 mice). This effect confirms that scopolamine reaches the volume of tissue imaged by the fiber optic. o, Same as m for DA (amplitude: p = 0.6, timing: p = 0.09; n = 5 mice). p, Same as n for DA (p = 0.048). This effect is consistent with the role of facilitatory effects of presynaptic mAChRs on DAN axons (see ref. ). Shaded areas in a, b, c, e, g, h, j and m-p reflect s.e.m.
Extended Data Fig. 9.
Extended Data Fig. 9.. Midbrain DAN activity underlies periodic fluctuations in striatal DA.
a, Experimental preparation for simultaneously imaging the activity of DANs in the SNc and their axons in the DLS. b, Example photometry recording of GCaMP6f in the SNc (black) and DLS (blue) during immobility. c, Left, average (± s.e.m. shown as shaded region) cross-correlation between SNc and DLS signals during immobility in n = 6 mice. 95% confidence interval shown in gray. Right, peak correlation coefficient between SNc and DLS signals. Group mean (± s.e.m.) in black. d, Experimental preparation for pharmacological silencing of SNc while imaging of rDA1m and ACh3.0 in the DLS. e, Left, Example continuous recording of ACh3.0 (teal) and rDA1m (magenta). Black line depicts muscimol infusion. Right, Detail of dashed boxes showing ACh and DA fluctuations during immobility before (e1) and following (e2) infusion of muscimol. Note that muscimol abolishes phasic DA transients as well as ‘global’ DA levels in the DLS, whereas ACh global levels and phasic transients persist. f, Average global ACh and DA fluorescence during immobility after infusion of saline and muscimol. Group mean (± s.e.m.) shown in black (ACh: p = 0.021; DA: p = 0.0001, Student’s paired t-test; n = 6 mice). g, Frequency (left) and amplitude (right) of spontaneous dips in ACh fluorescence recorded during immobility after infusion of saline (gray) or muscimol (teal). Group mean (± s.e.m.) shown in black (n = 6 mice). p-values (Student’s paired t-tests) indicated in figure. h, Same as g for peaks in ACh fluorescence. Collectively, these data confirm that spontaneous DA fluctuations in the DLS are driven by the somatic activity of midbrain DANs, whereas spontaneous ACh transients do not require DAN activity. i, Experimental preparation for local pharmacological inhibition of neurotransmitter receptors in the DLS. j, Average global ACh fluorescence measured during immobility after intra-striatal infusion of saline, the mAChR antagonist scopolamine (p = 6.9×10⁻⁶; n = 5 mice), the D1/2R antagonists SCH23390 and sulpiride (p = 0.24; n = 4 mice) or the iGluR antagonists NBQX and APV (p = 0.41; n = 8 mice; all comparisons are Student’s paired t-test vs. saline control). Data are expressed as a fraction of global ACh fluorescence pre-infusion. Group means (± s.e.m.) are shown in black. Note that mAChR antagonist blocks ACh3.0 (and therefore serves a positive control for maximal possible change in ACh signal) and that blocking iGluRs in the DLS does not significantly alter overall ACh3.0 fluorescence compared to saline, suggesting that CINs continue to release ACh via spontaneous, cell-autonomous firing. k, Same as l for global DA fluorescence after infusion of saline, scopolamine (p = 0.24), D1/2R antagonists (p = 1.1×10⁻⁴) or iGluR antagonists (p = 0.53). Note that blocking iGluRs in the DLS does not alter overall rDA1m fluorescence either, suggesting that DA axons continue to release DA.
Extended Data Fig. 10.
Extended Data Fig. 10.. Characterization of electrophysiological recordings in the DLS.
a, Experimental preparation for acute in vivo extracellular recordings in the DLS. b, Scatter plot of spike properties used to distinguish units as putative SPNs (pSPNs; gray), putative CINs (pCINs; blue), or other putative interneurons (green). c, Average waveform (left) and auto-correlograms (right) for pSPNs (black), pCINs (blue), and other neurons (green). d-g, Distribution of firing rates (d), coefficient of variation of inter-spike intervals (e), phasic activity index (f), and waveform duration for pSPNs (black), pCINs (blue), and other neurons (green). h, Mean (± s.e.m.) pCIN-pCIN cross correlogram (CCG) computed from all units shown in Fig. 4c (n = 157 pairs). 95% confidence interval shown in gray. i, Proportion of CCGs from Fig. 4c with firing rates above or below the 95% confidence interval (bin size: 20 ms). j, Left, experimental preparation for simultaneous ACh photometry and acute in vivo extracellular recordings from the DLS. Right, location of all recovered fiber optic implant tips (blue) and electrode tracks (red) in the DLS merged across anterior-posterior levels +0.5 to 0.75 mm relative to bregma. k, Men firing rate of two simultaneously recorded pCIN units aligned to ACh fluorescence peaks during immobility. l, Instantaneous (mean normalized) firing rate of pCINs (n = 22) aligned to ACh fluorescence peaks during immobility. Dots indicate units shown in k. m, Average firing rate (normalized to mean; ± s.e.m. shown in shaded region) of all pCINs shown in l. 95% confidence interval shown in gray. n-p, Same as k-m aligned to ACh fluorescence troughs.
Fig. 1.
Fig. 1.. Spontaneous periodic fluctuations in striatal DA and ACh.
a, Experimental setup to monitor DA and ACh levels in the DLS. b, Example rDA1m (magenta) and ACh3.0 (teal) fluorescence recorded during reward (left), locomotion (middle) and immobility (right). Black: licks, gray: treadmill acceleration. c-e, Session-averaged rDA1m (top) and ACh3.0 (bottom) signals aligned to solenoid valve opening (blue) in example mouse (c; gray: 20 randomly-selected single trials), in all recorded mice (d; dot: animal in c), and averaged across all 13 mice (e). f, Same as e normalized to rDA1m maxima and ACh3.0 minima. g, Latency of reward-evoked DA and ACh transients (ACh peak vs. DA peak: p = 2.5×10⁻⁷; DA peak vs. ACh trough: p = 9.6×10⁻¹⁰; one-way balanced ANOVA, Dunn’s multiple comparisons; n = 13 mice). Gray: individual mice. h, Example rDA1m fluorescence during immobility (top) following systemic treatment with the D2R antagonist sulpiride (middle) or midbrain DAN lesion with 6OHDA (bottom). Acceleration (gray) shown for control recording. i, Normalized power spectra of photometry signal for tdTomato (n = 3 mice) and rDA1m in control (n = 13), sulpiride-treated (n = 8) and 6OHDA-lesioned (n = 6) mice during immobility. j, Isolated power spectrum of DA signal. Vertical lines indicate 0.5 and 4 Hz. k, Area under the curve (AUC) for DA power in 0.5–4 Hz band in control (n = 13), sulpiride-treated (p = 1.2×10⁻¹²; n = 8) and 6OHDA-lesioned (p = 1.1×10⁻⁹; n = 6) mice (all vs. control, Student’s two-sample t-test). l-o, Same as h-k for ACh3.0 in control (n = 13), scopolamine-treated (p = 3.0×10⁻⁶; n = 5), and ChAT cKOforebrain (p = 8.3×10⁻⁶; n = 5) mice. Group means (± s.e.m.) in g, k and o are shown in black. Shaded area in e, f, i, j, m and n depicts s.e.m.
Fig. 2.
Fig. 2.. DA and ACh maintain a consistent temporal relationship across behavioral states.
a, Mean cross-correlation between simultaneously recorded DA and ACh signals (n = 13 mice) during reward (blue), locomotion (green) and immobility (orange). Gray: 95% confidence interval. b, Peak correlation coefficient between DA and ACh across behavioral states (p = 0.5, one-way balanced ANOVA; n = 13 mice). c, Same as b for time lag of negative cross-correlation peak (p = 0.6). d, Example coherence between DA and ACh signals across frequency and time domains. e, Left, mean coherence between DA and ACh at different frequencies across behavioral states (n = 13 mice). Vertical lines depict 0.5 and 4 Hz. Right, median coherence in 0.5–4 Hz band in individual mice (p = 0.9, one-way balanced ANOVA). f-g, Same as d-e for phase offset between DA and ACh (p = 0.6). h, Mean DA fluorescence at different phases of periodic DA fluctuations in the 0.5–4 Hz frequency band. i, Same as h for ACh fluorescence. j, Peak-normalized DA fluorescence vs. phase of periodic ACh fluctuations (gray dotted line) in 0.5–4 Hz band during reward (blue), locomotion (green) and immobility (orange). Group means (± s.e.m.) in b, c, e and g are shown in black. Shaded area in a, e, g, h-j depicts s.e.m.
Fig. 3.
Fig. 3.. Periodic DA and ACh fluctuations are not coordinated locally in the striatum.
a, Left, experimental preparation. Right, drug diffusion estimate using fluorescent dye in one of 3 similar experiments. b, Mean DA power spectrum (left) and area under the curve (AUC) in 0.5–4 Hz band (right; p = 2.1×10⁻⁴, Student’s paired t-test; n = 4 mice) during immobility after intra-striatal infusion of saline (black) or D1/2R antagonists (blue). c, Example ACh3.0 recording in saline or D1/2R antagonists. d, Same as b for ACh (p = 0.35). e, Strategy for genetically ablating ACh-evoked DA release from DANs. f, Same as b for ACh power in control (black; n = 13) and β2 cKODAN (blue; n = 6) mice during immobility (p = 0.5, Student’s two-sample t-test). g, Example DA fluctuations in control and β2 cKODAN mice. h, Same as f for DA power (p = 0.2). i, Example DA (magenta) and ACh (teal) traces from a β2 cKODAN mouse. j, Mean DA–ACh cross-correlogram during reward (blue), locomotion (green) and immobility (orange) in β2 cKODAN mice. Gray: 95% confidence interval. k, Pearson correlation coefficient r between DA and ACh in six β2 cKODAN mice normalized to control mice during reward (p = 0.6), locomotion (p = 0.9) and immobility (p = 0.4; all vs. control, Student’s two-sample t-test). l, Peak-normalized DA fluorescence in β2 cKODAN mice vs. phase of periodic ACh fluctuations in 0.5–4 Hz band. m, Same as b for DA power following intra-striatal infusion of saline or the nAChR antagonist DHβE (p = 0.5, Student’s paired t-test; n = 8 mice). Group means (± s.e.m.) in b, d, f, h, k and m are shown in black. Shaded area in b, d, f, h, j and m depicts s.e.m.
Fig. 4.
Fig. 4.. Glutamatergic inputs synchronize CIN spiking and drive periodic ACh fluctuations.
a, Spike raster of 9 putative (p) CINs recorded simultaneously in the DLS during immobility. b, Spike cross-correlogram (CCG) between two units in a. c, Heatmap of spike CCGs for all pCIN pairs (n = 157) normalized to mean firing rate during immobility. d, Experimental configuration (left) and representative coronal section (right) from 4 similar mice showing the silicon probe track (red) near the fiber optic used to image ACh3.0. e, Example simultaneous recording of ACh levels (teal) and spiking from 2 pCINs (blue) during immobility. f, Average pCIN firing rate (mean-normalized) aligned to peaks in ACh3.0 fluorescence (n = 22 units). g, Example pCIN spike-aligned ACh signal stratified based on the fraction of concurrently-recorded pCINs that are co-active. h, Mean pCIN spike-aligned ACh3.0 fluorescence when only 1 (blue) or all (teal) concurrently-recorded pCINs are co-active. i, Three examples (left) and average (n = 4 mice; right) peak-normalized ACh signal aligned to the phase of striatal LFP oscillations in the 0.5–4 Hz band. j, Same as i for spike probability in 52 out of 55 pCINs (94.5%) that showed a significant phase relationship to 0.5–4 Hz LFP. k, Polar plot of preferred phase of individual pCINs (blue) and ACh recordings (teal) relative to 0.5–4 Hz LFP. l, Experimental configuration. m, Example ACh fluctuations during immobility following intra-striatal infusion of saline (black) or iGluR antagonists (blue). n, Mean ACh power spectrum (left) and area under the curve (AUC) in 0.5–4 Hz band (right; p = 2.2×10⁻⁵, Student’s paired t-test; n = 8 mice) during immobility. o, Same as n for DA (p = 0.10). 95% confidence interval in b, f and h is shown in gray. Shaded area in f-j, n and o depicts s.e.m.

References

    1. Schultz W. Behavioral theories and the neurophysiology of reward. Annu Rev Psychol 57, 87–115 (2006). - PubMed
    1. O’Doherty JP, Cockburn J. & Pauli WM Learning, Reward, and Decision Making. Annu Rev Psychol 68, 73–100 (2017). - PMC - PubMed
    1. Mirenowicz J. & Schultz W. Preferential activation of midbrain dopamine neurons by appetitive rather than aversive stimuli. Nature 379, 449–451 (1996). - PubMed
    1. Cohen JY, Haesler S, Vong L, Lowell BB & Uchida N. Neuron-type-specific signals for reward and punishment in the ventral tegmental area. Nature 482, 85–88 (2012). - PMC - PubMed
    1. Morris G, Arkadir D, Nevet A, Vaadia E. & Bergman H. Coincident but distinct messages of midbrain dopamine and striatal tonically active neurons. Neuron 43, 133–143 (2004). - PubMed

Publication types

LinkOut - more resources