. 2023 Aug;620(7974):582-588.
doi: 10.1038/s41586-023-06400-1. Epub 2023 Aug 9.

The recovery of European freshwater biodiversity has come to a halt

Peter Haase #  1   2 Diana E Bowler  3   4   5 Nathan J Baker  6   7 Núria Bonada  8 Sami Domisch  9 Jaime R Garcia Marquez  9 Jani Heino  10 Daniel Hering  11 Sonja C Jähnig  9   12 Astrid Schmidt-Kloiber  13 Rachel Stubbington  14 Florian Altermatt  15   16 Mario Álvarez-Cabria  17 Giuseppe Amatulli  18 David G Angeler  19   20   21   22 Gaït Archambaud-Suard  23 Iñaki Arrate Jorrín  24 Thomas Aspin  25 Iker Azpiroz  26 Iñaki Bañares  27 José Barquín Ortiz  17 Christian L Bodin  28 Luca Bonacina  29 Roberta Bottarin  30 Miguel Cañedo-Argüelles  8   31 Zoltán Csabai  32   33 Thibault Datry  34 Elvira de Eyto  35 Alain Dohet  36 Gerald Dörflinger  37 Emma Drohan  38 Knut A Eikland  39 Judy England  40 Tor E Eriksen  41 Vesela Evtimova  42 Maria J Feio  43 Martial Ferréol  34 Mathieu Floury  9   44 Maxence Forcellini  34 Marie Anne Eurie Forio  45 Riccardo Fornaroli  29 Nikolai Friberg  41   46   47 Jean-François Fruget  48 Galia Georgieva  42 Peter Goethals  45 Manuel A S Graça  43 Wolfram Graf  13 Andy House  25 Kaisa-Leena Huttunen  49 Thomas C Jensen  39 Richard K Johnson  19 J Iwan Jones  50 Jens Kiesel  9   51 Lenka Kuglerová  52 Aitor Larrañaga  53 Patrick Leitner  13 Lionel L'Hoste  36 Marie-Helène Lizée  23 Armin W Lorenz  11 Anthony Maire  54 Jesús Alberto Manzanos Arnaiz  24 Brendan G McKie  19 Andrés Millán  55 Don Monteith  56 Timo Muotka  49 John F Murphy  50 Davis Ozolins  57 Riku Paavola  58 Petr Paril  33 Francisco J Peñas  17 Francesca Pilotto  39 Marek Polášek  33 Jes Jessen Rasmussen  41 Manu Rubio  26 David Sánchez-Fernández  55 Leonard Sandin  39 Ralf B Schäfer  59 Alberto Scotti  30   60 Longzhu Q Shen  9   61 Agnija Skuja  57 Stefan Stoll  11   62 Michal Straka  33   63 Henn Timm  64 Violeta G Tyufekchieva  42 Iakovos Tziortzis  37 Yordan Uzunov  42 Gea H van der Lee  65 Rudy Vannevel  45   66 Emilia Varadinova  42   67 Gábor Várbíró  68 Gaute Velle  28   69 Piet F M Verdonschot  65   70 Ralf C M Verdonschot  65 Yanka Vidinova  42 Peter Wiberg-Larsen  71 Ellen A R Welti #  72   73
Affiliations

The recovery of European freshwater biodiversity has come to a halt

Peter Haase et al. Nature. 2023 Aug.

Abstract

Owing to a long history of anthropogenic pressures, freshwater ecosystems are among the most vulnerable to biodiversity loss1. Mitigation measures, including wastewater treatment and hydromorphological restoration, have aimed to improve environmental quality and foster the recovery of freshwater biodiversity2. Here, using 1,816 time series of freshwater invertebrate communities collected across 22 European countries between 1968 and 2020, we quantified temporal trends in taxonomic and functional diversity and their responses to environmental pressures and gradients. We observed overall increases in taxon richness (0.73% per year), functional richness (2.4% per year) and abundance (1.17% per year). However, these increases primarily occurred before the 2010s, and have since plateaued. Freshwater communities downstream of dams, urban areas and cropland were less likely to experience recovery. Communities at sites with faster rates of warming had fewer gains in taxon richness, functional richness and abundance. Although biodiversity gains in the 1990s and 2000s probably reflect the effectiveness of water-quality improvements and restoration projects, the decelerating trajectory in the 2010s suggests that the current measures offer diminishing returns. Given new and persistent pressures on freshwater ecosystems, including emerging pollutants, climate change and the spread of invasive species, we call for additional mitigation to revive the recovery of freshwater biodiversity.


Conflict of interest statement

The authors declare no competing interests.

Figures

Fig. 1
Fig. 1. Timeline and data distribution.
a, A timeline of major stressors (above the line) and environmental legislation (below the line) affecting Europe’s freshwater ecosystems (citations are provided in Supplementary Table 1). UN/ECE LTRAP,  United Nations Economic Commission for Europe Long-Range Transboundary Air Pollution. b, The sampling sites (points) and the rate of temporal change in taxon richness of freshwater invertebrate communities (colour of points) across 22 European countries (black). c, The distribution of sampling sites over time and countries. ‘Other’ includes countries with fewer than 50 sampling sites.
Fig. 2
Fig. 2. Averages and distributions of trends in taxonomic and functional diversity metrics.
ah, Overall meta-analysis estimates and distributions of site-level trends for taxonomic metrics of taxon richness (a), abundance (b), Shannon’s evenness (c) and turnover (d), and functional metrics of richness (e), redundancy (f), evenness (g) and turnover (h) across all 1,816 sites. The black error bars and text on each panel show the mean estimates (percentage change per year). The error bars indicate the 80%, 90% and 95% CIs.
Fig. 3
Fig. 3. Temporal fluctuations in trend estimates using a moving window.
ah, Modelled trend estimates from moving windows of taxon richness (a), abundance (b), functional richness (c) and functional redundancy (d), and the proportion of sites with positive trend estimates of taxon richness (e), abundance (f), functional richness (g) and functional redundancy (h). Trend estimates were calculated from Bayesian mixed-effects models of trends from at least 250 time series with at least 6 years of data from at least 8 countries within 10-year moving windows (totalling 21,495 time-series segments). The proportions are based on whether site-level trend estimates of these time-series were above zero or not. For trend estimates in ad, blue and red areas indicate the overall positive (>0) and negative (<0) mean trend estimates for the given 10-year window, respectively, and the grey polygons indicate the 80%, 90% and 95% CIs. For site proportions in eh, blue and red areas indicate a larger proportion of positive (>50% of sites) and negative (<50% of sites) site-level trend estimates for the given 10-year window, respectively, and the grey polygons indicate 80%, 90% and 95% CIs.
Fig. 4
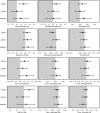
Fig. 4. Estimated effects of environmental drivers on biodiversity trends.
ah, Estimated effects of the mean (tmax mean) and trend (tmax slope (sl.)) of annual maximum monthly mean temperatures, mean (ppt mean) and trend (ppt sl.) of the annual cumulative precipitation, the dam impact score (dam) and the percentage of the upstream catchment covered by urban areas and cropland on site-level long-term trend estimates for taxon richness (a), abundance (b), evenness (c) and turnover (d), and functional richness (e), redundancy (f), evenness (g) and turnover (h). n = 1,816 biologically independent sites for all metrics. Positive and negative estimates are shown in blue and red, respectively. For climatic drivers, mean values refer to mean long-term values at each site and represent geographical variation; trends were calculated by regressing annual mean values against year, using the coefficient as an estimate of climatic trend and represent temporal variation. All response variables are site-level trends (that is, change in biodiversity metric over time) and all covariates were standardized to units of s.d. before analysis. A positive coefficient means that sites with higher values of the driver tended to have higher trends, although not necessarily positive trends, compared with sites with lower values of the driver. For example, trends in taxon richness were higher at sites with higher maximum mean temperatures (tmax mean) but lower at sites with higher rates of temperature increase (tmax sl.; b). The bars around the estimates indicate 80%, 90% and 95% CIs. The grey horizontal lines separate the three environmental driver groups: climate, dams and land use. Estimates of stream characteristics (stream order, flow accumulation, elevation and slope) are shown in Extended Data Fig. 6.
Extended Data Fig. 1
Extended Data Fig. 1. Trend estimates for community subsets.
Overall estimates and distributions of trends in a, non-native species richness, b, non-native abundance, c, native taxon richness, d, native abundance, e, Ephemeroptera, Plecoptera, and Trichoptera (EPT) taxon richness, f, EPT abundance, g, insect taxon richness, and h, insect abundance. Bars around estimates indicate 80%, 90%, and 95% credible intervals. Trend estimates for native taxa (c, d) are restricted to the 1,299 sites at which taxa were identified to species or a mixed taxonomic resolution. Trend estimates for non-native species (a, b) are restricted to the 898 (of 1,299) sites at which non-native species were detected. Incorporating the remaining 394 (30.1%) of the 1,299 sites (i.e. those with no detected non-native species) as having trends = 0 resulted in an average increase of 2.75% y−1 in richness and 2.79% y−1 in abundance.
Extended Data Fig. 2
Extended Data Fig. 2. Trend estimates for additional biodiversity metrics.
Overall estimates and distributions of trends in a, Shannon’s diversity, b, rarefied taxon richness, c, functional divergence, and d, Rao’s quadratic entropy (n = 1,816 biologically independent sites for all metrics). Bars around estimates indicate 80%, 90%, and 95% credible intervals.
Extended Data Fig. 3
Extended Data Fig. 3. Moving window trends for additional biodiversity metrics.
Estimated trends in a, Shannon’s evenness, b, taxonomic turnover, c, functional evenness, and d, functional temporal turnover. Estimates were calculated from Bayesian mixed-effects models of trends from ≥250 time series with ≥6 years of data from ≥8 countries within 10-year moving windows. Grey polygons indicate 80, 90, and 95% credible intervals.
Extended Data Fig. 4
Extended Data Fig. 4. Estimated effects of environmental drivers on temporal trends in additional biodiversity metrics.
Estimated effects of the mean (tmax mean) and trend (tmax sl. [slope]) of annual maximum temperature, mean (ppt mean) and trend (ppt sl.) of annual precipitation, dam impacts (dam), and the percentage of the upstream catchment covered by urban areas and cropland on temporal trends in a, Shannon’s diversity, b, rarefied taxon richness, c, functional (func.) divergence, and d, Rao’s quadratic entropy (Q) (n = 1,816 biologically independent sites for all metrics). Bars around estimates indicate 80%, 90%, and 95% credible intervals. Grey, horizontal lines separate the three environmental driver groups: climate, dams, and land use.
Extended Data Fig. 5
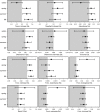
Extended Data Fig. 5. Estimated effects of environmental drivers on biodiversity metrics representing community subsets.
Estimated effects of the mean (tmax mean) and trend (tmax sl. [slope]) of annual maximum temperature, mean (ppt mean) and trend (ppt sl. [slope]) of annual precipitation, dam impacts (dam), and the percentage of the upstream catchment covered by urban areas and cropland on temporal trends in a, non-native species richness, b, native taxon richness, c, EPT richness, d, insect richness, e, non-native abundance, f, native abundance, g, EPT abundance, and h, insect abundance. Trend estimates for native taxa (b, f) are restricted to 1,299 sites at which taxa were identified to species or a mixed taxonomic resolution. Trend estimates for non-native species (a, e) are restricted to the 898 (of 1,299) sites at which non-native species were detected. Bars around estimates indicate 80%, 90%, and 95% credible intervals. Bars around estimates indicate 80%, 90%, and 95% credible intervals. Grey, horizontal lines separate the three environmental driver groups: climate, hydrology, and land use.
Extended Data Fig. 6
Extended Data Fig. 6. Estimated effects of stream characteristics on biodiversity metrics.
Estimated effects of slope, elevation, flow accumulation (accum.) and Strahler stream order (str. order) on temporal trends in a, taxon richness, b, abundance, c, evenness, d, turnover, and functional (func.) e, richness, f, redundancy, g, evenness, and h, turnover (n = 1,816 biologically independent sites for all metrics). Bars around estimates indicate 80%, 90%, and 95% credible intervals.
Extended Data Fig. 7
Extended Data Fig. 7. Estimated effects of stream characteristics on additional biodiversity metrics.
Estimated effects of stream characteristics of slope, elevation, flow accumulation (accum.) and Strahler stream order (str. order) on temporal trends in a, Shannon’s diversity, b, rarefied taxon richness, c, functional (func.) divergence, and d, Rao’s quadratic entropy (n = 1,816 biologically independent sites for all metrics). Bars around estimates indicate 80%, 90%, and 95% credible intervals.
Extended Data Fig. 8
Extended Data Fig. 8. Estimated effects of stream characteristics on taxon richness and abundance of taxa subsets.
Estimated effects of slope, elevation, flow accumulation (accum.) and Strahler stream order (str. order) on temporal trends in a, non-native species richness, b, native taxon richness, c, EPT richness, d, insect richness, e, non-native abundance, f, native abundance, g, EPT abundance, and h, insect abundance. Trend estimates for native taxa (b, f) are restricted to 1,299 sites at which taxa were identified to species or a mixed taxonomic resolution. Trend estimates for non-native species (a, e) are restricted to the 898 (of 1,299) sites at which non-native species were detected. Bars around estimates indicate 80%, 90%, and 95% credible intervals.
Extended Data Fig. 9
Extended Data Fig. 9. Sensitivity of biodiversity metric responses to taxonomic identification level.
Error bars represent 95% credible intervals. Overlapping error bars indicate comparable trend estimates for analyses at species (n = 762), genus/mixed (n = 537) and family (n = 517) taxonomic levels; Func., functional; Est., estimated trend.
Extended Data Fig. 10
Extended Data Fig. 10. Sensitivity of biodiversity metric responses to sampling season.
Error bars represent 95% credible intervals. The largest differences between seasons were found for winter, which likely reflects the low number of sites sampled in this season (winter n = 5, spring n = 623, summer n = 473, fall n = 715). Func. refers to functional; Est. refers to trend estimates.

References

    1. Dudgeon D, et al. Freshwater biodiversity: importance, threats, status and conservation challenges. Biol. Rev. 2006;81:163–182. doi: 10.1017/S1464793105006950. - DOI - PubMed
    1. Vaughan IP, Ormerod SJ. Large-scale, long-term trends in British river macroinvertebrates. Glob. Change Biol. 2012;18:2184–2194. doi: 10.1111/j.1365-2486.2012.02662.x. - DOI
    1. Steffen W, Broadgate W, Deutsch L, Gaffney O, Ludwig C. The trajectory of the Anthropocene: the great acceleration. Anthr. Rev. 2015;2:81–98.
    1. Windsor FM, Tilley RM, Tyler CR, Ormerod SJ. Microplastic ingestion by riverine macroinvertebrates. Sci. Total Environ. 2019;646:68–74. doi: 10.1016/j.scitotenv.2018.07.271. - DOI - PubMed
    1. Reid AJ, et al. Emerging threats and persistent conservation challenges for freshwater biodiversity. Biol. Rev. 2019;94:849–873. doi: 10.1111/brv.12480. - DOI - PubMed

Substances