. 2023 Aug;620(7975):881-889.
doi: 10.1038/s41586-023-06409-6. Epub 2023 Aug 9.

Lactate limits CNS autoimmunity by stabilizing HIF-1α in dendritic cells

Affiliations

Lactate limits CNS autoimmunity by stabilizing HIF-1α in dendritic cells

Liliana M Sanmarco et al. Nature. 2023 Aug.

Abstract

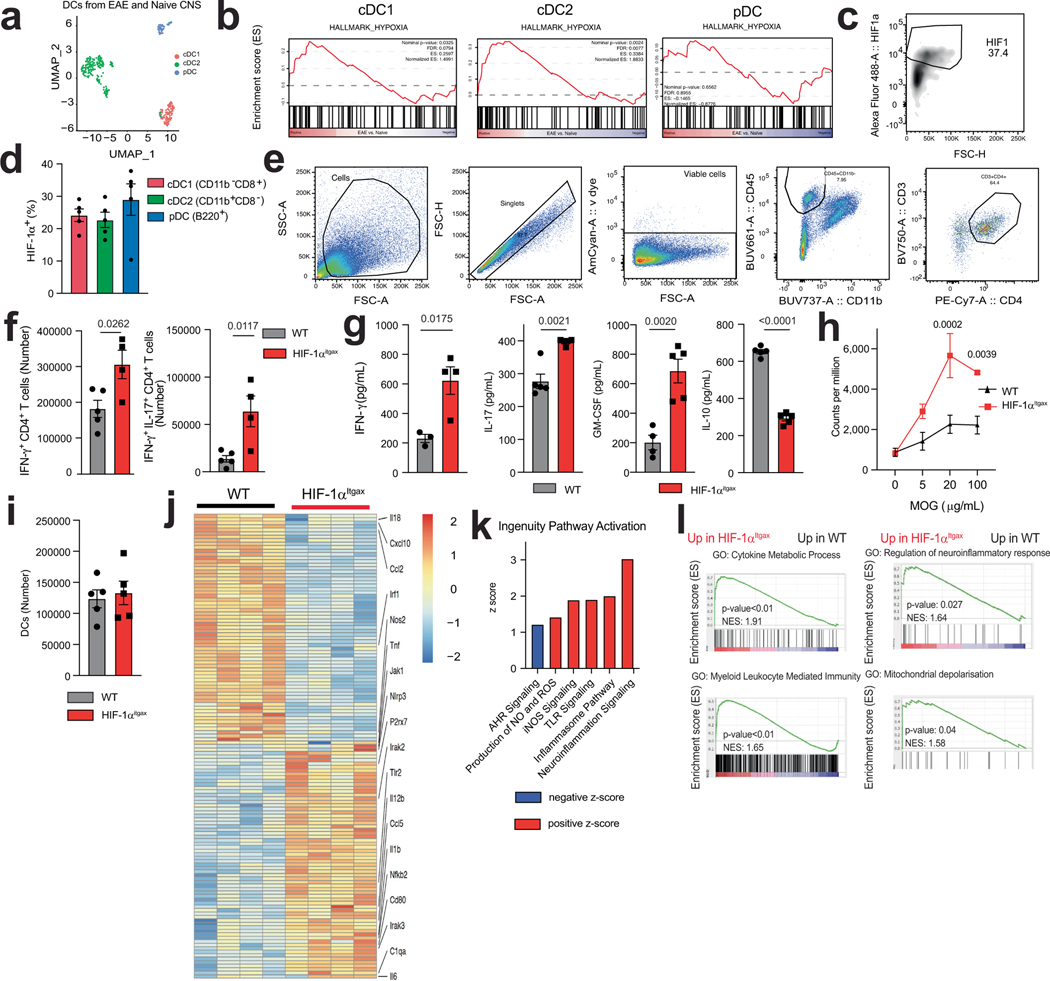
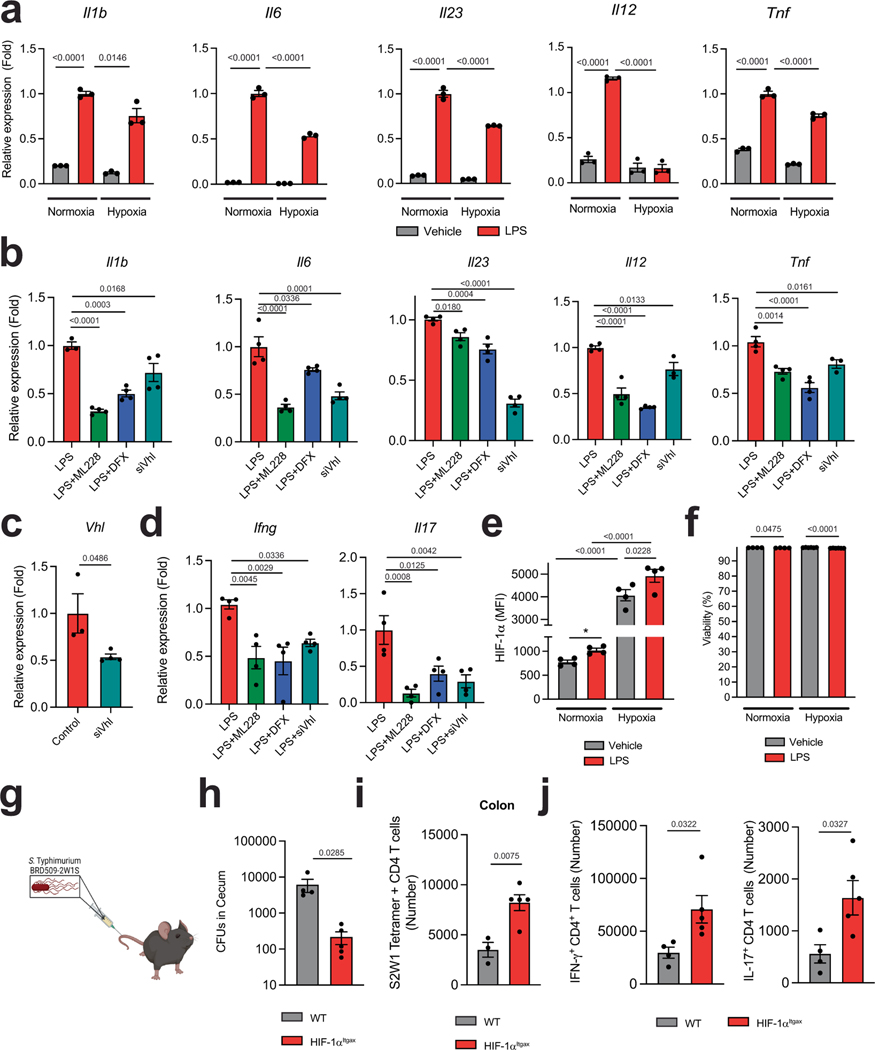
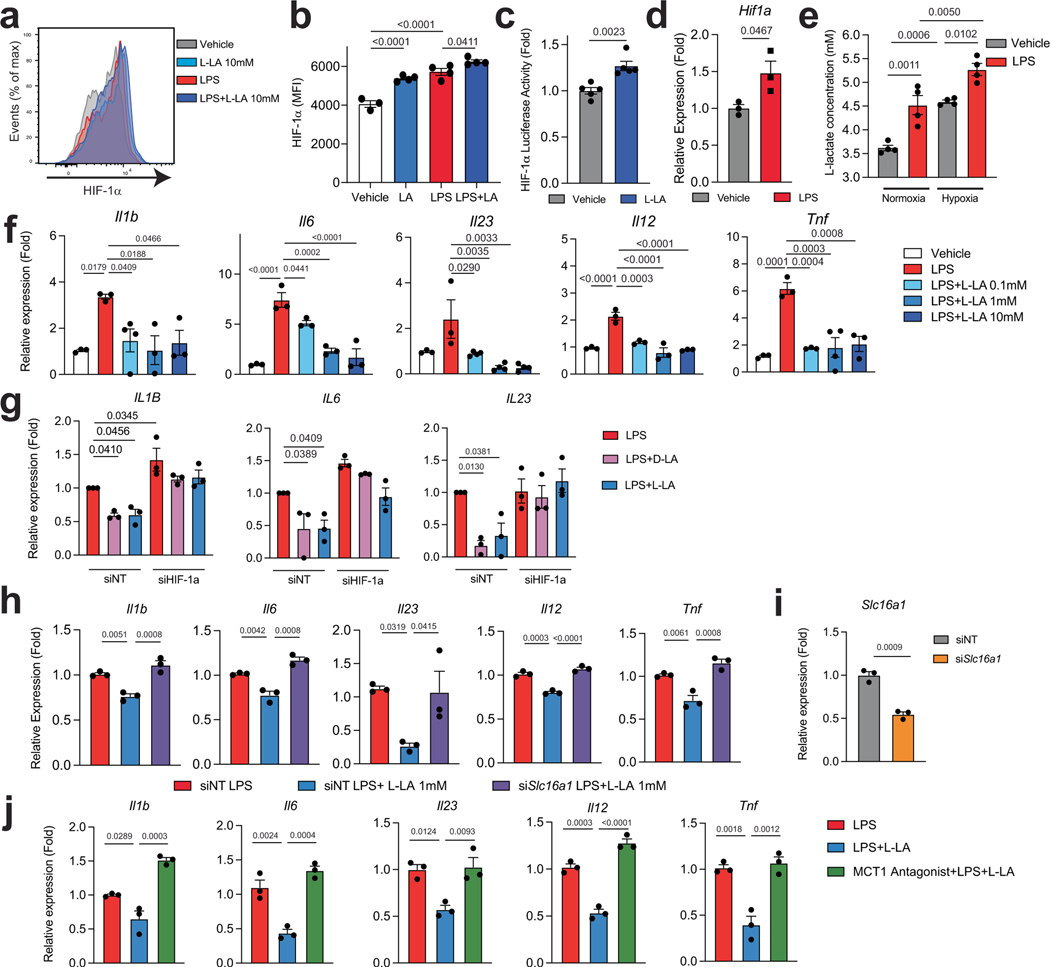
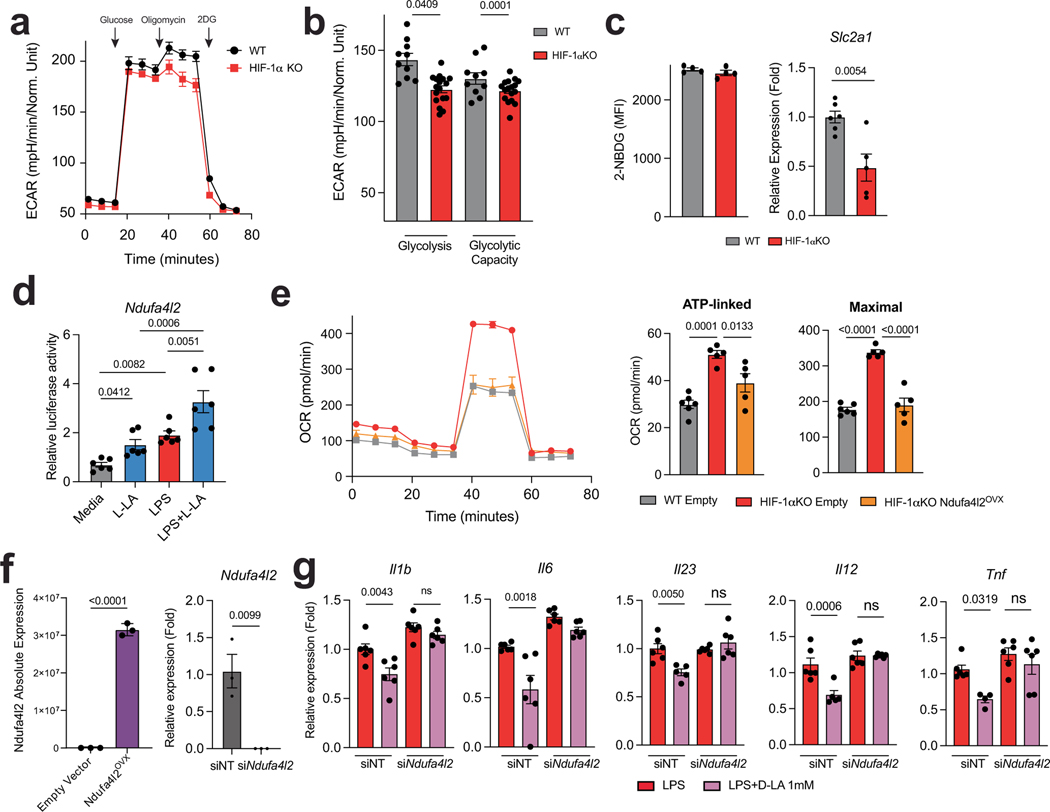
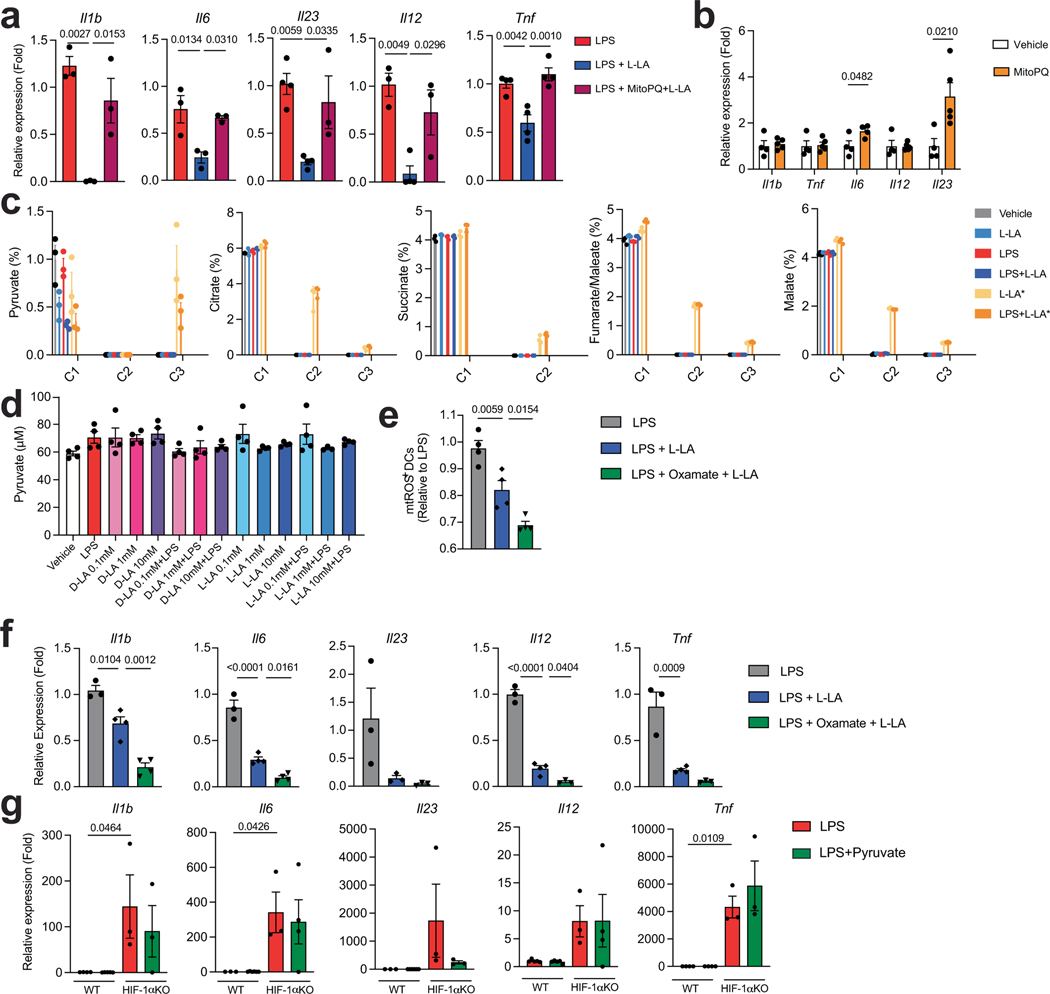
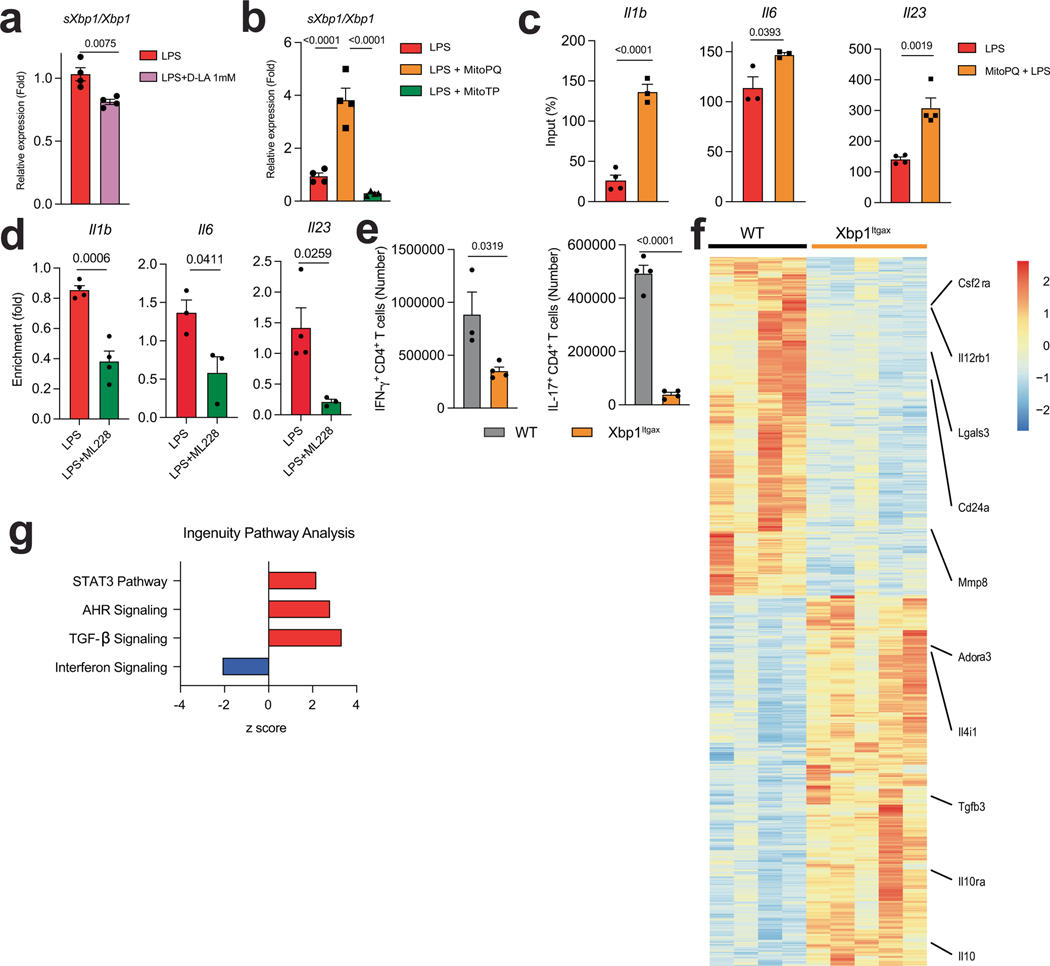
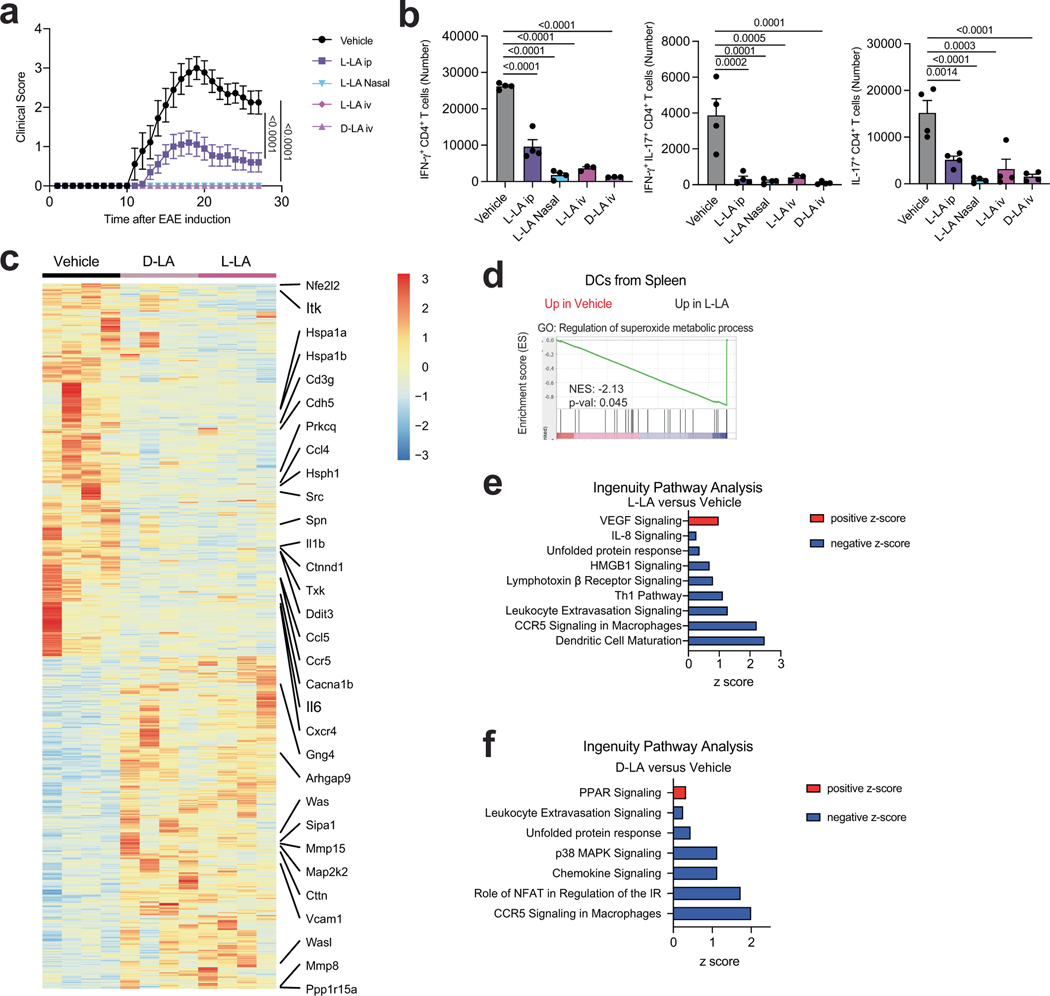
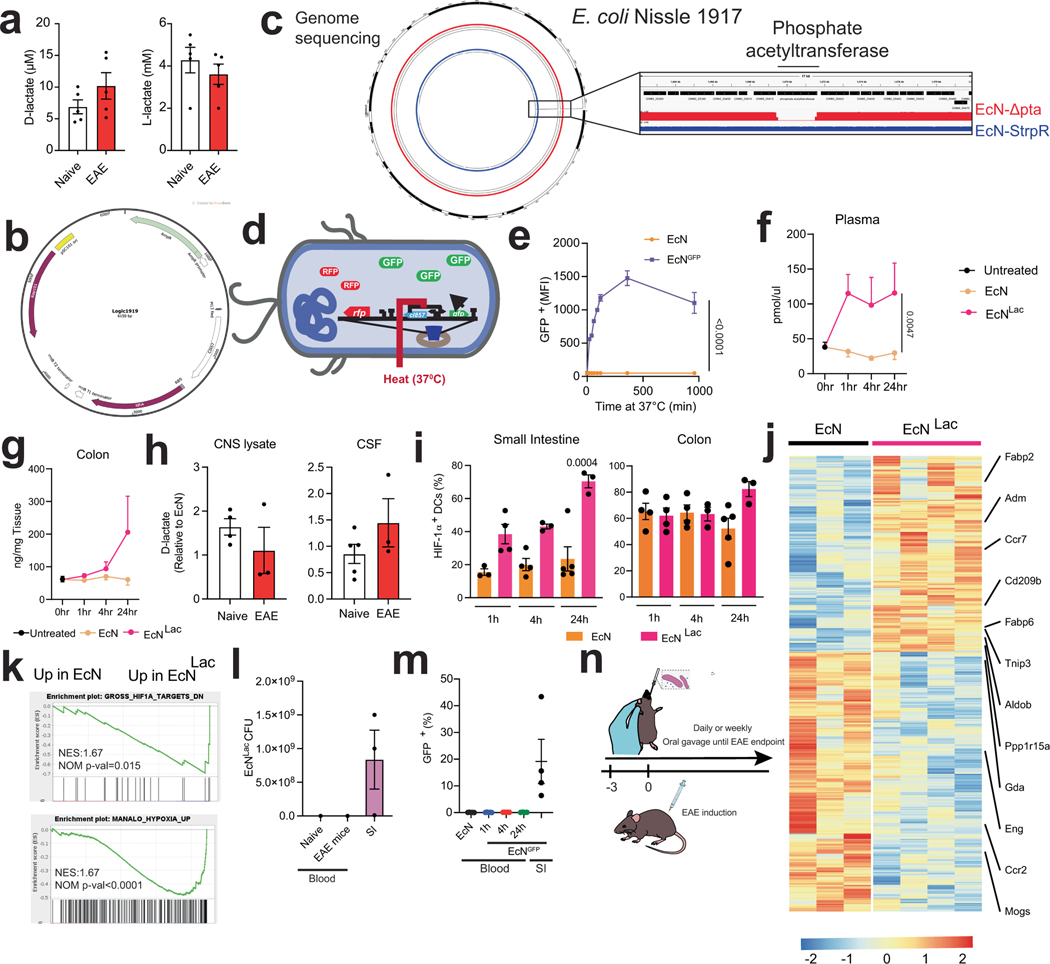
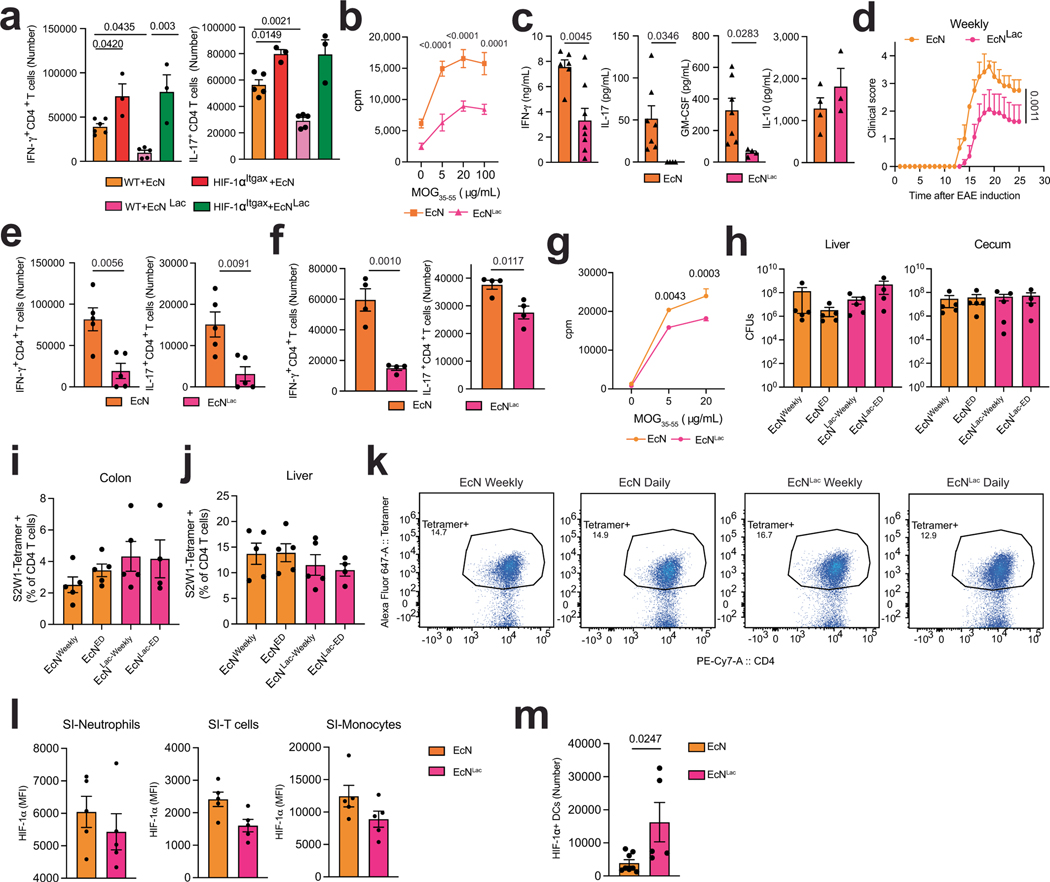
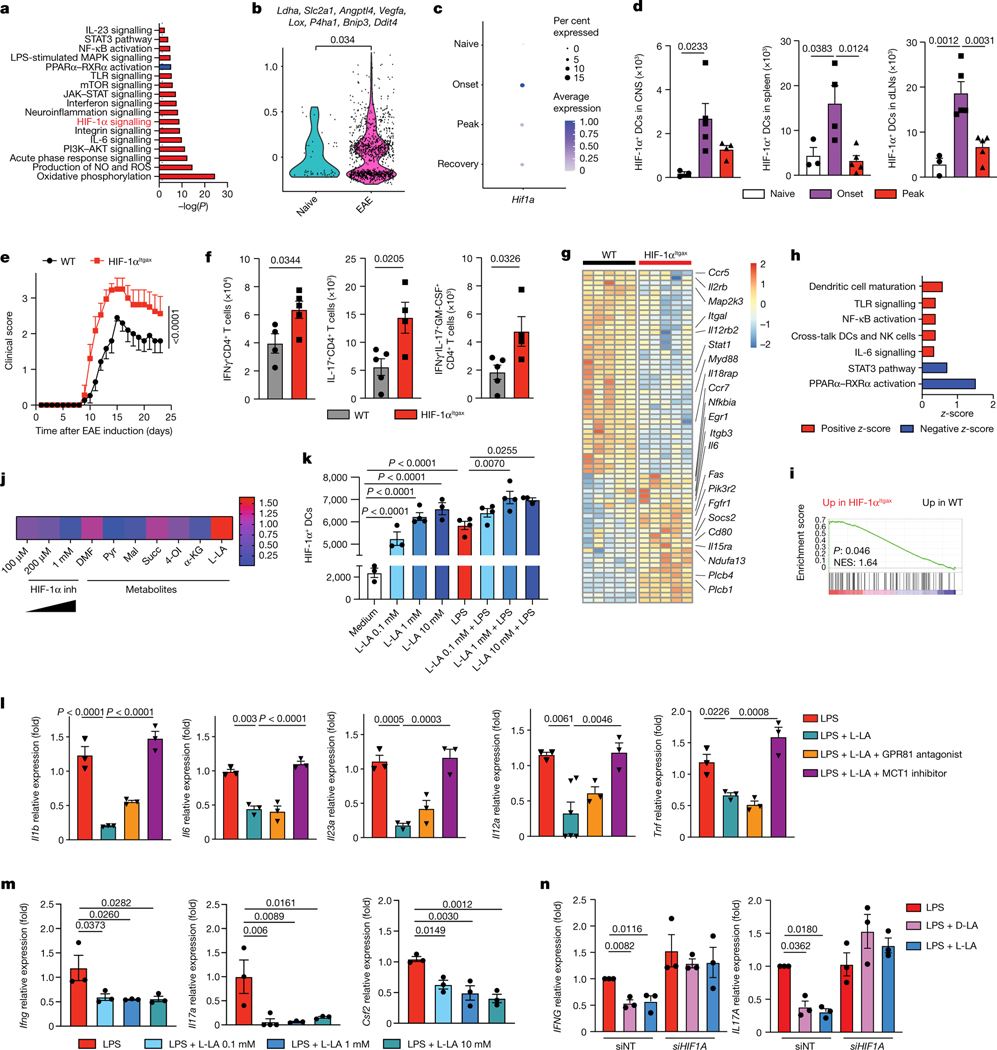
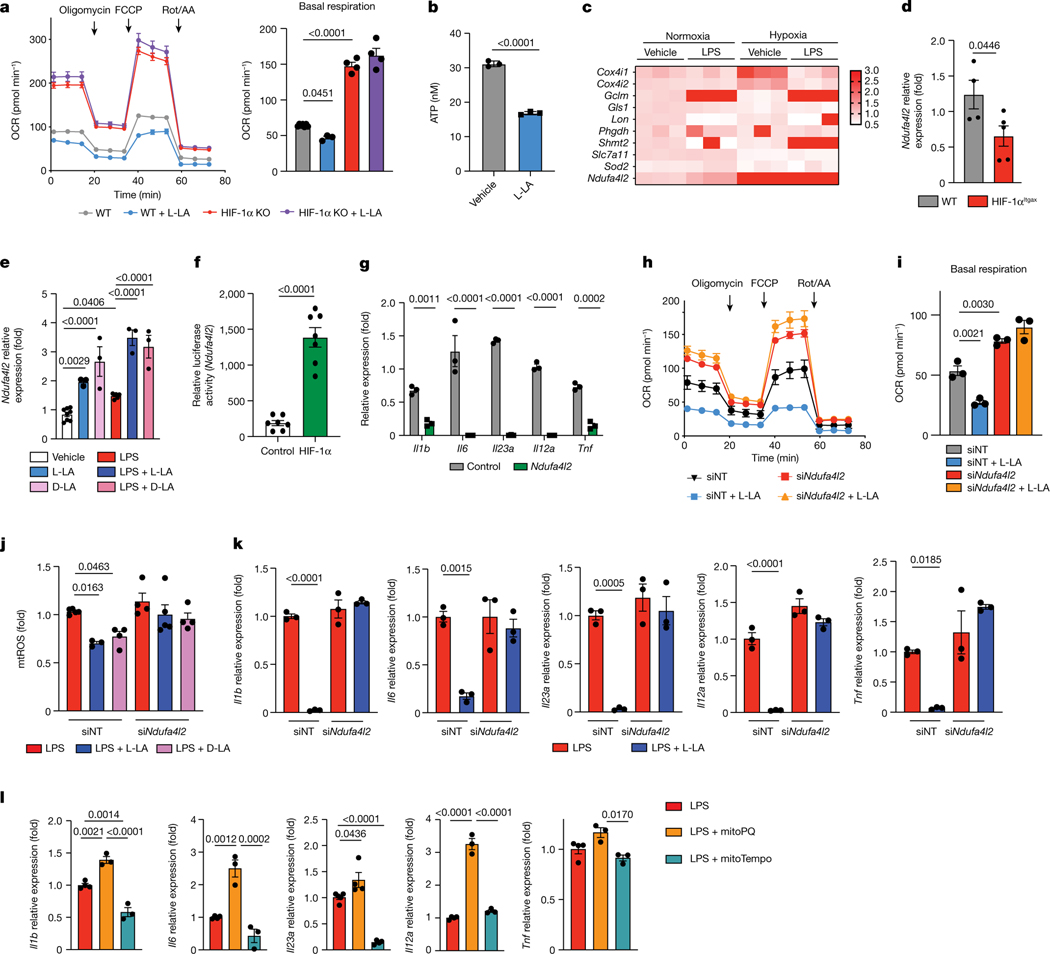
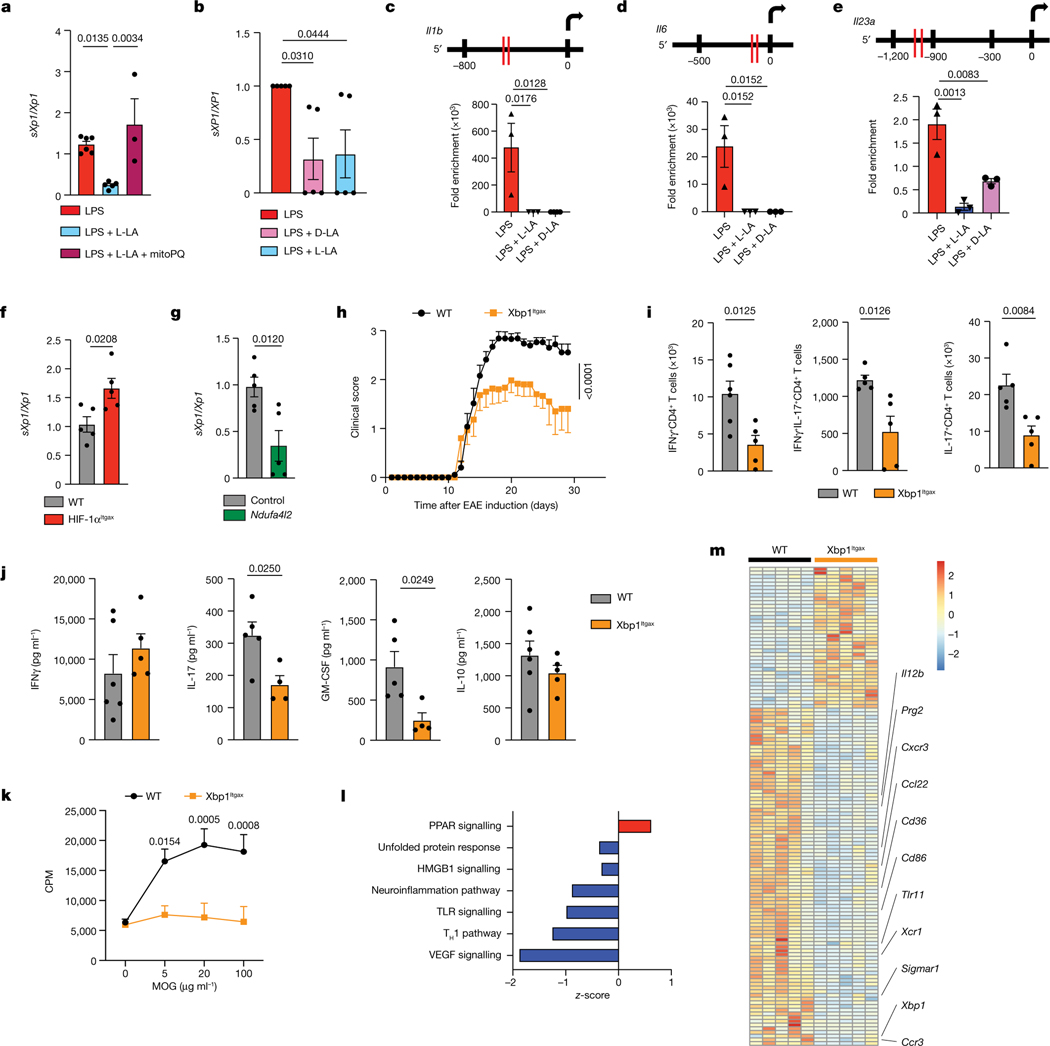
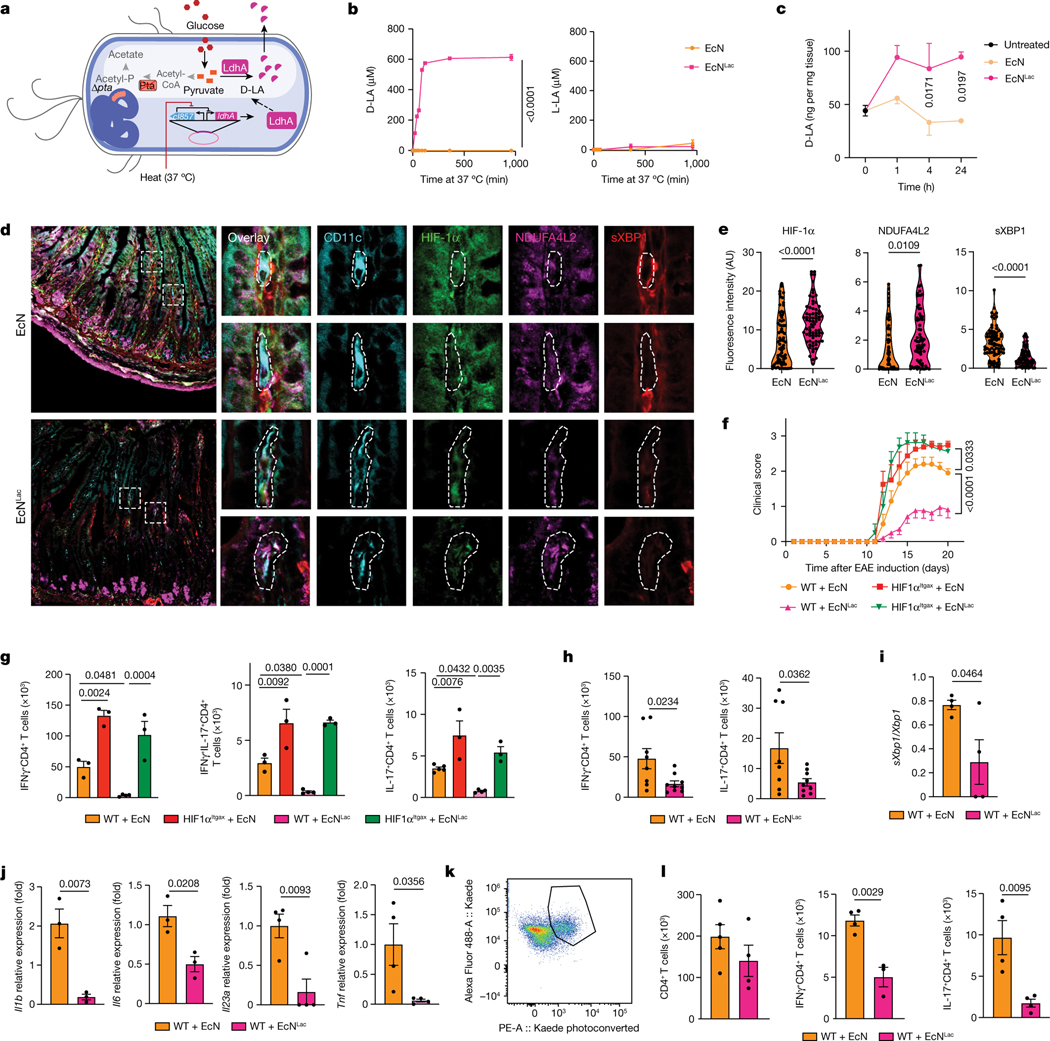
Dendritic cells (DCs) have a role in the development and activation of self-reactive pathogenic T cells1,2. Genetic variants that are associated with the function of DCs have been linked to autoimmune disorders3,4, and DCs are therefore attractive therapeutic targets for such diseases. However, developing DC-targeted therapies for autoimmunity requires identification of the mechanisms that regulate DC function. Here, using single-cell and bulk transcriptional and metabolic analyses in combination with cell-specific gene perturbation studies, we identify a regulatory loop of negative feedback that operates in DCs to limit immunopathology. Specifically, we find that lactate, produced by activated DCs and other immune cells, boosts the expression of NDUFA4L2 through a mechanism mediated by hypoxia-inducible factor 1α (HIF-1α). NDUFA4L2 limits the production of mitochondrial reactive oxygen species that activate XBP1-driven transcriptional modules in DCs that are involved in the control of pathogenic autoimmune T cells. We also engineer a probiotic that produces lactate and suppresses T cell autoimmunity through the activation of HIF-1α-NDUFA4L2 signalling in DCs. In summary, we identify an immunometabolic pathway that regulates DC function, and develop a synthetic probiotic for its therapeutic activation.


Conflict of interest statement

Competing interests N.L., A.S., D.H. and J.M.L. were employees of Synlogic Therapeutics during some of this study. The remaining authors declare no competing interests.

Figures

Extended Data Fig. 1 |
Extended Data Fig. 1 |. Analysis of HIF-1Itgax mice during EAE.
a, Uniform manifold approximation and projection (UMAP) displaying CNS DCs analysed by scRNA-seq during EAE. b, GSEA of hypoxia activation in DC subsets (cDC1, cDC2 and pDC) from scRNA-seq dataset. c,d, Representative dot plot (c) and flow cytometry analysis (d) of HIF-1α expression in splenic cDC1s (CD8+CD11b), cDC2s (CD8CD11b) and pDCs (B220+) 25 days after EAE induction in WT mice (n = 5 mice per group). e, Gating strategy used to analyse CD4+ T cells in the CNS of mice subjected to EAE. f, IFNγ+, IFNγ+IL-17+ CD4+ T cells in spleens of WT (n = 5) and HIF-1αItgax (n = 4) mice subjected to EAE. g,h, Cytokine production (20 μg/mL MOG33–55) (g) and proliferative recall response to ex vivo MOG35–55 restimulation (h) of splenocytes isolated from mice from (f (n = 3 for WT IFNγ, n = 4 for HIF-1αItgax IFNγ, IL-17 and WT GM-CSF, n = 5 otherwise). i, Absolute number of DCs in CNS from WT and HIF-1αItgax mice (n = 5 mice per group). jl, Heat map ( j), IPA (k) and GSEA analysis (l) of RNA-seq of DCs isolated from the CNS of WT or HIF-1αItgax mice subjected to EAE. Statistical analysis was performed using unpaired Student’s t-test for f and g and two-way ANOVA followed by Šídák’s multiple comparisons test for h. Data shown as mean ± s.e.m.
Extended Data Fig. 2 |
Extended Data Fig. 2 |. Effects of HIF-1α in DCs.
a, mRNA expression of shown genes in BMDCs isolated from WT mice treated with either vehicle or LPS and subjected to normoxia or hypoxia (n = 3 per group) b, mRNA expression of shown genes in BMDCs isolated from WT mice treated with LPS and ML228, DFX, or after Vhl knockdown (siVhl) (n = 3-for Il1b after LPS, Il12a and Tnf for siVhl, n = 4 otherwise). c, Vhl expression in siVhl-treated BMDCs from b (n = 3 for siNT, n = 4 for siVhl). d, Ifng and Il17a expression in 2D2+ CD4+ T cells co-cultured with WT BMDCs pre-stimulated with LPS and ML228, DFX or siVhl (n = 4 per group). e,f, HIF-1α MFI (e) and frequency of viable cells (f) of BMDCs following LPS stimulation and subjected to normoxia or hypoxia (n = 6 for viability after hypoxia, n = 4 otherwise). g,h, Experimental design (g) and S. thyphimurium CFU quantification (h) in caecum from WT (n = 4) and HIF-1αItgax (n = 5) mice 14 days after infection. i,j, S2W1 Tetramer-specific (i) and IFNγ+ and IL-17+ ( j) CD4+ T cells in colon from mice from h. Statistical analysis was performed using one-way ANOVA with Tukey’s, Dunnett’s or Šídák’s post-hoc test for selected multiple comparisons for a,b,df, or unpaired Student’s t-test for c, h-j. Data shown as mean ± s.e.m.
Extended Data Fig. 3 |
Extended Data Fig. 3 |. Effects of HIF-1α activation by L-LA on DCs
ab, Representative histogram (a) and MFI (b) of HIF-1α expression in BMDCs isolated from WT mice and treated with vehicle, LPS, L-LA, or both LPS and L-LA (n = 3 for vehicle, n = 4 otherwise). c, HIF-1α luciferase activity in BMDCs isolated from FVB.129S6-Gt(ROSA)26Sortm2(HIF1A/luc)Kael/J mice and treated with L-LA (n = 5 per group). d, Hif1a expression in BMDCs treated with vehicle or LPS (n = 3 per group). e, L-LA production of WT mouse BMDCs treated with vehicle or LPS and subjected to normoxia or hypoxia conditions (n = 4 per group). f, mRNA expression of shown genes in WT mouse BMDCs treated with vehicle or LPS and varying concentrations of L-LA (n = 4 for Il1b LPS+LA 0.1mM, Il23a LPS+LA 0.1, 1 and 10 mM and Tnf LPS+LA 1mM, n = 4 otherwise). g, mRNA expression of shown genes in human DCs after HIF1A knockdown (siHIF1A) or control (siNT) treated with LPS and L-LA or D-LA (n = 3 per group). hj, mRNA expression of shown genes in WT mouse BMDCs after Slc16a1 knockdown (siSlc16a1) or control (siNT) (h,i) or treatment with the MCT1-antagonist AZD3965 ( j) treated LPS and L-LA (n = 3 per group). Statistical analysis was performed using one-way ANOVA with Tukey’s, Šídák’s or Holm-Šídák’s post-hoc test for selected multiple comparisons for b,eh,j, or unpaired Student’s t-test for c,d,i. Data shown as mean ± s.e.m.
Extended Data Fig. 4 |
Extended Data Fig. 4 |. Effects of HIF-1α activation by D-LA on DCs.
a, mRNA expression of shown genes in splenic DCs isolated from WT or HIF-1αItgax mice stimulated with LPS or LPS and L-LA (n = 3–4 per group). b,c, mRNA expression of Hif1a (b) or HIF1A (c) after knockdown in mouse BMDCs (b) and human DCs (c) (n = 4 for siHif1 in BMDCs, n = 3 otherwise). d, Absolute numbers of HIF-1α+ DCs following treatment with D-LA or LPS with D-LA (n = 3 for media and LPS+D-LA 1 mM, n = 4 otherwise). e, mRNA expression of shown genes in splenic DCs from WT mice after LPS treatment with or without D-LA (1mM) treatment for 6h (n = 7 for Il12a in LPS treatment, n = 3 for Il23a in LPS and LPS+D-LA and Tnf in LPS, n = 4 otherwise). f, Ifng and Il17a expression in 2D2+ CD4+ T cells co-cultured DCs pre-treated with LPS or LPS and D-LA (1mM) (n = 3 for LPS-treated cells, n = 4 otherwise). Statistical analysis was performed using one-way ANOVA with Tukey’s, Šídák’s or Dunnett’s post-hoc test for selected multiple comparisons for a and d, or unpaired Student’s t-test for b,c,e,f. Data shown as mean ± s.e.m.
Extended Data Fig. 5 |
Extended Data Fig. 5 |. Effects of HIF-1α on DC metabolism.
a, ECAR in BMDCs isolated from WT or HIF-1αItgax mice after glucose, oligomycin and 2-DG treatment (n = 10 WT and 20 HIF-1α KO replicate wells). b, Glycolysis and glycolytic capacity in WT and HIF-1αItgax BMDCs from a (n = 10 WT and 17 HIF-1α KO replicate wells). c, 2-NBDG uptake and Slc2a1 expression in BMDCs isolated from WT and HIF-1αItgax mice and stimulated with LPS (n = 4–6 per group). d, Transactivation of Ndufa4l2 promoter in Ndufa4l2-luciferase transfected DC2.4 cells treated with L-LA or LPS for 24 h (n = 3 per group). e, OCR in BMDCs isolated from WT or HIF-1αItgax mice and transfected with either an empty or Ndufa4l2-overexpression plasmid (n = 6 for WT, n = 5 otherwise). f, Ndufa4l2 expression after transfection with Ndufa4l2-oxerexpression plasmid or silencing with siRNA (n = 3 per group). g, mRNA expression of shown genes in WT mouse BMDCs after Ndufa4l2 knockdown (siNdufa4l2) or controls (siNT) stimulated with LPS and treated with or without D-LA for 6 h (n = 5 for Il23a siNT LPS + D-LA, n = 6 otherwise). Statistical analysis was performed using unpaired Student’s t-test for b,c,f and one-way ANOVA with Šídák’s or Holm-Šídák’s post-hoc test for selected multiple comparisons for d,e,g. Data shown as mean ± s.e.m.
Extended Data Fig. 6 |
Extended Data Fig. 6 |. Incorporation of L-LA into TCA intermediates.
a, mRNA expression of shown genes in BMDCs isolated from WT mice and stimulated with LPS and mitoPQ or L-LA for 6 h (n = 3–4 per group). b, mRNA expression of shown genes in BMDCs isolated from WT mice and treated with mitoPQ for 6 h (n = 4–5 per group). c, 13C incorporation into TCA intermediates in BMDCs isolated from WT mice and treated with uniformly labelled 13C-lactate (L-LA*), L-LA or LPS for 1 h (n = 3 per group). d, Pyruvate intracellular levels in WT BMDCs after treatment with LPS, L-LA or D-LA for 1 h (n = 4 per group). e,f, mtROS production (e) and mRNA expression of shown genes (f) in WT BMDCs pre-treated with LDH-inhibitor oxamate, L-LA or LPS (n = 3–4 per group). g, mRNA expression of shown genes in splenic DCs isolated from WT or HIF-1αItgax mice then treated with LPS or pyruvate for 6 h (n = 3–4 per group). Statistical analysis was performed using one-way ANOVA with Tukey’s, Šídák’s or Dunnett’s post-hoc test for selected multiple comparisons for a,eg and unpaired Student’s t-test for b. Data shown as mean ± s.e.m.
Extended Data Fig. 7 |
Extended Data Fig. 7 |. Control of DCs by XBP1.
a,b, sXbp1/Xbp1 mRNA ratio in BMDCs isolated from WT mice and treated with LPS or LPS+D-LA (a) and LPS, mitoPQ or mitoTempo (MitoTP) (b) for 6 h (n = 4 per group). c,d, XBP1 recruitment to the Il1b, Il6 and Il23a promoters in WT BMDCs treated with LPS and mitoPQ (c) or LPS and ML228 (d) for 6h. e, Total numbers of IFNγ+ and IL-17+ CD4+ splenic T cells in WT (n = 3–4) and Xbp1Itgax (n = 4) mice 30 days after EAE induction. f,g, Heat map (f) and IPA (g) in CNS DCs from WT (n = 4) and Xbp1Itgax (n = 5) mice 30 days after EAE induction. Statistical analysis was performed using unpaired Student’s t-test for a,c-e and one-way ANOVA with Šídák’s post-hoc test for selected multiple comparisons for b. Data shown as mean ± s.e.m.
Extended Data Fig. 8 |
Extended Data Fig. 8 |. Effect of lactate on EAE.
a, EAE development of mice after vehicle injection (n = 9), intraperitoneal (ip) (n = 10), nasal, or intravenous (iv) (n = 5 per group) L-LA or D-LA administration. b, IFNγ+, IFNγ+IL-17+ and IL-17+ CD4+ T cells in CNS isolated from mice from a 28 days after EAE induction (n = 3–4 per group). cf, Heat map (c), GSEA (d) and IPA (e,f) analysis of RNA-seq of splenic DCs isolated from mice treated with vehicle, L-LA (e) and D-LA (f) 28 days after EAE induction. Statistical analysis was performed using two-way ANOVA for a and one-way ANOVA with Dunnett’s post-hoc test for selected multiple comparisons for b. Data shown as mean ± s.e.m.
Extended Data Fig. 9 |
Extended Data Fig. 9 |. EcNLac characterization.
a, L-LA and D-LA concentration in plasma taken from naive and peak EAE WT mice (n = 5 per group). b, Schematic depicting the genome sequencing of EcNLac and parental EcN strains. c, Schematic for the plasmid used to induce ldhA expression in the EcNLac engineered strain. d, EcNGFP reporter strain. e, GFP expression in EcNGFP after activation at 37C. f,g, D-LA concentration in plasma (f) and colon tissue (g) after EcNLac or EcN administration (n = 5–9 mice per group). h, D-LA concentration in CSF and CNS lysate from naive (n = 4–5) and EAE (n = 3) WT mice after EcNLac administration, shown relative to D-LA concentration levels in EcN-treated mice. i, Percentage of HIF-1α+ DCs out of total DCs isolated from small intestine and colon tissue from EcN (n = 3–5) or EcNLac (n = 3–4) treated mice. j,k, Heat map ( j) and GSEA (k) analysis of RNA-seq of DCs isolated from the small intestine of EcN (n = 3) or EcNLac (n = 4) treated mice. l,m, EcNLac CFUs in blood isolated from naive and peak EAE mice treated with EcNLac daily for a week (l) and EcNGFP in blood 1, 4 and 24 h after oral gavage (m). Small intestine CFU levels are shown as positive controls (n = 4–5 per group). n, Experimental design to assess the effect of EcNLac daily or weekly administration on EAE disease course. Statistical analysis was performed using two-way ANOVA with Šídák’s post-hoc test for e,f, and one-way ANOVA with Dunnett’s post-hoc test for selected multiple comparisons for i. Data shown as mean ± s.e.m.
Extended Data Fig. 10 |
Extended Data Fig. 10 |. Effects of EcNLac on EAE and S. thyphimurium infection.
a, Splenic IFNγ+ and IL-17+CD4+ T cells isolated 20 days after EAE induction from WT mice treated with EcN (n = 5–6) or EcNLac (n = 5) and HIF-1αItgax mice treated with EcN (n = 3) or EcNLac (n = 3). b,c, Proliferative recall response to ex vivo MOG35–55 restimulation (b) and cytokine production (20 μg ml−1 MOG33–55) (c) of splenocytes isolated 20 days after EAE induction from WT mice dosed daily with EcN (n = 4–8) or EcNLac (n = 3–8). dg, EAE development (d), IFNγ+ and IL-17+CD4+ T cells in CNS (e) and spleen (f), and splenocyte proliferation recall response (g) to ex vivo MOG35–55 restimulation of WT mice treated weekly with EcN (n = 4–5) or EcNLac (n = 4–5). h, CFUs in liver and caecum from WT mice infected with S. thyphimurium after daily or weekly administration of EcN (n = 5) or EcNLac (n = 4–5). ik, Percentage of S2W1 tetramer+ out of total CD4 T cells in colon (i), and liver ( j) and representative S2W1 tetramer staining of CD4 T cells in liver (k) in mice from h. l,m, HIF-1α MFI in neutrophils, monocytes and T cells (l), and number of HIF-1α+ DCs (m) in small intestine as a result of daily EcN (n = 5–8) or EcNLac (n = 5) treatment of WT mice for one week. Statistical analysis was performed using one-way ANOVA with Dunnett’s post-hoc test for selected multiple comparisons for a, two-way ANOVA followed by Šídák’s multiple comparisons test for b,d,g and unpaired Student’s t-test for c,e,f,m. Data shown as mean ± s.e.m.
Fig. 1 |
Fig. 1 |. Activation of HIF-1α by lactate inhibits the pro-inflammatory activities of DCs.
ac, Ingenuity pathway analysis (IPA) (a), hypoxia score (b) and Hif1a expression (c) in total DCs from the CNS of EAE mice. d, Expression of HIF-1α in DCs isolated from the CNS, draining lymph nodes (dLNs) and spleen of wild-type mice before (‘naive’, n = 3), 12 days (‘onset’) or 17 days (‘peak’) after EAE induction (n = 4 for CNS peak and spleen onset, n = 5 otherwise). e, EAE in wild-type (WT) (n = 15) and HIF-1αItgax (n = 9) mice. Experiment repeated three times. f, IFNγ+, IL-17+ and IFNγ+IL-17+GM-CSF+ CD4+ T cells in the CNS of wild-type and HIF-1αItgax mice 15 days after EAE induction (n = 5 mice per group). g, RNA sequencing (RNA-seq) analysis of splenic DCs at peak EAE (n = 5 mice per group). h,i, IPA (h) and GSEA for the human phenotype ontology term ‘abnormal activity of mitochondrial respiratory chain’ (i) in wild-type and HIF-1αItgax splenic DCs at peak EAE. NES, normalized enrichment score. j, Mean fluorescence intensity (MFI) of HIF-1α expression in splenic DCs treated with metabolites and LPS for 6 h, normalized to LPS stimulation. DMF, dimethyl fumarate; Pyr, pyruvate; Mal, malonate; Succ, succinate; 4-OI, 4-octyl itaconate; α-KG, α-ketoglutarate; L-LA, L-sodium lactate (n = 4 per condition). k, HIF-1α+ DCs after treatment with L-LA (0.1, 1 and 10 mM) and LPS for 6 h (n = 3 for medium, L-LA 0.1 mM, L-LA 10 mM, LPS + L-LA 10 mM, n = 4 otherwise). l, mRNA expression in wild-type BMDCs after treatment with LPS, L-LA, GPR81 antagonist or MCT1 inhibitor (n = 3 per group). m, Ifng, Il17a and Csf2 expression in 2D2+CD4+ T cells co-cultured with wild-type BMDCs pre-stimulated with L-LA and LPS (n = 4 for Il17a LPS + L-LA 0.1 mM, n = 3 otherwise). n, IFNG and IL17A expression in human T cells co-cultured with DCs (n = 3 per group). siNT, non-targeting siRNA. Statistical analysis was performed using one-way ANOVA with Dunnett’s or Šídák’s post-hoc test for selected multiple comparisons for d,k,ln, unpaired Student’s t-test for f and two-way ANOVA for e. Data are mean ± s.e.m.
Fig. 2 |
Fig. 2 |. HIF-1α-induced NDUFA4L2 limits the production of mtROS.
a, OCR in wild-type and HIF-1αItgax BMDCs after stimulation with L-LA (n = 7 for WT, n = 3 for WT + L-LA, n = 4 otherwise). b, ATP levels in BMDCs as a result of 1 mM L-LA for 6 h (n = 3 per group). c, Expression of HIF-1α target genes in BMDCs stimulated with LPS under normoxic or hypoxic conditions (n = 3 per group). d, Ndufa4l2 expression in wild-type and HIF-1αItgax splenic DCs at EAE peak stimulation (n = 4 for WT, n = 5 for HIF-1αItgax). e, Ndufa4l2 expression after 6 h of treatment with LPS + L-LA, LPS + D-LA or LPS (n = 8 for vehicle, n = 6 for LPS, n = 3 otherwise). f, Transactivation of the Ndufa4l2 promoter after overexpression of HIF-1α (n = 7 per group). g, Effect of Ndufa4l2 overexpression in LPS-stimulated BMDCs (n = 3). hk, Effect of Ndufal2 knockdown on OCR (h,i), mtROS production ( j) and gene expression (k) in BMDCs treated with LPS, LPS + L-LA or LPS + D-LA (n = 3 per group). l, mRNA expression in BMDCs treated with LPS, mitoPQ or mitoTempo for 6 h (n = 3 per group). Statistical analysis was performed using one-way ANOVA with Tukey’s, Dunnett’s or Šídák’s post-hoc test for selected multiple comparisons for a,e,il, two-way ANOVA for g and unpaired Student’s t-test for b,d,f. Data are mean ± s.e.m.
Fig. 3 |
Fig. 3 |. L-LA limits the mtROS-driven activation of XBP1 in DCs.
a, Spliced Xbp1 mRNA normalized to total Xbp1 mRNA (sXbp1/Xbp1 ratio) in BMDCs isolated from wild-type mice and treated with LPS (n = 6), LPS + L-LA (n = 5) or LPS + L-LA + mitoPQ (n = 3) for 6 h. b, sXPB1/XBP1 mRNA ratio in human DCs treated with LPS, LPS + D-LA or LPS + L-LA for 6 h (n = 5 per group). ce, XBP1-binding sites (top) and recruitment of XBP1 to Il1b (c), Il6 (d) and Il23a (e) promoters in BMDCs isolated from wild-type mice determined by chromatin immunoprecipitation (ChIP) after treatment with LPS, LPS + D-LA or LPS + L-LA for 6 h (n = 4 for Il1b LPS + D-LA, n = 3 otherwise). f, sXbp1/Xbp1 mRNA ratio in wild-type (n = 5) and HIF-1αItgax (n = 5) splenic DCs isolated at peak EAE. g, sXbp1/Xbp1 mRNA ratio in wild-type BMDCs transfected with either an empty plasmid (n = 5) or an Ndufa4l2-overexpression plasmid (n = 5). h, EAE development in wild-type (n = 15) and XBP1Itgax (n = 15) mice. Experiment repeated three times. i, IFNγ+, IFNγ+IL-17+ and IL-17+ CD4+ T cells isolated from the CNS of wild-type (n = 5–6) and XBP1Itgax (n = 5) EAE mice. j,k, Cytokine production ( j) and proliferative recall response to ex vivo MOG35–55 restimulation for 72 h (k) of splenocytes from EAE wild-type and Xbp1Itgax mice (n = 6 for IFNγ and IL-10 WT, n = 5 mice otherwise). CPM, counts per million. l,m, IPA (l) and heat map (m) of RNA-seq analysis of wild-type (n = 5) and Xbp1Itgax (n = 5) splenic DCs isolated 30 days after EAE induction. Statistical analysis was performed using one-way ANOVA with Dunnett’s or Šídák’s post-hoc test for selected multiple comparisons for ae, unpaired Student’s t-test for f,g,i,j and two-way ANOVA for h,k. Data are mean ± s.e.m.
Fig. 4 |
Fig. 4 |. Activating HIF-1α–NDUFA4L2 with engineered probiotics ameliorates EAE.
a, Engineered EcNLac strain. b, Concentrations of D-LA and L-LA in culture supernatants after EcNLac or EcN incubation at 37 °C (n = 3 per group). c, Concentration of D-LA in small-intestinal tissue after daily administration of EcN (n = 3 at 1 h and 24 h, n = 5 at 4 h) or EcNLac (n = 4 at 1 h and 24 h, n = 5 at 4 h) for a week compared to untreated controls (n = 5 mice). d,e, Immunostaining analysis of HIF-1α, NDUFA4L2 and spliced XBP1 (d) and quantification (e) in CD11c+ cells from the small intestine after daily administration of EcNLac or EcN for a week (n = 5 mice per group). Data quantified from tile scan images of full tissue sections from each mouse. Experiment repeated twice. AU, arbitrary units. f, EAE in wild-type and HIF-1αItgax mice treated with EcN (n = 5 WT, 5 HIF-1αItgax mice) or EcNLac (n = 19 WT, 4 HIF-1αItgax mice). Experiment repeated three times. g, Quantification of IFNγ+, IL-17+ and IFNγ+IL-17+ CD4+ T cells in the CNS of mice from f (n = 5 for IL-17 WT EcN, n = 4 for WT EcNLac, n = 3 otherwise). h, Quantification of IFNγ+ and IL-17+ CD4+ T cells in the small intestine of wild-type mice treated with EcN (n = 8) or EcNLac (n = 9) after EAE induction. i,j, sXbp1/Xbp1 mRNA ratio (i) and Il1b, Il6, Il23a and Tnf mRNA expression ( j) in small-intestinal DCs from EcN- or EcNLac-treated mice (n = 4 for Il23a and Tnf, n = 3 otherwise). k, Representative dot plot of Kaede photoconversion in CD4+ T cells isolated from the spleen. l, Total, IFNγ+ and IL-17+ CD4+ T cells photoconverted in the spleen of wild-type mice treated with EcN (n = 5) or EcNLac (n = 4). Statistical analysis was performed using two-way ANOVA followed by Šídák’s multiple comparisons test for b,c,f, unpaired Student’s t-test for e,hj,l and one-way ANOVA with Šídák’s post-hoc test for selected multiple comparisons for g. Data are mean ± s.e.m.

Update of

Comment in

References

    1. Anderson DA III, Dutertre CA, Ginhoux F. & Murphy KM Genetic models of human and mouse dendritic cell development and function. Nat. Rev. Immunol 21, 101–115 (2021). - PMC - PubMed
    1. Cabeza-Cabrerizo M, Cardoso A, Minutti CM, Pereira da Costa M. & Reis ESC Dendritic cells revisited. Annu. Rev. Immunol 39, 131–166 (2021). - PubMed
    1. Nasser J. et al.. Genome-wide enhancer maps link risk variants to disease genes. Nature 593, 238–243 (2021). - PMC - PubMed
    1. Saevarsdottir S. et al. FLT3 stop mutation increases FLT3 ligand level and risk of autoimmune thyroid disease. Nature 584, 619–623 (2020). - PubMed
    1. Dixon KO et al. TIM-3 restrains anti-tumour immunity by regulating inflammasome activation. Nature 595, 101–106 (2021). - PMC - PubMed

MeSH terms