. 2023 Aug;620(7975):890-897.
doi: 10.1038/s41586-023-06423-8. Epub 2023 Aug 9.

Mitochondrial integrated stress response controls lung epithelial cell fate

Affiliations

Mitochondrial integrated stress response controls lung epithelial cell fate

SeungHye Han et al. Nature. 2023 Aug.

Abstract

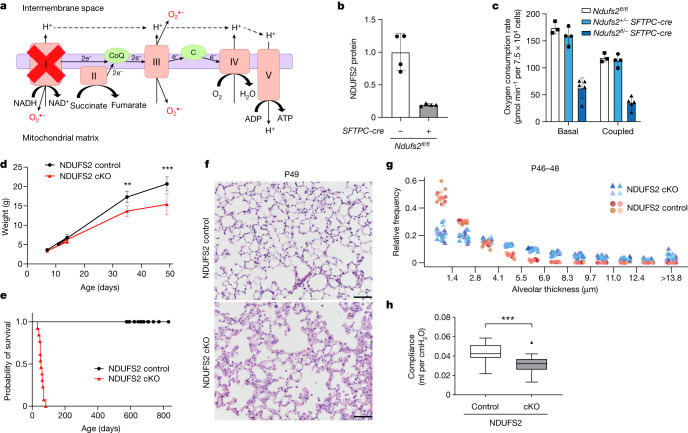
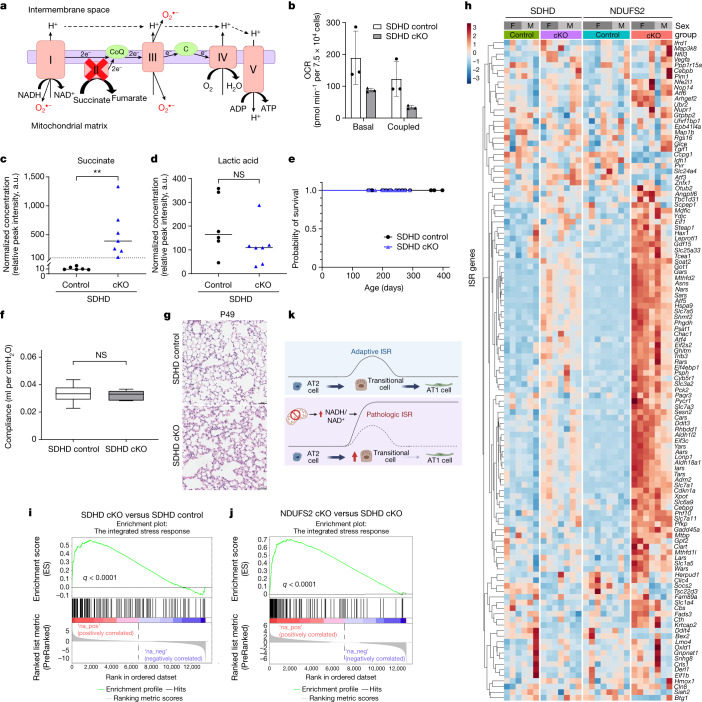
Alveolar epithelial type 1 (AT1) cells are necessary to transfer oxygen and carbon dioxide between the blood and air. Alveolar epithelial type 2 (AT2) cells serve as a partially committed stem cell population, producing AT1 cells during postnatal alveolar development and repair after influenza A and SARS-CoV-2 pneumonia1-6. Little is known about the metabolic regulation of the fate of lung epithelial cells. Here we report that deleting the mitochondrial electron transport chain complex I subunit Ndufs2 in lung epithelial cells during mouse gestation led to death during postnatal alveolar development. Affected mice displayed hypertrophic cells with AT2 and AT1 cell features, known as transitional cells. Mammalian mitochondrial complex I, comprising 45 subunits, regenerates NAD+ and pumps protons. Conditional expression of yeast NADH dehydrogenase (NDI1) protein that regenerates NAD+ without proton pumping7,8 was sufficient to correct abnormal alveolar development and avert lethality. Single-cell RNA sequencing revealed enrichment of integrated stress response (ISR) genes in transitional cells. Administering an ISR inhibitor9,10 or NAD+ precursor reduced ISR gene signatures in epithelial cells and partially rescued lethality in the absence of mitochondrial complex I function. Notably, lung epithelial-specific loss of mitochondrial electron transport chain complex II subunit Sdhd, which maintains NAD+ regeneration, did not trigger high ISR activation or lethality. These findings highlight an unanticipated requirement for mitochondrial complex I-dependent NAD+ regeneration in directing cell fate during postnatal alveolar development by preventing pathological ISR induction.


Conflict of interest statement

The authors declare no competing interests.

Figures

Fig. 1
Fig. 1. Mitochondrial complex I in lung epithelial cells is necessary for postnatal lung development.
a, Schematic of the mitochondrial ETC in lung epithelial cells of NDUFS2 cKO mice. b, Immunoblot analysis of NDUFS2 protein normalized to vinculin in lung epithelial cells isolated from 11-day-old mice. Data represent mean ± s.d. (n = 4 mice in each genotype with technical replicates). c, Basal and coupled OCR of lung epithelial cells isolated from 43- to 46-day-old mice. Data represent mean ± s.d. (Ndufs2fl/fl n = 3; NDUFS2 control n = 4; NDUFS2 cKO n = 5 mice with technical replicates). d, Body weight in grams (control n = 34; cKO n = 18 mice). Data represent mean ± s.d. **P = 0.0040, ***P = 0.0005 by Mann–Whitney test. e, Survival of NDUFS2 control (n = 21) and NDUFS2 cKO (n = 13) mice (P < 0.0001 by log-rank test). f, Representative images of lung histology on postnatal day 49 (haematoxylin and eosin stain). Scale bar, 100 μm. g, The frequency distribution of alveolar thickness measured in haematoxylin and eosin-stained lung histology of 46- to 48-day-old mice (n = 4 mice, two males and two females per genotype). Four to six randomly selected fields of view from each mouse were evaluated. The x axis shows alveolar thickness bins and the y axis shows the number of alveolar pixels that belong to the respective alveolar thickness bin normalized to the total alveolar pixel count in the image. Each animal is represented by its own colour. Statistical significance for genotype was calculated based on F-test for a linear model (P = 4.56 × 10−5). h, Box plots of lung compliance in 46- to 49-day-old mice (control n = 33; cKO n = 24 mice with technical replicates), P < 0.0001 by Mann–Whitney test. Source Data
Fig. 2
Fig. 2. Expression of the yeast NDI1, an alternative NADH dehydrogenase, in lung epithelial cells reverses abnormal postnatal alveolar development in NDUFS2 cKO mice.
a, Schematic of the mitochondrial ETC with ectopic NDI1. b,c, Metabolomics analysis of lung epithelial cells isolated from 35-day-old mice (NDUFS2 control n = 8; NDUFS2 control/NDI1 n = 7; NDUFS2 cKO n = 7; NDUFS2 cKO/NDI1 n = 8 mice). b, Relative abundance of lactic acid. Lines represent median. P = 0.0013 by Kruskal–Wallis test b. c, The heat map displays the relative abundance of significantly changed metabolites c. α-KG, α-ketoglutarate; AICA, 5-aminoimidazole-4-carboxamide; DHAP, dihydroxyacetone phosphate; DOPAL, 3,4-dihydroxyphenylacetaldehyde; F6P, fructose-6 phosphate; G1P, glucose-1 phosphate; G6P, glucose-6 phosphate; GAP, glyceraldehyde 3-phosphate; IMP, inosine monophosphate; l-NMMA, NG-monomethyl-l-arginine; XMP, xanthosine monophosphate. d, Survival of NDUFS2 cKO (n = 12) and NDUFS2 cKO/NDI1 (n = 22) mice (P < 0.0001 by log-rank test). e, Representative images of littermates’ lung histology (haematoxylin and eosin stain) in 46-day-old mice. Scale bar, 50 μm. f, Box plots of lung compliance of 46- to 50-day-old mice (NDUFS2 control n = 21; NDUFS2 cKO n = 11; NDUFS2 cKO/NDI1 n = 12 mice with technical replicates). P = 0.0016 by one-way analysis of variance. Adjusted P values by Šídák’s multiple comparisons test in the graph. a.u., arbitrary units. Source Data
Fig. 3
Fig. 3. A distinct epithelial population of transitional cells emerges during postnatal lung development in NDUFS2 cKO mice.
a, Uniform manifold approximation and projection (UMAP) plot showing single-cell RNA-seq analysis of 57,886 cells isolated from 21-day-old mouse lungs (n = 4 mice (two males and two females) in each genotype). aCAP, alveolar capillary endothelial cells; Art, arterial endothelial cells; B, B cells; CM, classical monocytes; DC.1, dendritic cells 1; DC.2, dendritic cells 2; FIB.1, fibroblasts 1; FIB.2, fibroblasts 2; gCAP, general capillary endothelial cells; ILC, innate lymphoid cells; IM, interstitial macrophages; lymph EC, lymphatic endothelial cells; MP, macrophages; NCM, non-classsical monocytes; NK, natural killer cells; Pl.DC, proliferating dendritic cells; Pl.MP, proliferating macrophages; SM, smooth muscle cells; T, T cells; Treg, regulatory T cells (Extended Data Table 1). b, UMAP plot depicting cell origins with respect to the mouse genotype. c, UMAP plot showing the expression of a Sftpc lineage tracing fluorescent marker, tdTomato. Darker colour represents higher expression. d, UMAP embedding of lung epithelial cells (n = 9,322 cells) coloured by cell type. CiliaSecretory, club cells and ciliated cells. e, UMAP plot depicting epithelial cell origins with respect to the mouse genotype. f, Bar plots demonstrating the composition of epithelial subclusters in cells from NDUFS2 control and NDUFS2 cKO mice. g, Marker gene expression by epithelial cell type in each mouse genotype is displayed in a dot plot, where the size of the dot indicates the proportion of cells within the cell type expressing that gene and higher expression is represented as a darker colour. In this dot plot, AT2 and AT2-Lyz1+ clusters and Transitional and Transitional-Lyz1+ clusters were merged into ‘AT2’ and ‘Transitional’, respectively. Source Data
Fig. 4
Fig. 4. Loss of mitochondrial complex I in lung epithelial cells induces a robust ISR that precludes alveolar development.
a,b, RNA-seq analysis of lung epithelial cells isolated from 35-day-old mice (NDUFS2 control n = 8; NDUFS2 control/NDI1 n = 7; NDUFS2 cKO n = 7; NDUFS2 cKO/NDI1 n = 8 mice). a, Heat map of ATF transcripts and Ddit3. b, Heat map of ISR signature gene transcripts. c, UMAP plot showing expression of Atf genes in single-cell RNA-seq analysis of epithelial cells. d, UMAP displaying the level of ISR enrichment score calculated from the overall expression of ISR genes in each epithelial cell. Darker colour indicates a higher ISR enrichment score and thus a highly enriched ISR gene signature. e, Violin plots of ISR enrichment scores in epithelial subclusters. P < 2.2 × 10−16 by Kruskal–Wallis test. Transitional cells and Transitional-Lyz1+ cells have more enriched ISR gene signatures than other epithelial cells (***adjusted P < 1.0 × 10−29 by post hoc pairwise Mann–Whitney test with Holm method; P values are in the Source Data). f, The ISRIB reduces NDUFS2 cKO lethality. Survival of NDUFS2 cKO mice with or without ISRIB (NDUFS2 cKO n = 15; NDUFS2 cKO + ISRIB n = 27 mice; P < 0.0001 by log-rank test) and NDUFS2 control mice with ISRIB (NDUFS2 control + ISRIB n = 14 mice). Source Data
Fig. 5
Fig. 5. Developmental loss of mitochondrial complex II in lung epithelial cells is not detrimental.
a, Schematic of the mitochondrial electron transport chain in lung epithelial cells of SDHD cKO mice. b, Basal and coupled OCR of lung epithelial cells isolated from 4-month-old mice (n = 3 mice per genotype with technical replicates). Data represent mean ± s.d. c,d, Relative abundance of succinate (c) and lactic acid (d) in lung epithelial cells isolated from 35-day-old mice (SDHD control n = 6; SDHD cKO n = 7 mice). Lines represent median. P = 0.0012 (c) and P = 0.0734 (d) by Mann–Whitney test. e, Survival of SDHD control (n = 34) and SDHD cKO (n = 37) mice (P > 0.9999 by log-rank test). f, Box plots of static lung compliance in 47- to 49-day-old mice (SDHD control n = 15; SDHD cKO n = 5 mice), P = 0.7354 by Mann–Whitney test. g, Representative images of lung histology on postnatal day 49 (haematoxylin and eosin stain). Scale bar, 50 μm. hj, RNA-seq analysis of lung epithelial cells from 35-day-old mice (SDHD control n = 6; SDHD cKO n = 7; NDUFS2 control n = 8; NDUFS2 cKO n = 7 mice). Data in Fig. 4a,b were partly included. h, Heat map of ISR signature gene transcripts. i,j, Enrichment plot of the ISR signature genes in lung epithelial cells from SDHD cKO versus SDHD control mice (i) (normalized enrichment score (NES) 2.15; false discovery rate (FDR) q < 0.0001) and those from NDUFS2 cKO versus SDHD cKO mice (j) (NES 2.80; FDR q < 0.0001). k, During the transitional cell state, the adaptive ISR is transiently induced and subsequently subsides as transitional cells differentiate into AT1 cells. Loss of mitochondrial complex I function results in an increase in the NADH/NAD+ ratio, leading to persistently high-level activation of the ISR. Chronically high ISR alters cell fate by preventing the successful differentiation of transitional cells into AT1 cells. Fig 5k created with BioRender.com. NS, not significant. Source Data
Extended Data Fig. 1
Extended Data Fig. 1. Loss of mitochondrial complex I in lung epithelial cells during development induces aberrant hypercellular lung structure with thickened alveolar walls resulting in postnatal death.
a–b, Changes in metabolism-related gene signatures during murine lung epithelial development. Re-analysis of epithelial cells from single-cell RNA-seq data from a mouse lung development atlas (n = 13,445 cells). Violin plots showing enrichment scores of glycolysis (a) and oxidative phosphorylation gene signatures (b) measured by UCell algorithm. A higher score indicates higher enrichment of the gene signature. The gene lists are retrieved from hallmark gene sets in the Molecular Signatures Database (MSigDB). Glycolysis gene signatures at E12 and E15 are more enriched than those at P0 – P14, while oxidative phosphorylation gene signature at P14 is more enriched than those at P0 – P7 (*** adjusted p < 1.0 x 10⁻⁵ by post-hoc pairwise Mann-Whitney test with Holm method, p values are in the Source Data). p < 2.2 x 10⁻¹⁶ by Kruskal-Wallis test for both glycolysis and oxidative phosphorylation gene enrichment scores. c, Survival of male NDUFS2 control (n = 9) and male NDUFS2 cKO (n = 8) mice (p < 0.0001 by log-rank test). d, Survival of female NDUFS2 control (n = 12) and female NDUFS2 cKO (n = 5) mice (p < 0.0001 by log-rank test). e–g, Representative images of lung necropsy from NDUFS2 cKO (n = 4 mice). Alveolar airspaces are filled with pink, homogenous material (hyaline membranes), suggesting the mice died from respiratory failure (e). The pink homogenous materials are negative for Periodic acid–Schiff (PAS) stain (f). Positive PAS stain (arrowhead) in a different region from the same lung histology section staining (g). Scale bar, 100 μm. h–q, Lung histology of 49-day-old mice stained for TUNEL assay (apoptosis), CD45 (leukocyte marker), Ki67 (proliferation), surfactant protein C (SPC, AT2 marker), and podoplanin (PDPN, AT1 marker). n′–q′, high-magnification images. Scale bars, 100 μm (h–m), 20 μm (n–q), and 10 μm (n′–q′). r–t, Quantification of percent CD45+, TUNEL+, and Ki67+ cells (mean ± SD) in 35-day-old mouse lungs. p = 0.2286 (TUNEL+), p = 0.2571 (CD45+) and p = 0.0286 (Ki67+) by Mann-Whitney test. (n = 2540–4930 cells evaluated from at least three randomly selected fields of view in each mouse; NDUFS2 control n = 6 (CD45+), n = 3 (TUNEL+), n = 4 (Ki67+); NDUFS2 cKO n = 4 (CD45+), n = 4 (TUNEL+), n = 4 (Ki67+) mice, both male and female). Source Data
Extended Data Fig. 2
Extended Data Fig. 2. In situ RNA hybridization with amplification confirms the postnatal disruption of spatial organization between different cell types in NDUFS2 cKO lungs.
a–b, Lung sections from 21-day-old NDUFS2 control and NDUFS2 cKO mice (n = 3 each genotype, both male and female) were hybridized with the indicated target probes (RNAscope®). Magnified images (boxed region) are shown on the right. Representative lung sections (a) showing alveolar type 2 (AT2) cells by Sftpc (gray) have 1:1 direct contact with Pdgfra+ fibroblasts (magenta) in NDUFS2 control lungs, whereas 1:1 relationship between Sftpc+ cells and Pdgfra+ fibroblasts are lost in NDUFS2 cKO lungs. Hypertrophic Sftpc+ cells in NDUFS2 cKO lungs cluster next to each other along the alveolar walls while Sftpc+ AT2 cells in NDUFS2 control lungs locate individually at the corner of alveolar sacs. Representative lung sections (b) showing Car4+ endothelial cells (cyan, arrows) locate next to linear thin Sftpc- AT1 cells in NDUFS2 control mice. However, in NDUFS2 cKO lungs, Car4+ endothelial cells (cyan) are located next to linear thin Sftpc+ cells (gray, asterisk). Please note that Sftpc is an AT2 marker (cuboidal) that does not normally express in linear thin AT1 cells. Scale bars, 50 μm and 20 μm (magnified inset). c–g, Mitochondrial complex I in lung epithelial cells is dispensable for antenatal lung development. Representative images of littermates’ lung histology (hematoxylin-eosin stain) at different time points (E, embryonic day; P, postnatal day). Branching morphogenesis during antenatal development is not grossly disrupted in NDUFS2 cKO mice compared to NDUFS2 control mice (c,d). The subtle differences in alveolar structure between NDUFS2 cKO and NDUFS2 control mice at P11 become apparent by P21 (e–g). Scale bars, 200 μm (c,d), 50 μm (e–g).
Extended Data Fig. 3
Extended Data Fig. 3. Expression of the yeast NDI1 protein in lung epithelial cells does not disrupt lung development or physiology, and restores abnormal alveolar structures in NDUFS2 cKO mice.
a, Representative images of lung histology (hematoxylin-eosin stain) from 48-day-old mice. NDI1LSL mice and SFTPC-Cre;NDI1LSL mice are referred to as WT and NDI1, respectively (scale bar, 50 μm). b, Box plots of static lung compliance in 48–49-day-old mice (WT n = 12; NDI1 n = 10 mice with technical replicates), p = 0.6744 by Mann-Whitney test. c, Intracellular NADH/NAD+ ratios from metabolomics analysis of lung epithelial cells isolated from 35-day-old mice (NDUFS2 control n = 8; NDUFS2 control/NDI1 n = 7; NDUFS2 cKO n = 7; NDUFS2 cKO/NDI1 n = 8 mice). p = 0.0006 by Kruskal-Wallis test. d, The frequency distribution of alveolar thickness measured in hematoxylin-eosin stained lung histology of 46–49-day-old mice (n = 4 mice, two males and two females per genotype). 4–6 randomly selected fields of view from each mouse were evaluated. The x axis shows alveolar thickness bins, and the y axis shows the number of alveolar pixels that belong to the respective alveolar thickness bin normalized to the total alveolar pixel count in the image. Each animal is represented by its own color. Statistical significance for genotype was calculated based on F-test for a linear model (p = 4.66 x 10⁻⁵). e, Representative images of lung histology (hematoxylin-eosin stain) from 2-year-old mice (scale bar, 50 μm), f, Box plots of lung compliance in 18–25-month-old mice (NDUFS2 control n = 4; NDUFS2 control/NDI1 n = 5; NDUFS2 cKO/NDI1 n = 15 mice with technical replicates), p = 0.3847 by Kruskal-Wallis test. g–h, Metabolomics analysis of lung epithelial cells isolated from 35-day-old mice (NDUFS2 control n = 8; NDUFS2 control/NDI1 n = 7; NDUFS2 cKO n = 7; NDUFS2 cKO/NDI1 n = 8 mice). Lines represent median. Relative abundance of aspartate. p = 0.7515 by Kruskal-Wallis test (g). Relative abundance of asparagine. p = 0.0253 by Kruskal-Wallis test. * p = 0.0259 by Dunn’s multiple comparisons test (h). Source Data
Extended Data Fig. 4
Extended Data Fig. 4. Single-cell RNA-sequencing analysis confirms that Ndufs2 deletion is specific to distal lung epithelium in NDUFS2 cKO mice.
a, Mki67 expression by genotype in each tissue type or in Sftpc lineage (tdTomato)-positive cells. Mki67+ cells were defined as cells with normalized UMI (unique molecular identifier) counts of Mki67 > 0 using sctransform. p values by Pearson’s chi-squared test. b, Heatmap showing expression of selected hallmark identifier genes for each clustered cell type. c, Relative contributions to each clustered cell type from NDUFS2 control and NDUFS2 cKO lungs. d–e, Expression of Ndufs2 gene in all clusters (d) and epithelial subclusters (e). Ndufs2 was deleted only in the distal lung epithelium.
Extended Data Fig. 5
Extended Data Fig. 5. Postnatal transitional cells express early basal cell markers.
a, Bar plots demonstrating the composition of epithelial subclusters in each individual mouse (n = 8 mice). The transitional cell cluster was consistently expanded in all four NDUFS2 cKO mice compared with NDUFS2 control mice. M, male; F, female. b, Heatmap showing expression of hallmark identifier genes for each epithelial cell type. Early basal cell marker genes (Krt8, Krt18, Krt7, Krt19) are highly expressed in transitional cells and some of the AT1 cluster. c, Cell-cycle score analysis of epithelial cells was performed and plotted on a UMAP embedding. Cells predicted to be in G0/G1, G2/M, and S phases are shown in separate UMAPs, respectively. No subcluster of epithelial cells was predicted to be in a specific cell-cycle phase. d, Volcano plots visualizing the differential gene expression results by mouse genotype in the AT1 cluster from single-cell RNA sequencing analysis. x axis shows average log2 fold change, and y axis shows −log10 false discovery rate (FDR) q value. e, UMAP embedding of AT1 cells (n = 723 cells) colored by subcluster. f, UMAP plot depicting AT1 cell origins with respect to the mouse genotype. g, Bar plots demonstrating the composition of AT1 subclusters in NDUFS2 control and NDUFS2 cKO mice. h, Heatmap showing expression of epithelial marker genes in AT1 subclusters. Cells in the AT1_1 cluster express higher level of transitional cell marker genes compared to those in other AT1 subclusters. Source Data
Extended Data Fig. 6
Extended Data Fig. 6. Sfrp1+ mesenchymal cells emerge in NDUFS2 cKO lungs.
Single-cell RNA-seq subclustering analysis with mesenchymal cells (Col1a1+ clusters except mesothelial cells, n = 6,252 cells) shows expansion of Sfrp1+ cell populations in NDUFS2 cKO mice compared to NDUFS2 control mice. a, UMAP embedding of lung mesenchymal cells, colored by cell type. Annotation per the recently published 3-axes classification system. b, UMAP plot depicting mesenchymal cell origins in regard to the mouse genotype. c, Bar plots demonstrating the composition of mesenchymal subclusters in cells from NDUFS2 control and NDUFS2 cKO mice. d, Heatmap showing selected marker gene expression in different mesenchymal cellular subsets. e–g, Lung sections from 21-day-old NDUFS2 control and NDUFS2 cKO mice (n = 3 each genotype, both male and female) were in situ RNA hybridized with indicated target probes (RNAscope®). Magnified images (boxed region) are shown on the right. Representative lung sections (e–f) showing subpopulations of fibroblasts, double positive for Pdgfra+ (magenta, arrow) and Sfrp1+ (cyan, arrow), emerge in NDUFS2 cKO lungs. Scale bars, 50 μm and 20 μm (magnified inset). f′, Magnified images of dotted line boxed region shows a fibroblast, double positive for Pdgfra+ (magenta, arrow) and Sfrp1+ (cyan, arrow) is located next to a linear thin Sftpc+ cell (gray, asterisk). Representative images (g) of lung sections in situ RNA hybridized with negative control probes. Scale bars, 50 μm and 20 μm (magnified inset). h–i, UMAP plots showing expression of Sfrp1 (h) and Timp1 (i) in subclusters of mesenchymal cells. Darker color indicates higher expression. Source Data
Extended Data Fig. 7
Extended Data Fig. 7. Postnatal transitional cells are characterized by increased ISR.
a, Gene set enrichment analysis of top gene signatures that are up-regulated (blue) or down-regulated (red) in lung epithelial cells from NDUFS2 cKO mice (n = 7) compared to NDUFS2 control mice (n = 8). FDR ≤ 0.05. b, Enrichment plot of the ISR signature genes in lung epithelial cells from NDUFS2 cKO mice (n = 7) compared to NDUFS2 control mice (n = 8) (normalized enrichment score; 2.80, false discovery rate q value <0.0001). c, Expression levels of Atf genes in epithelial subclusters are plotted in violin plots. d, Violin plots of ISR enrichment scores across all the cell clusters. p < 2.2 × 10−16 by Kruskal-Wallis test. Transitional cells have more enriched ISR gene signature than any other cell types (*** adjusted p < 2.0 x 10⁻¹⁶ by post-hoc pairwise Mann-Whitney test with Holm method, p values are in the Source Data). e, Heatmap of ISR signature genes by epithelial subclusters. Results are from RNA-sequencing analysis of lung epithelial cells isolated from fifteen 35-day-old mice (a–b, related to Fig. 4a-b), and single-cell RNA sequencing analysis from eight 21-day-old mice (c–e). Source Data
Extended Data Fig. 8
Extended Data Fig. 8. Postnatal transitional cells from NDUFS2 cKO mice display distinct features compared to those identified in other postnatal or adult lung injury and repair models.
a–d, Re-analysis of postnatal lung epithelium from Negretti et al. (mouse lung development atlas, n = 11,807 cells) integrated with our single-cell RNA-seq data of epithelium (9,322 cells). ISR enrichment scores across the postnatal epithelial cell types within the single-cell mouse lung development atlas (a). Higher score indicates higher enrichment of the ISR signature genes. p < 2.2 × 10−16 by Kruskal-Wallis test. Transitional cells have more enriched ISR gene signatures than other epithelial cells (** adjusted p < 0.01 by post-hoc pairwise Mann-Whitney test with Holm method, p values are in the Source Data). Violin plots (b) showing ISR enrichment score in transitional cells from two single-cell RNA-seq data. p < 2.2 × 10−16 by Mann-Whitney test. UMAP embedding of integrated postnatal lung epithelial cells (c) colored by the cell types as annotated in original analyses. RNA-velocity vectors (d) were calculated and overlaid on the UMAP embedding. While normal postnatal transitional cells are predicted to differentiate to AT1 cells by RNA velocity analysis, transitional cells in NDUFS2 cKO mice are not. Please note that RNA velocity estimates should be interpreted with caution as they can be biased by a low-dimensional representation. e–h, Re-analysis of lung epithelium from Hurskainen et al. (postnatal hyperoxia model, n = 9,975 cells) integrated with our single-cell RNA-seq data of epithelium (9,322 cells). ISR enrichment scores in AT2 cells from hyperoxia-exposed lungs and normoxia-exposed lungs are shown in violin plots (e). p = 1.3 × 10−12 by Mann-Whitney test. Violin plots showing ISR enrichment scores in transitional cells from NDUFS2 cKO mice and AT2 cells from hyperoxia-exposed mice (f). p < 2.2 × 10−16 by Mann-Whitney test. UMAP embedding of integrated lung epithelial cells (g) colored by the same cell type as annotated in original analyses. RNA-velocity vectors were calculated and overlaid on the UMAP plots depicting cell identity by experimental conditions (h). i–j, Re-analysis of lung epithelium from Strunz et al. (adult bleomycin injury model, n = 32,559 cells) integrated with our single-cell RNA-seq data of epithelium (9,322 cells). ISR enrichment scores across the epithelial cell types within Strunz et al. dataset (i). p < 2.2 × 10−16 by Kruskal-Wallis test. ISR gene signatures of Krt8+ ADI cells are more enriched compared to other cell types (*** adjusted p < 2.0 × 10−16 by post-hoc pairwise Mann-Whitney test with Holm method, p values are in the Source Data). Violin plots (j) showing ISR enrichment score in transitional cells from two single-cell RNA-seq data. p < 2.2 × 10−16 by Mann-Whitney test. k–l, Re-analysis of lung epithelium from Choi et al. (adult bleomycin injury model, n = 12,179 cells) integrated with our single-cell RNA-seq data of epithelium (9,322 cells). ISR enrichment scores across the epithelial cell types within Choi et al. dataset (k). p < 2.2 × 10−16 by Kruskal-Wallis test. ISR gene signatures of DATPs are more enriched than primed AT2, cycling AT2, and AT1 (*** adjusted p < 2.0 × 10−16 by post-hoc pairwise Mann-Whitney test with Holm method, p values are in the Source Data). Violin plots (l) showing ISR enrichment score in transitional cells from two single-cell RNA-seq data. p < 2.2 × 10−16 by Mann-Whitney test. m–n, Re-analysis of lung epithelium from Kobayashi et al. (mouse lung organoids, n = 5,705 cells) integrated with our single-cell RNA-seq data of epithelium (9,322 cells). ISR enrichment scores across the epithelial cell types within Kobayashi et al. dataset (m). p < 2.2 × 10−16 by Kruskal-Wallis test. ISR gene signatures of PATS are more enriched than those of other epithelial cells (* adjusted p < 0.05, *** adjusted p < 1.0 × 10−14 by post-hoc pairwise Mann-Whitney test with Holm method, p values are in the Source Data). Violin plots (n) showing ISR enrichment scores in transitional cells from two single-cell RNA-seq data. p < 2.2 × 10−16 by Kruskal-Wallis test. *** adjusted p < 2.0 × 10−16 by post-hoc pairwise Mann-Whitney test with Holm method. Source Data
Extended Data Fig. 9
Extended Data Fig. 9. Inhibiting the ISR improves structural abnormalities in NDUFS2 cKO mice.
Representative images of lung histology (hematoxylin-eosin stain) from a, 5-month-old NDUFS2 control mice, b, 49-day-old NDUFS2 cKO mice that did not receive ISRIB, prior to death, and c, 5-month-old NDUFS2 cKO mice that received ISRIB. Scale bars, 1 mm (whole lung images) and 50 μm (close-up images). d, Survival of male NDUFS2 cKO mice with or without ISRIB (NDUFS2 cKO n = 7; NDUFS2 cKO + ISRIB n = 14 mice; p = 0.0002 by log-rank test) and male NDUFS2 control mice with ISRIB (NDUFS2 control + ISRIB n = 8 mice). e, Survival of female NDUFS2 cKO mice with or without ISRIB (NDUFS2 cKO n = 8; NDUFS2 cKO + ISRIB n = 13 mice; p < 0.0001 by log-rank test) and female NDUFS2 control mice with ISRIB (NDUFS2 control + ISRIB n = 6 mice). f, Survival of NDUFS2 cKO mice with or without NMN (NDUFS2 cKO n = 18; NDUFS2 cKO + NMN n = 22 mice; p = 0.0010 by log-rank test) and NDUFS2 control mice with NMN (NDUFS2 control + NMN n = 13). g, Survival of male NDUFS2 cKO mice with or without NMN (NDUFS2 cKO n = 9; NDUFS2 cKO + NMN n = 10 mice; p = 0.0087 by log-rank test) and male NDUFS2 control mice with NMN (NDUFS2 control + NMN n = 7). h, Survival of female NDUFS2 cKO mice with or without NMN (NDUFS2 cKO n = 9; NDUFS2 cKO + NMN n = 12 mice; p = 0.0284 by log-rank test) and female NDUFS2 control mice with NMN (NDUFS2 control + NMN n = 6).
Extended Data Fig. 10
Extended Data Fig. 10. Administration of ISRIB or NMN decreases the pathologic ISR activation observed in NDUFS2 cKO mice.
a–c, RNA-sequencing analysis of lung epithelial cells isolated from 35-day-old mice (WT n = 6; NDUFS2 control n = 21; NDUFS2 control + ISRIB n = 8; NDUFS2 control + NMN n = 11; NDUFS2 control/NDI1 n = 7; NDUFS2 cKO n = 13; NDUFS2 cKO + ISRIB n = 9; NDUFS2 cKO + NMN n = 11; NDUFS2 cKO/NDI1 n = 8 mice). Data in Fig. 4a-b were included in the analysis. Heatmaps of Ndufs2 and ISR signature gene transcripts (a). Enrichment plots of the ISR signature genes in lung epithelial cells from NDUFS2 cKO mice with vs. without ISRIB (b) (normalized enrichment score; −2.51, false discovery rate q value <0.0001), and NDUFS2 cKO mice with vs. without NMN (c) (normalized enrichment score; −2.39, false discovery rate q value <0.0001). d, Intracellular NADH/NAD+ ratios in lung epithelial cells from 35-day-old mice (NDUFS2 control n = 13; NDUFS2 control + ISRIB n = 8; NDUFS2 control + NMN n = 9; NDUFS2 cKO n = 7; NDUFS2 cKO + ISRIB n = 9; NDUFS2 cKO + NMN n = 9; WT n = 6 mice). p < 0.0001 by ANOVA. Adjusted p values by Šídák’s multiple comparisons test were provided in the graph. Source Data
Extended Data Fig. 11
Extended Data Fig. 11. Inhibition of mitochondrial complex I prevents AT2 to AT1 differentiation in vitro.
a–e, RNA sequencing analysis of lung epithelial cells isolated from 6-day-old mice and 35-day-old mice (P6 NDUFS2 control n = 6, P6 NDUFS2 cKO n = 6; P35 NDUFS2 control n = 8; P35 NDUFS2 cKO n = 7 mice). P35 data is from Fig. 4a,b. Heatmaps of ATF and ISR signature gene transcripts (a). b, Enrichment plot of the ISR signature genes in lung epithelial cells from P6 NDUFS2 cKO vs. P6 NDUFS2 control mice (normalized enrichment score; 3.10, false discovery rate q value <0.0001). c, Enrichment plot of the ISR signature genes in lung epithelial cells from P6 NDUFS2 cKO vs. P35 NDUFS2 cKO mice (normalized enrichment score; −2.71, false discovery rate q value <0.0001). d–e, Principal components analysis (PCA) shows transcriptomic signatures of NDUFS2 control and NDUFS2 cKO lung epithelial cells at P6 were not clearly separated. f–h, RNA sequencing analysis of 2-D cultured AT2 cells isolated from 6-day-old wild-type (WT) mice. Cells were incubated with the mitochondrial complex I inhibitor, piericidin A (500 nM) for 16 h before processed for RNA isolation. Heatmaps of expression of cell type marker genes (f), and ISR signature genes including ATF transcripts (g). Enrichment plot of the ISR signature genes (h) in 2-D cultured AT2 cells with vs. without piericidin A (normalized enrichment score; 2.92, false discovery rate q value <0.0001).
Extended Data Fig. 12
Extended Data Fig. 12. ISRIB improves limited cell growth of NDUFS2 cKO AT2 cells in 3-D organoid culture.
a–f, 3-D alveolar organoid cultures with AT2 cells isolated from 6-day-old Sftpc lineage traced (tdTomato) NDUFS2 control and NDUFS2 cKO mice (n = 6 mice (three males and three females) per genotype with technical replicates). Representative images of alveolar organoid cultures (a–b). Scale bar, 500 μm. Violin plots of organoid diameters (c–e), a proxy for alveolar organoid differentiation. The diameters of NDUFS2 cKO organoids were smaller than those of NDUFS2 control organoids, which was improved by ISRIB administration. p values by Šídák’s multiple comparisons test. Colony forming efficiency (CFE), a proxy for organoid proliferation, is shown (f). Proliferation is preserved in NDUFS2 cKO AT2 cells. Lines represent median. p = 0.9652 by Kruskal-Wallis test. g, Immunoblot analysis of OMA1 protein adjusted by COFILIN in mouse lung epithelial cell line (MLE-12). Data represents mean ± S.D. of three independent experiments. q values by two-stage linear step-up procedure of Benjamini, Krieger and Yekutieli. h–j, Immunoblot analysis of ATF4 protein adjusted by COFILIN in MLE-12. Data represents mean ± S.D. of three independent experiments. Cells were incubated with piericidin A (500 nM) or oligomycin (100 nM) for 16 h to inhibit complex I or V (positive control), respectively. q values by two-stage linear step-up procedure of Benjamini, Krieger and Yekutieli. EV, empty vector; NT, non-targeting control. All cell culture media contained aspartate and asparagine. Source Data
Extended Data Fig. 13
Extended Data Fig. 13. Loss of mitochondrial complex II in lung epithelial cells induces mild ISR, which is lower than the ISR induction due to loss of mitochondrial complex I.
a, The frequency distribution of alveolar thickness measured in hematoxylin-eosin stained lung histology of 47–49 day-old mice (n = 4 mice, two males and two females per genotype). 4–6 randomly selected fields of view from each mouse were evaluated. The x axis shows alveolar thickness bins, and the y axis shows the number of alveolar pixels that belong to the respective alveolar thickness bin normalized to the total alveolar pixel count in the image. Each animal is represented by its own color. Statistical significance for genotype was calculated based on F-test for a linear model (p = 4.65 x 10⁻³). b, RNA-seq analysis of lung epithelial cells from 35-day old mice (SDHD control n = 6; SDHD cKO n = 7; NDUFS2 control n = 8; NDUFS2 cKO n = 7 mice). Heatmap of ATF transcripts in lung epithelial cells. c, Relative abundance of succinate in lung epithelial cells isolated from 35-day old mice (NDUFS2 control n = 8; NDUFS2 control/NDI1 n = 7; NDUFS2 cKO n = 7; NDUFS2 cKO/NDI1 n = 8 mice). d, Relative abundance of succinate in lung epithelial cells isolated from 35-day old mice (NDUFS2 control n = 13; NDUFS2 control + ISRIB n = 8; NDUFS2 control + NMN n = 9; NDUFS2 cKO n = 7; NDUFS2 cKO + ISRIB n = 9; NDUFS2 cKO + NMN n = 9; WT n = 6 mice). Lines represent median. p = 0.2333 by Kruskal-Wallis test. Source Data

References

    1. Sun X, et al. A census of the lung: CellCards from LungMAP. Dev. Cell. 2022;57:112–145.e112. doi: 10.1016/j.devcel.2021.11.007. - DOI - PMC - PubMed
    1. Barkauskas CE, et al. Type 2 alveolar cells are stem cells in adult lung. J. Clin. Invest. 2013;123:3025–3036. doi: 10.1172/JCI68782. - DOI - PMC - PubMed
    1. Desai TJ, Brownfield DG, Krasnow MA. Alveolar progenitor and stem cells in lung development, renewal and cancer. Nature. 2014;507:190–194. doi: 10.1038/nature12930. - DOI - PMC - PubMed
    1. Nabhan AN, Brownfield DG, Harbury PB, Krasnow MA, Desai TJ. Single-cell Wnt signaling niches maintain stemness of alveolar type 2 cells. Science. 2018;359:1118–1123. doi: 10.1126/science.aam6603. - DOI - PMC - PubMed
    1. Zacharias WJ, et al. Regeneration of the lung alveolus by an evolutionarily conserved epithelial progenitor. Nature. 2018;555:251–255. doi: 10.1038/nature25786. - DOI - PMC - PubMed

Publication types

MeSH terms