. 2023 Sep;621(7977):120-128.
doi: 10.1038/s41586-023-06422-9. Epub 2023 Aug 9.

Dissecting human population variation in single-cell responses to SARS-CoV-2

Affiliations

Dissecting human population variation in single-cell responses to SARS-CoV-2

Yann Aquino et al. Nature. 2023 Sep.

Abstract

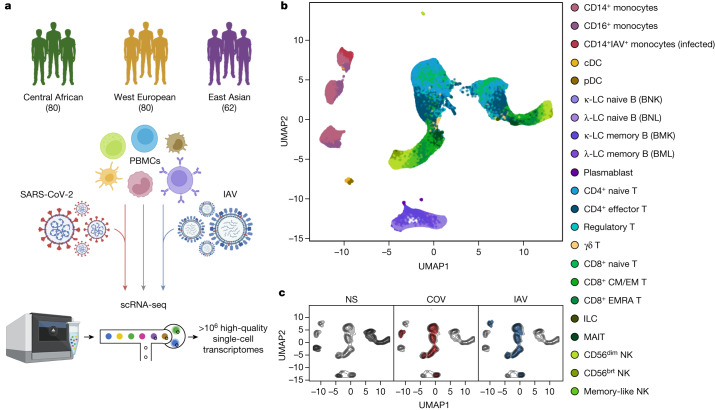
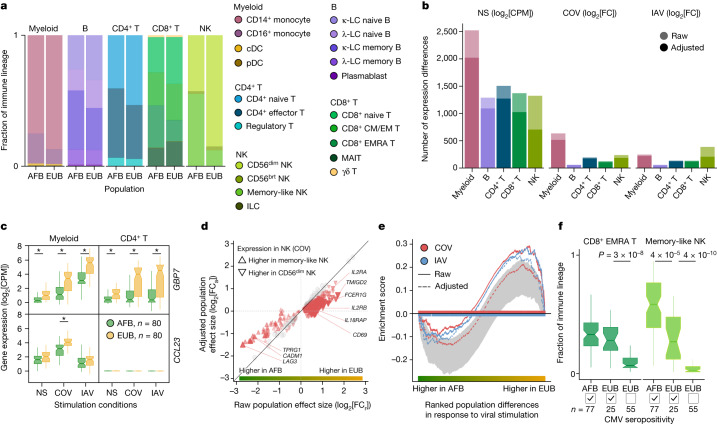
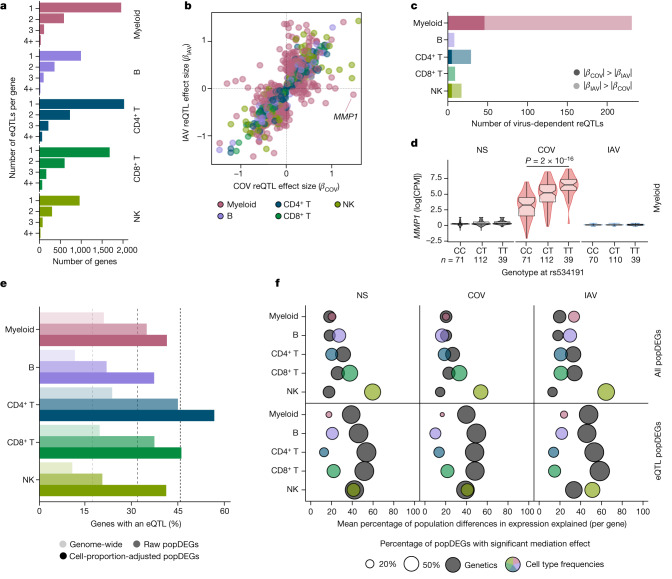
Humans display substantial interindividual clinical variability after SARS-CoV-2 infection1-3, the genetic and immunological basis of which has begun to be deciphered4. However, the extent and drivers of population differences in immune responses to SARS-CoV-2 remain unclear. Here we report single-cell RNA-sequencing data for peripheral blood mononuclear cells-from 222 healthy donors of diverse ancestries-that were stimulated with SARS-CoV-2 or influenza A virus. We show that SARS-CoV-2 induces weaker, but more heterogeneous, interferon-stimulated gene activity compared with influenza A virus, and a unique pro-inflammatory signature in myeloid cells. Transcriptional responses to viruses display marked population differences, primarily driven by changes in cell abundance including increased lymphoid differentiation associated with latent cytomegalovirus infection. Expression quantitative trait loci and mediation analyses reveal a broad effect of cell composition on population disparities in immune responses, with genetic variants exerting a strong effect on specific loci. Furthermore, we show that natural selection has increased population differences in immune responses, particularly for variants associated with SARS-CoV-2 response in East Asians, and document the cellular and molecular mechanisms by which Neanderthal introgression has altered immune functions, such as the response of myeloid cells to viruses. Finally, colocalization and transcriptome-wide association analyses reveal an overlap between the genetic basis of immune responses to SARS-CoV-2 and COVID-19 severity, providing insights into the factors contributing to current disparities in COVID-19 risk.


Conflict of interest statement

The authors declare no competing interests.

Figures

Fig. 1
Fig. 1. Population single-cell responses to SARS-CoV-2 and IAV.
a, The study design. The diagram was created using BioRender. b,c, Uniform manifold approximation and projection (UMAP) embedding of 1,047,824 PBMCs: resting (non-stimulated; NS) or stimulated with SARS-CoV-2 (COV) or IAV for 6 h. b, The colours indicate the 22 cell types inferred. c, The distribution of cells in the NS, COV and IAV conditions on UMAP coordinates. The contour plot indicates the overall density of cells, and the coloured areas delineate regions of high cell density in each condition (NS (grey), COV (red) and IAV (blue)). Source Data
Fig. 2
Fig. 2. Cellular composition affects the transcriptional responses to viral stimuli.
a, Cell type proportions within each immune lineage in Africans (AFB) and Europeans (EUB). brt, bright. b, The number of genes differentially expressed between the African and European groups in the basal state (NS) or in response to SARS-CoV-2 (COV) or IAV, in each immune lineage. Numbers are provided before and after adjustment for cellular composition. c, Examples of popDRGs, either shared across cell types and viruses (GBP7) or specific to SARS-CoV-2-stimulated myeloid cells (CCL23). Statistical analysis was performed using two-sided Student’s t-tests with adjustment using the Benjamini–Hochberg method; *P < 0.001. Exact P values are provided in Supplementary Table 4b. d, The effect of adjusting for cellular composition on genes differentially expressed between populations after exposure to SARS-CoV-2. Adjustment reduces raw population fold-changes (FCa versus FCr) in the expression of genes that are differentially expressed between memory-like NK cells and CD56dim NK cells (red triangles; genes with similar expression are shown in grey). e, The effect of adjusting for cellular composition on population differences in the response to viral stimulation for genes involved in the positive regulation of cell migration (GO:0030335) in the NK lineage. For each stimulus, gene set enrichment analysis enrichment curves are shown before and after adjusting on the basis of cellular composition. Grey shades indicate the 95% expected range for the enrichment curve when gene labels are permuted at random. f, The distribution of CD8+ EMRA T and memory-like NK cell frequencies in Africans and Europeans according to CMV+/− serostatus. P values (P < 0.01) calculated using Wilcoxon’s two-sided rank-sum tests are shown. For c and f, the centre line shows the median; the notches show the 95% confidence intervals (CIs) of the median; the box limits show the upper and lower quartiles; and the whiskers show 1.5× interquartile range. The number (n) of independent biological samples is indicated where relevant. Source Data
Fig. 3
Fig. 3. Genetic basis of immune responses to RNA viruses.
a, The number of eQTLs detected per gene within each immune lineage. b, Comparison of reQTL effect sizes (β) between SARS-CoV-2- and IAV-stimulated cells. Each dot represents a specific reQTL (that is, SNP, gene and lineage) and its colour indicates the lineage in which it was detected. c, The number of virus-dependent reQTLs (two-sided Student’s t-test nominal interaction, P < 0.01) in each immune lineage, coloured according to the lineage and the stimulus for which the reQTL has the largest effect size. d, Example of a SARS-CoV-2-specific reQTL at MMP1. P values (P < 0.01) calculated using Student’s two-sided t-tests are shown. The centre line shows the median; the notches show the 95% CIs of the median; the box limits show the upper and lower quartiles; the whiskers show 1.5× interquartile range; and the points show outliers. e, Enrichment in eQTLs among genes that are differentially expressed between populations (popDEGs). For each immune lineage, the bars indicate the percentage of genes with a significant eQTL, at the genome-wide scale and among popDEGs, before or after adjustment for cellular composition. f, For each lineage and stimulus, the x axis indicates the mean contribution of either genetics (that is, the most significant eQTL per gene in each lineage and stimulus) or cellular composition to population differences in expression, across all popDEGs (top) or popDEGs associated with an eQTL (bottom). The size of the dots reflects the percentage of genes with a significant mediated effect at an FDR of 1% (Supplementary Table 6). The number (n) of independent biological samples is indicated where relevant. Source Data
Fig. 4
Fig. 4. Natural selection effects on population differentiation of immune responses.
a, Estimated periods of selection, over the past 2,000 generations, for 245 SARS-CoV-2 reQTLs with significant signals of rapid adaptation in East Asians (CHS) (maximum |Z| > 3). Each horizontal line represents a variant, sorted in descending order of time to onset of selection. The area shaded in purple highlights the period (770–970 generations ago) associated with genetic adaptation at host coronavirus-interacting proteins in East Asians. Several immunity-related genes are highlighted. b, Allele frequency trajectories of two SARS-CoV-2 reQTLs (rs1028396 at SIRPA and rs11645448 at NOD2) in Africans (YRI, green), Europeans (CEU, yellow) and East Asians (CHS, purple). The full lines indicate the maximum a posteriori estimate of allele frequency at each epoch and shaded areas indicate the 95% CIs. The dendrograms show the estimated unrooted population phylogeny for each eQTL based on PBS (that is, the branch length between each pair of populations is proportional to −log10[1 − FST]). Source Data
Fig. 5
Fig. 5. eQTLs and reQTLs contribute to COVID-19 risk.
a, Enrichment in GWAS loci associated with COVID-19 susceptibility and severity at eQTLs and reQTLs. Data are the mean and 2.5th–97.5th percentiles (95% CIs) of fold enrichments observed over n = 10,000 resamplings. b, Colocalization of IRF1 and IFNAR2 eQTLs with COVID-19 severity loci. Top, the −log10[P] profiles (two-sided Student’s t-tests) for association with COVID-19-related hospitalization. Bottom, the −log10[P] profiles for association with expression in non-stimulated CD56dim NK cells (IRF1) and CD4+ T cells (IFNAR2). The colour code reflects the degree of LD (r2) with the consensus SNP identified by colocalization analyses (purple). For each SNP, the direction of the arrow indicates the direction of the effect. Chr., chromosome. Source Data
Fig. 6
Fig. 6. Adaptation and archaic introgression at COVID-19-associated (r)eQTLs.
ad, Features of (r)eQTLs colocalizing with COVID-19 risk loci (PPH4 > 0.8) and presenting either strong population differentiation (top 1% PBS genome-wide) or evidence of Neanderthal introgression. a, Effects of the target allele on gene expression across immune lineages and stimulation conditions. b, Clinical and functional annotations of associated genes. c, Present-day population frequencies of the target allele. d, The effects of the target allele on COVID-19 risk (infection, hospitalization and critical state), colocalization probability and the lineage and condition in which gene expression most likely affects COVID-19 risk as detected by transcriptome-wide association (TWA) analyses. For expression or COVID-19 associations, the arrows indicate increases/decreases in expression or disease risk with each copy of the target allele, and the opacity reflects the strength of association (two-sided Student’s t-test −log10[P]). For the TWA analysis, the arrows indicate the effect of an increase in gene expression on the risk of COVID-19. In a and d, the arrow colours indicate stimulation conditions (non-stimulated (grey), SARS-CoV-2-stimulated (red), IAV-stimulated (blue)) and the background colour indicates the lineage (myeloid (pink), B (purple), CD4+ T (blue), CD8+ T (green), NK (light green)). For each eQTL, the target allele is defined as (1) the derived allele for highly differentiated eQTLs or (2) the allele that segregates with the archaic haplotype for introgressed eQTLs. When the ancestral state is unknown, the minor allele is used as a proxy for the derived allele. Note that, in some cases (for example, OAS1), the introgressed allele can be present in Africa, which is attributed to the reintroduction in Eurasia of an ancient allele by Neanderthals. C, critical; H, hospitalized; R, reported.
Extended Data Fig. 1
Extended Data Fig. 1. Transcriptional responses to SARS-CoV-2 and IAV stimulation.
a, Comparison of transcriptional responses to SARS-CoV-2 and IAV across major immune lineages. Hallmark inflammatory and interferon-stimulated genes are highlighted in orange and blue, respectively. b, Distribution of ISG activity in the non-stimulated state and in response to SARS-CoV-2 (COV) and influenza A virus (IAV) across the five major immune lineages. For each lineage and set of stimulation conditions, the violins and boxplots show the distribution of ISG activity scores across all n = 222 independent biological samples (middle line: median; box limits: upper and lower quartiles; whiskers: 1.5× interquartile range; points: outliers). *: Wilcoxon’s two-sided signed-rank p-value < 2.2 × 10−16.
Extended Data Fig. 2
Extended Data Fig. 2. Drivers of population variation in expression of interferon-stimulated genes.
a, Proportion of the variance of ISG activity explained by IFN-α, IFN-β and IFN-γ in the non-stimulated condition and in response to SARS-CoV-2 and IAV, across the five major immune lineages. b, Correlation between levels of IFN-α in the supernatants (measured by SIMOA) and ISG activity in myeloid and CD4+ T cells, adjusted for cellular mortality. Each dot represents a sample (donor × condition) and is coloured according to its stimulation condition (grey: NS, red: COV and blue: IAV). For each lineage and set of stimulation conditions, lines show the expected ISG activity in each sample given the concentration of IFN-α; shaded error bands show the 95% CI (mean ± 2 SEM) around this estimate. c, Relative expression of IFN-α-encoding transcripts by each immune cell type in response to SARS-CoV-2 and IAV. Bar lengths indicate the mean number of IFN-α transcripts contributed by each cell type to the overall pool (cell type frequency × mean number of IFN-α transcripts per cell). Dot area is proportional to the mean level of IFN-α transcripts in each cell type (counts per million). No value is reported in the SARS-CoV-2 condition for infected monocytes as this cell population is specific to the IAV condition. d, Correlation of ISG activity scores between SARS-CoV-2 and IAV-stimulated samples. Each dot corresponds to a single individual (n = 222) and its colour indicates the self-reported ancestries of the individual concerned (AFB: Central African; EUB: West European; ASH: East Asian). Shaded error band shows the 95% confidence interval (mean ± 2 SEM) of the expected ISG activity in COV-stimulated sample, given ISG activity in IAV-stimulated samples. Samples with a cellular viability below the 10th percentile are indicated by smaller dots.
Extended Data Fig. 3
Extended Data Fig. 3. Population differences in cellular composition and transcriptional responses to viral stimulation.
a, Validation of the memory-like NK fraction. Flow cytometry data for representative CMV+ and CMV donors, highlighting the higher percentage of memory-like NK cells (NKG2C+, NKG2A, CD57+) among CMV+ donors than among CMV donors. b, Population variation in the percentage of CD16+ monocytes, memory lymphocyte subsets and memory-like NK cells. For each major immune lineage, the cell type differing most strongly in frequency between AFB (n = 80) and EUB (n = 80) donors is shown. Boxplots show the distribution of the percentage of the target cell type in the corresponding lineage in each population (middle line: median; box limits: upper and lower quartiles; whiskers: 1.5× interquartile range). Wilcoxon’s two-sided rank-sum p-values are shown. c, Effect of adjusting for cellular composition on the absolute differences in expression between AFB and EUB donors, as a function of absolute differences in expression between the two cell types differing most in frequency between these populations (Supplementary Table 4b). For each gene, lineage and condition, the effect of adjustment is measured by the difference between raw (log2FCr) and adjusted (log2FCa) log2fold-changes. For each lineage and stimulation condition, lines show the expected change in the magnitude of population gene expression differences after adjusting for cellular composition, conditional on absolute differences in expression between the two cell types that differ most in frequency between these populations; shaded error bands show the 95% CI (mean ± 2 SEM) around this estimate. d, Serology assays for CMV across donors according to ancestries. Each dot represents a donor and is coloured according to ancestries (AFB: Central Africans, EUB: West Europeans). The grey line represents the detection threshold used to identify a donor as seropositive.
Extended Data Fig. 4
Extended Data Fig. 4. Mapping of expression quantitative trait loci at cell-type resolution.
a, Overlap of eQTLs and eGenes (i.e., genes with an eQTL) detected during the mapping of eQTLs at the immune lineage and cell type levels. b, Total number of eQTLs detected in each of the 22 different cell types. Coloured bars indicate the number of genome-wide significant eQTLs in each cell type, white stripes (bottom) indicate cell type-specific eQTLs (two-sided Student’s t-test Benjamini-Hochberg-adjusted p-value <0.01; nominal p-value >0.01 in all other cell types), and black stripes (top) indicate the total number of eQTLs detected in each cell type including eQTLs from other cell types replicated at a p-value < 0.01. c, Example of a pDC-specific eQTL for MIR155HG. MIR155HG expression levels in pDCs and CD14+ monocytes according to rs114273142 genotype in non-stimulated (NS), SARS-CoV-2-stimulated (COV) and influenza A virus-stimulated (IAV) conditions (middle line: median; box limits: upper and lower quartiles; whiskers: 1.5× interquartile range; points: outliers). The number n of independent biological samples is indicated where relevant. d, Correlation of eQTL (NS; lower triangle) and reQTL (response to SARS-CoV-2; upper triangle) effect sizes across cell types. For each pair of cell types, Spearman’s correlation coefficient was calculated for the effect sizes (β) of eQTLs that are significant at a nominal two-sided Student’s t-test p-value < 0.01 in each cell type.
Extended Data Fig. 5
Extended Data Fig. 5. Contribution of genetics to population differences in response to RNA viruses.
a, Enrichment in reQTLs among popDRGs. For each lineage, bars indicate the percentage of genes with a significant reQTL, both genome-wide and among the popDRGs identified, before or after adjustment for cell composition (referred to as “adjusted” and “raw” respectively). b, Percentage of popDEGs with an eQTL according to the magnitude of differences in expression. In each lineage, popDEGs are assigned to one of five magnitude groups based on quintiles of log2fold-change between the AFB and EUB populations. For each lineage and magnitude group, the number of popDEGs with an eQTL and the total number of popDEGs are reported. c, Relationship between eQTL effect sizes and population differences in expression (popDEGs only). d, Relationship between reQTL effect sizes and population differences in response to immune stimulation (popDRGs only). For each stimulation condition, the regression line is computed jointly across all lineages. c and d, Lines show expected (r)eQTL effect sizes conditional on the magnitude of population differences in gene expression or in response to viral stimulation; shaded error bands show the 95% CI (mean ± 2 SEM) around this estimate. e, Contribution of genetics and cell composition to population differences in response to stimulation by COV and IAV. For each lineage and stimulation condition, the x-axis indicates the mean percentage of population differences in response to stimulation mediated by either genetics or cell composition, across all popDRGs (upper panels) or the set of popDRGs with a significant reQTL (lower panels). The size of the dots reflects the percentage of genes with a significant mediated effect (FDR<1%). The statistical significance of mediated effects for each gene is reported in Supplementary Table 6.
Extended Data Fig. 6
Extended Data Fig. 6. Positive selection signals across cell types and populations.
a, Fold-enrichments (FE) of eQTLs in local adaptation signals across the 22 cell types. Adaptive loci are defined separately in Central Africans (YRI), West Europeans (CEU) and East Asians (CHS), based on the population branch statistic (top 1% PBS). Occurrence of adaptive signals at reQTLs is compared to randomly selected variants, matched for MAF, distance to nearest gene, and LD score. b, Allele frequency trajectories over the past 2,000 generations in YRI (green) and CEU (yellow) of the GBP7 reQTL (rs1142888-G). Lines indicate the maximum a posteriori estimate of allele frequency at each epoch in each population; shaded areas indicate the 95% CIs around these estimates (2.5th −97.5th percentiles of posterior distribution). c, Fold-enrichments (FE) of eQTLs and reQTLs in local adaptation signals (top 1% PBS), for eQTLs and reQTLs relative to random variants, matched for MAF, distance to nearest gene, and LD score. reQTLs are analysed either for each stimulus separately (reQTL) or splitting into stimulus-specific and shared reQTLs (reQTL breakdown). a and c. Data are presented as the mean and 2.5th −97.5th percentiles (95% CIs) of FE observed over N = 10,000 resamplings.
Extended Data Fig. 7
Extended Data Fig. 7. Onset of positive selection events at SARS-CoV-2 reQTLs.
a and b, Estimated period of selection over the past 2,000 generations, for 148 and 279 SARS-CoV-2 reQTLs with significant evidence of natural selection in Central Africans and West Europeans, respectively (max. |Z-score| > 3). In both panels, variants presenting strong signals of positive selection (i.e., top 5% for PBS) are shown in colour. The transparent rectangle highlights the period between 770 and 970 generations ago (i.e., 21.5-27.2 thousand years ago) associated with genetic adaptation targeting host coronavirus-interacting proteins in East Asians. Variants are ordered along the x-axis in descending order of time to onset of natural selection. c, Percentage of SARS-CoV-2-specific reQTLs presenting selection signals in different populations, between 770 and 970 generations ago. Data are presented as the median and 2.5th −97.5th percentiles (95% CIs) of percentages observed over N = 1,000 resamplings. d and e, Examples of SARS-CoV-2-induced reQTLs at LILRB1 (rs4806787) in plasmacytoid dendritic cells (pDCs) and SIRPA (rs1028396) in CD14+ monocytes. Student’s two-sided t-test p-values < 0.01 are shown; middle line: median; notches: 95% CIs of median, box limits: upper and lower quartiles; whiskers: 1.5× interquartile range; points: outliers. The number n of independent biological samples is indicated where relevant.
Extended Data Fig. 8
Extended Data Fig. 8. Adaptive introgression at regulatory loci.
a, Enrichment of eQTLs and reQTLs in introgressed haplotypes (mean and 2.5th −97.5th percentiles of observed/expected ratios across N = 10,000 resamplings). b, For each population and condition, the frequencies of introgressed haplotypes are compared according to their effects on gene expression (eQTL vs. non-eQTL; Benjamini-Hochberg-adjusted two-sided Wilcoxon’s rank-sum p-values < 0.01 are shown). The numbers of independent SNPs and eQTLs considered, n and neQTL respectively, are indicated. Middle line: median; notches: 95% CIs of median, box limits: upper and lower quartiles; whiskers: 1.5× interquartile range; points: outliers. Benjamini-Hochberg -adjusted two-sided Student’s t-test p-values < 0.01 are shown. For a and b, each population was downsampled to the same number of donors prior to eQTL mapping to avoid biases due to differences in statistical power. c, Adaptively introgressed eQTLs of host defence genes. From left to right: (i) effects of the introgressed allele on gene expression across immune lineages and stimulation conditions, (ii) clinical and functional annotations of associated genes, (iii) present-day population frequencies of the introgressed alleles, (iv) percentile of archaic allele frequency at the locus (CEU and CHS; dark shades: top 1%, light shades: top 5%), and (v) effects of the target allele on COVID-19 risk (infection, hospitalization, and critical state). Arrows indicate the increase/decrease in gene expression or disease risk with each copy of the introgressed allele. Opacity increases with significance (two-sided Student’s t-test -log10 p-value). In the leftmost panel, arrow colours indicate the stimulation condition (grey: NS, red: COV, blue: IAV). For each eQTL, the introgressed allele is defined as the allele segregating with the archaic haplotype in Eurasians.
Extended Data Fig. 9
Extended Data Fig. 9. Cell type-dependent effects on gene expression of Neanderthal introgression.
a, Effects on gene expression of two loci (OAS1 and TLR1) presenting strong evidence of adaptive introgression. For each locus, estimated eQTL effect size and 95% CIs estimated in 222 unrelated donors are shown across 22 cell types and stimulation conditions. b-f, Examples of adaptive introgression at three introgressed loci (UBE2F, TRAF3IP3 and TNFSF13B). b, Upper panel: frequency and origin of archaic alleles at the UBE2F locus. Each dot represents an archaic allele, and its colour indicates whether it was unique to the Vindija Neanderthal genome (orange), shared between the Vindija Neanderthal and Denisova genomes (light yellow), or specific to Denisova (green). The reQTL index SNP is shown in red (rs58964929). The y-axis indicates allele frequency in West Europeans (CEU, yellow) and East Asians (CHS, purple). Middle panel: monocyte eQTL p-values (two-sided Student’s t-test), colour-coded according to stimulation conditions (grey: non-stimulated (NS), red: SARS-CoV-2-stimulated (COV), blue: IAV-stimulated (IAV)). Each dot represents a SNP. Dot area is proportional to the LD (r2) values between the SNP and nearby archaic alleles. For archaic alleles, arrows indicate direction of allele effect on gene expression. Lower panel: Genes at locus, with UBE2F highlighted in red. c, and e, same as b (upper panel) for TRAF3IP3 and TNFSF13B. d, The Neanderthal-introgressed eQTL at TRAF3IP3 is apparent only in IAV-infected monocytes and not detected in bystander cells (stimulated but not infected). f, Effects of the introgressed eQTL at TNFSF13B in MAIT cells (i.e., the cell type with the largest effect size). For b, d and f, middle line: median; box limits: upper and lower quartiles; whiskers: 1.5× interquartile range; points: outliers. Benjamini-Hochberg-adjusted two-sided Student’s t-test p-values < 0.01 are shown, and the number n of independent biological samples is indicated where relevant.
Extended Data Fig. 10
Extended Data Fig. 10. Colocalization of eQTLs and reQTLs with COVID-19-associated loci.
a, Enrichment in COVID-19-associated loci at eQTLs and reQTLs in each major lineage. Data are presented as the mean and 2.5th −97.5th percentiles (95% CIs) of fold-enrichments observed over N = 10,000 resamplings. b and c, Colocalization of eQTLs with COVID-19 GWAS hits at the OAS1-3 locus. For each eQTL, the upper panel shows the two-sided Student’s t-test −log10 (p-value) profile for association with COVID-19 phenotypes and the lower panel represents the profile of −log10 (p-values) for association with expression in a representative cell type. Arrows indicate the direction of the effect at each SNP. The colour code reflects LD (r2) with the consensus SNP, shown in purple, identified by colocalization analysis. d, Allele frequency trajectories over the last 2,000 generations in the three populations of two DR1 eQTLs (rs569414 and rs1559828) that colocalize with COVID-19 severity loci (alleles rs569414-A and rs1559828-A are associated with decreased COVID-19 severity). Full lines indicate the maximum a posteriori estimate of allele frequency at each epoch in each population; shaded areas indicate the 95% CIs around these estimates (2.5th−97.5th percentile of the posterior distribution).

References

    1. O’Driscoll M, et al. Age-specific mortality and immunity patterns of SARS-CoV-2. Nature. 2021;590:140–145. doi: 10.1038/s41586-020-2918-0. - DOI - PubMed
    1. Pei S, Yamana TK, Kandula S, Galanti M, Shaman J. Burden and characteristics of COVID-19 in the United States during 2020. Nature. 2021;598:338–341. doi: 10.1038/s41586-021-03914-4. - DOI - PubMed
    1. Sah P, et al. Asymptomatic SARS-CoV-2 infection: a systematic review and meta-analysis. Proc. Natl Acad. Sci. USA. 2021;118:e2109229118. doi: 10.1073/pnas.2109229118. - DOI - PMC - PubMed
    1. Casanova JL, Abel L. From rare disorders of immunity to common determinants of infection: following the mechanistic thread. Cell. 2022;185:3086–3103. doi: 10.1016/j.cell.2022.07.004. - DOI - PMC - PubMed
    1. Takahashi T, et al. Sex differences in immune responses that underlie COVID-19 disease outcomes. Nature. 2020;588:315–320. doi: 10.1038/s41586-020-2700-3. - DOI - PMC - PubMed

Publication types

MeSH terms