

Comparing Left Atrial Low Voltage Areas in Sinus Rhythm and Atrial Fibrillation Using Novel Automated Voltage Analysis: A Pilot Study
- PMID: 37559712
- PMCID: PMC10409550
- DOI: 10.14740/cr1503
Comparing Left Atrial Low Voltage Areas in Sinus Rhythm and Atrial Fibrillation Using Novel Automated Voltage Analysis: A Pilot Study
Abstract
Background: Low voltage areas (LVAs) have been proposed as surrogate markers for left atrial (LA) scar. Correlation between voltages in sinus rhythm (SR) and atrial fibrillation (AF) have previously been measured via point-by-point analysis. We sought to compare LA voltage composition measured in SR to AF, utilizing a high-density automated voltage histogram analysis (VHA) tool in those undergoing pulmonary vein isolation (PVI) for persistent AF (PeAF).
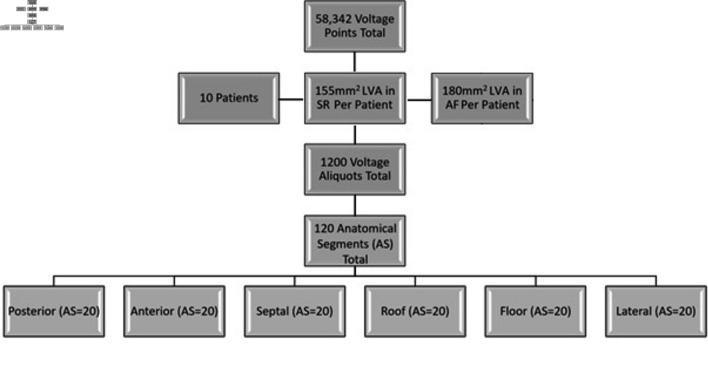
Methods: We retrospectively analyzed patients with PeAF undergoing de novo PVI. Maps required ≥ 1,000 voltage points in each rhythm and had a standardized procedure (mapped in AF then remapped in SR post-PVI). We created six anatomical segments (AS) from each map: anterior, posterior, roof, floor, septal and lateral AS. These were analyzed by VHA, categorizing atrial LVAs into 10 voltage aliquots 0 - 0.5 mV. Data were analyzed using SPSS v.26.
Results: We acquired 58,342 voltage points (n = 10 patients, mean age: 67 ± 13 years, three females). LVA burdens of ≤ 0.2 mV, designated as "severe LVAs", were comparable between most AS (except on the posterior wall) with good correlation. Mapped voltages between the ranges of 0.21 and 0.5 mV were labeled as "diseased LA tissue", and these were found significantly more in AF than SR. Significant differences were seen on the roof, anterior, posterior, and lateral AS.
Conclusions: Diseased LA tissue (0.21 - 0.5 mV) burden is significantly higher in AF than SR, mainly in the anterior, roof, lateral, and posterior wall. LA "severe LVA" (≤ 0.2 mV) burden is comparable in both rhythms, except with respect to the posterior wall. Our findings suggest that mapping rhythm has less effect on the LA with voltages < 0.2 mV than 0.2 - 0.5 mV across all anatomical regions, excluding the posterior wall.
Keywords: Left atrial low voltage area burden; Persistent atrial fibrillation; Radiofrequency ablation; Voltage histogram analysis.
Copyright 2023, Mannion et al.
Conflict of interest statement
No conflict of interest to report.
Figures


References
-
- Badger TJ, Daccarett M, Akoum NW, Adjei-Poku YA, Burgon NS, Haslam TS, Kalvaitis S. et al. Evaluation of left atrial lesions after initial and repeat atrial fibrillation ablation: lessons learned from delayed-enhancement MRI in repeat ablation procedures. Circ Arrhythm Electrophysiol. 2010;3(3):249–259. doi: 10.1161/CIRCEP.109.868356. - DOI - PMC - PubMed
-
- Caixal G, Alarcon F, Althoff TF, Nunez-Garcia M, Benito EM, Borras R, Perea RJ. et al. Accuracy of left atrial fibrosis detection with cardiac magnetic resonance: correlation of late gadolinium enhancement with endocardial voltage and conduction velocity. Europace. 2021;23(3):380–388. doi: 10.1093/europace/euaa313. - DOI - PubMed
-
- Vlachos K, Efremidis M, Letsas KP, Bazoukis G, Martin R, Kalafateli M, Lioni L. et al. Low-voltage areas detected by high-density electroanatomical mapping predict recurrence after ablation for paroxysmal atrial fibrillation. J Cardiovasc Electrophysiol. 2017;28(12):1393–1402. doi: 10.1111/jce.13321. - DOI - PubMed
LinkOut - more resources
Full Text Sources
Research Materials