. 2023 Jul 25:14:1107397.
doi: 10.3389/fimmu.2023.1107397. eCollection 2023.

Identification of the novel FOXP3-dependent Treg cell transcription factor MEOX1 by high-dimensional analysis of human CD4+ T cells

Affiliations

Identification of the novel FOXP3-dependent Treg cell transcription factor MEOX1 by high-dimensional analysis of human CD4+ T cells

Kevin Baßler et al. Front Immunol. .

Abstract

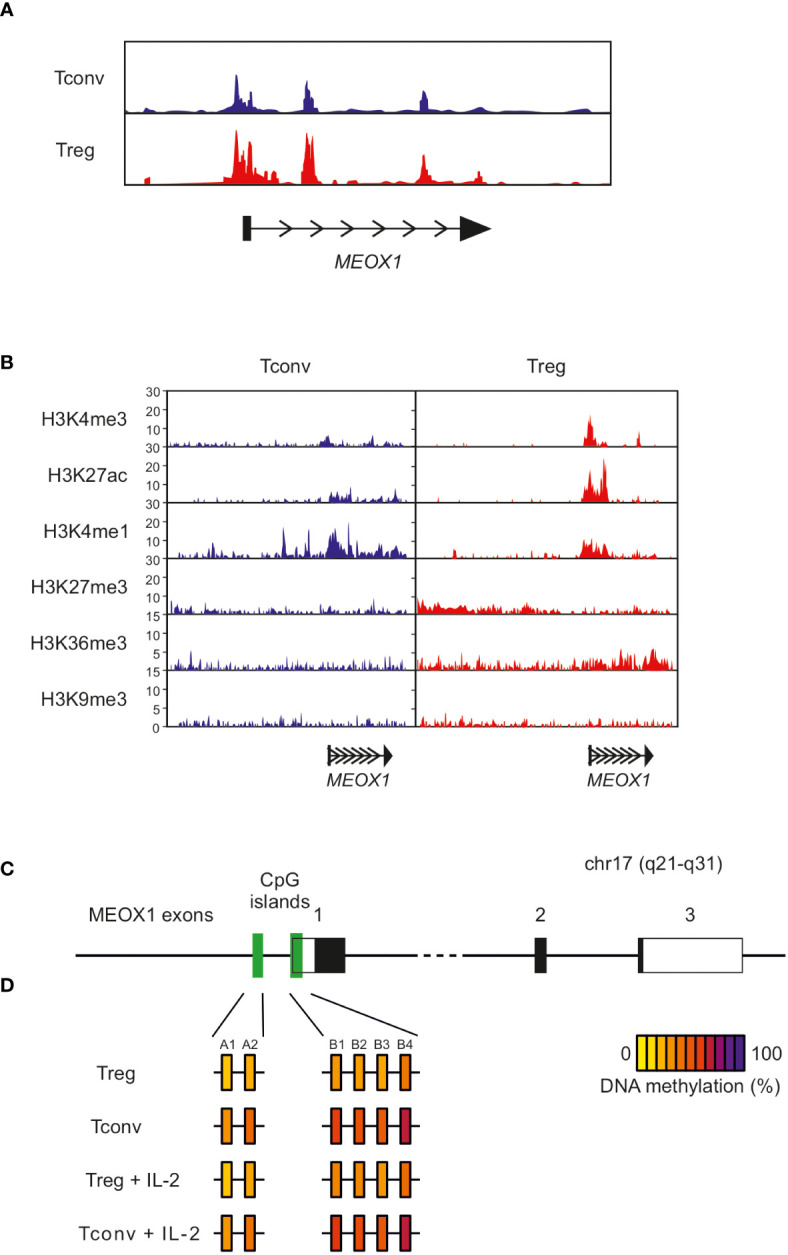
CD4+ T cells play a central role in the adaptive immune response through their capacity to activate, support and control other immune cells. Although these cells have become the focus of intense research, a comprehensive understanding of the underlying regulatory networks that orchestrate CD4+ T cell function and activation is still incomplete. Here, we analyzed a large transcriptomic dataset consisting of 48 different human CD4+ T cell conditions. By performing reverse network engineering, we identified six common denominators of CD4+ T cell functionality (CREB1, E2F3, AHR, STAT1, NFAT5 and NFATC3). Moreover, we also analyzed condition-specific genes which led us to the identification of the transcription factor MEOX1 in Treg cells. Expression of MEOX1 was comparable to FOXP3 in Treg cells and can be upregulated by IL-2. Epigenetic analyses revealed a permissive epigenetic landscape for MEOX1 solely in Treg cells. Knockdown of MEOX1 in Treg cells revealed a profound impact on downstream gene expression programs and Treg cell suppressive capacity. These findings in the context of CD4+ T cells contribute to a better understanding of the transcriptional networks and biological mechanisms controlling CD4+ T cell functionality, which opens new avenues for future therapeutic strategies.

Keywords: Foxp3; MEOX1; Treg cells; human CD4; regulatory T cells.


Conflict of interest statement

The authors declare that the research was conducted in the absence of any commercial or financial relationships that could be construed as a potential conflict of interest.

Figures

Figure 1
Figure 1
Data dimensionality reduction reveals transcriptional relationships between different CD4+ T cell samples (A) Visualization of the dataset by depicting the first (PC1) and the second principal components (PC2) of the computed PCA annotated with all 48 conditions. (B) Z-score normalized matrix of hierarchically clustered Pearson’s correlation coefficients between CD4+ T cell conditions. Conditions were annotated according to Table S1 . Clusters of transcriptional similar CD4+ T cell conditions were annotated according to the predominant stimulation among the conditions. (C) PCA annotated according to the predominant stimulation among the conditions. (D) Visualization of the dataset using t-SNE. (E) Visualization of k-means clusters combined with hierarchical clustering. As input to k-means clustering served expression differences (fold changes with resting Tconv cells as reference), which were calculated for the most variable genes within the dataset. Z-score normalized fold changes are indicated by the coloring (blue to red). Conditions were annotated according to Table S1 .
Figure 2
Figure 2
Reverse network engineering to infer common CD4+ T cell genes. (A) Visualization of the consensus network obtained by the combination of five different RNE-methods. TFs found among the top 20% hub genes were highlighted (common/regular TFs in red; ZNF-TFs in blue). Node size reflects degree of connectivity. (B) Top 23 highest interconnected common TFs were ranked according to Gene Prioritization (GP) among the top 20% hubs. Mean expression (log2) from each cluster is displayed as a heatmap. Degree refers to degree of connectivity. (C) Subnetworks of the six highest expressed TFs from the top 11 GP-ranked hubs. Direct targets (predicted by iRegulon) surround corresponding TFs. Node size reflects degree of connectivity.
Figure 3
Figure 3
Identification of genes associated with the identified CCM clusters (A) UpSet plot of calculated DE genes across the CCM clusters. DE genes found in the same clusters are binned and the size of the bins is represented as a bar chart. At the bottom, dots indicate which CCM clusters contained and shared these DE genes. Only bins with >2 DEgenes are depicted. (B) SOM-clustering using the most variable genes within the dataset as input. Correlation of SOM-cluster genes to CCM-defined clusters are indicated by z-scaled color coding; blue indicates low correlation and red indicates high correlation. SOM clusters specific for either Treg cells or activated CD4+ T cells are marked with a black frame; exemplary genes within these clusters are displayed. (C) WGCNA heatmap showing the correlation of the module eigengene (first principal component; ME) to the traits (CCM clusters). Blue means negative correlation and red means positive correlation. (D) Volcano plots of normalized enrichment scores (NES) and enrichment p-values based on GSEA using WGCNA modules defined in (C). Shown are data for the clusters ‘Tconv cell act. 20h’, ‘Tconv cell TGF-β’, ‘Treg cell CD3/IL-2’ and ‘Treg cell resting’. Red circles show significantly enriched gene sets; blue circles show significantly depleted gene sets. Gene sets which exhibited the highest correlation to a certain cluster in WGCNA are indicated by red font. (E) Volcano plots genes within the two WGCNA modules with the highest correlation to the CCM cluster ‘Tconv cell act. 20h’ and ‘Treg cell CD3/IL-2’. Depicted are the logarithmic gene ratios (‘Tconv cell act. 20h’ or ‘Treg cell CD3/IL-2’ versus ‘Tconv cell resting’) and logarithmic p-values obtained by t-test. Red circles show upregulated genes (FC >2; p-value <0.05); blue circles show downregulated genes (FC <-2; p-value <0.05). On the right side of each plot, all module genes are shown; on the left side, transcriptional regulators (TRs) among the respective module genes are shown. Genes of interest are highlighted. (F) Microarray expression values of FOXP3 and MEOX1 across the CD4+ T cell conditions within the dataset. Conditions are colored according to the identified CCM clusters and annotated according to Table S1 . Dashed lines indicate the computed background value of the microarray dataset.
Figure 4
Figure 4
Assessment of Treg cell specific expression of MEOX1 (A) Expression of MEOX1 in activated Treg cells and Tconv cells over a time period of 360 min (n=2; dataset: GSE11929). (B) MEOX1 gene expression in different immune cells assessed by qRT-PCR and normalized to B2M (n=3). *p < 0.05 (paired Student’s t-test), ** p < 0.01 (paired Student’s t-test). (C) MEOX1 gene expression in different immune cells according to the NextBio database. (D) Application of Markov Clustering Algorithm ‘MCL’ to the consensus network generated in Figure 2 . Visualized is a subnetwork consisting of only three genes (FOXP3, HPGD, and MEOX1). (E) Analysis of MEOX1 protein expression in either unstimulated Treg cells or in Treg cells stimulated with 100 U/ml IL-2 overnight by immunoblotting. (F) MFI (left) and exemplary histogram (right) of MEOX1 expression in human Treg cells and naïve Tconv cells. PBMCs were isolated from buffy coats and stimulated overnight with 100 U/ml IL-2 (n=3 of different donors). Treg cells (red) were gated on size, singlets, live, CD4+, CD3+, FOXP3+ (Clone 206D), CD45RA- and Tconv cells (blue) were gated on size, singlets, live, CD4+, CD3+, FOXP3- (Clone 206D), CD45RA+. Secondary antibody controls are depicted in light (Treg cells) and dark grey (Tconv cells). *p < 0.05 (paired Student’s t-test). (G) MEOX1 gene expression in Treg cells (red), Treg cells stimulated with IL-2 (light ref), Treg cells incubated with supernatant from stimulated Tconv cells (rose) and Treg cells incubated with supernatant from stimulated Tconv cells in combination with anti-CD25 and anti-IL-2 antibodies (grey) assessed by qRT-PCR and normalized to B2M. Data is from one representative experiment of three (mean and s.e.m.) with cells derived from different donors. *p < 0.05 (two-way ANOVA).
Figure 5
Figure 5
MEOX1 expression in single-cell RNA-seq data comprising different T cell populations (A) Visualization of single-cell RNA-seq data (GSE99254) in a t-SNE plot. Cells are colored according to the cell labels obtained by Guo et al. (28). Accumulation of cells with the same label are highlighted with colored background. (B) Contour plots showing the areas in the t-SNE plot of T cell clusters from GSE99254 with highest expression of FOXP3 and MEOX1. Accumulations of cells with the same cell label according to (A) are indicated by gray circles. (C) Pearson’s correlation between MEOX1 and all other genes across the CD4+ T cells in the single-cell RNA-seq dataset. Genes are grouped according to their respective correlation values. Genes found in the ‘Treg cell CD3/IL-2’-associated WGCNA modules ‘26’ and ‘32’ (according to Figures 3B–D ) are highlighted in light red and their accumulation in the ordered genes is indicated by the histogram at the bottom. A magnification of the 25 genes with the highest expression correlation to MEOX1 is additionally shown in the box at the top.
Figure 6
Figure 6
Epigenetic state of the MEOX1 gene locus in CD4+ Tconv and Treg cells (A) Open chromatin assessment of the MEOX1 locus in Treg and Tconv cells using ATAC-seq data. (B) ChIP-seq data of histone modifications at the human genomic MEOX1 locus in Treg and Tconv cells (data obtained from the NIH Roadmap Epigenomics Mapping Consortium). Data on epigenetic regulation of the MEOX1 locus were extracted from a publicly available dataset on genome-wide histone modifications in human Tconv and Treg cells (46). ChIP sequencing analysis of Tconv and Treg cells for the genomic MEOX1 locus with antibodies specific for the permissive histone modifications H3K4me3 and H3K27Ac, the transcription-associated mark H3K36me1, the enhancer-associated mark H3K4me1, and the repressive histone modifications H3K27me3 and H3K9me3. (C, D) Methylation of individual CpG motifs within two CpG-rich regions in upstream region of the genomic MEOX1 coding sequence for freshly isolated Tconv and Treg cell as well as Tconv and Treg cells stimulated overnight with 100 U/ml IL-2. Each box represents an individual CpG motif after normalization and quantification of methylation signals from pyrosequencing data by calculating ratios of T and C signals at CpG sites. The methylation status of individual CpG motifs is color coded according to the degree of methylation at that site. The color code ranges from yellow (0% methylation) to violet (100% methylation) according to the color scale on the right.
Figure 7
Figure 7
FOXP3 as upstream regulator of MEOX1 expression. (A) Module genes correlated with ‘Treg cell CD3/IL-2’ which exhibit a FOXP3 binding-motif in their promoter region. Genes were colored according to their respective fold change (reference: ‘Tconv cell resting’). (B) FOXP3 ChIP tiling array data from human expanded cord-blood Treg cells. Data were analyzed with MAT and overlayed to the MEOX1 locus to identify binding regions (p < 10-5 and FDR < 0.5%). Data are representative of two independent experiments with cells derived from different donors. (C) Overlay of MeDip-seq (66) and FOXP3 ChIP-seq data (SRA : SRP006674) for the human genomic MEOX1 locus. FOXP3 binding as well as DNA methylation is depicted for Treg (red) and Tconv cells (blue). (D) mRNA expression of FOXP3 and MEOX1 in Treg cells treated with scrambled (scrmbld, left) or FOXP3 specific (right) siRNA (E) mRNA expression of FOXP3 and MEOX1 in Treg cells treated with scrambled (left) or MEOX1 specific (right) siRNA (F) mRNA expression of RPS27L in Treg cells treated with scrambled, MEOX1 or FOXP3 specific siRNA. (D–F) Data were first normalized to B2M expression and shown in relation to donor-specific scrambled mRNA expression. (D,E) *p < 0.05 (Student’s t-test). (F) *p < 0.05 (two-way ANOVA). (D–F) Data are representative of three to five independent experiments (mean ± s.e.m.), each with cells derived from a different donor. (G, H) Suppression of allogeneic CD4+CD25- Tconv cells labelled with the cytosolic dye CFSE by human Treg cells transfected with siRNA targeting MEOX1 (MEOX1) or non-targeting siRNA (scrmbld) presented as CFSE dilution in responding Tconv cells cultured with CD3/CD28/anti-MHC-I antibody-coated beads and Treg cells at a ratio of 1:1 (G), and as relative suppression (H). Data is from one representative experiment of three with cells derived from different donors. *p < 0.05 (paired Student’s t-test). n.s. = not significant.

References

    1. Dong C. Cytokine regulation and function in T cells. Annu Rev Immunol (2021) 39:51–76. doi: 10.1146/annurev-immunol-061020-053702 - DOI - PubMed
    1. Ruterbusch M, Pruner KB, Shehata L, Pepper M. In vivo CD4(+) T cell differentiation and function: revisiting the Th1/Th2 paradigm. Annu Rev Immunol (2020) 38:705–25. doi: 10.1146/annurev-immunol-103019-085803 - DOI - PubMed
    1. Stockinger B, Omenetti S. The dichotomous nature of T helper 17 cells. Nat Rev Immunol (2017) 17:535–44. doi: 10.1038/nri.2017.50 - DOI - PubMed
    1. Vignali DAA, Collison LW, Workman CJ. How regulatory T cells work. Nat Rev Immunol (2008) 8:523–32. doi: 10.1038/nri2343 - DOI - PMC - PubMed
    1. Josefowicz SZ, Lu LF, Rudensky AY. Regulatory T cells: mechanisms of differentiation and function. Annu Rev Immunol (2012) 30:531–64. doi: 10.1146/annurev.immunol.25.022106.141623 - DOI - PMC - PubMed

Publication types

MeSH terms