. 2023 Jul 13;26(8):107368.
doi: 10.1016/j.isci.2023.107368. eCollection 2023 Aug 18.

Genetic ablation of ketohexokinase C isoform impairs pancreatic cancer development

Affiliations

Genetic ablation of ketohexokinase C isoform impairs pancreatic cancer development

Ilaria Guccini et al. iScience. .

Abstract

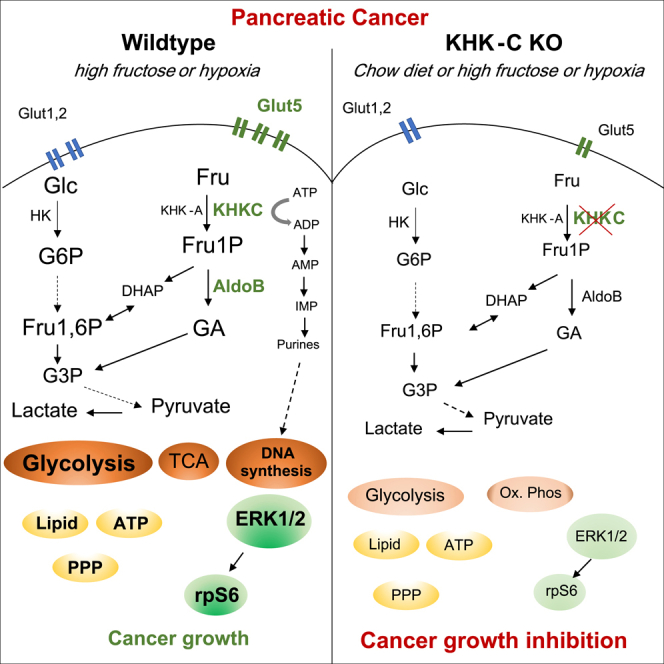
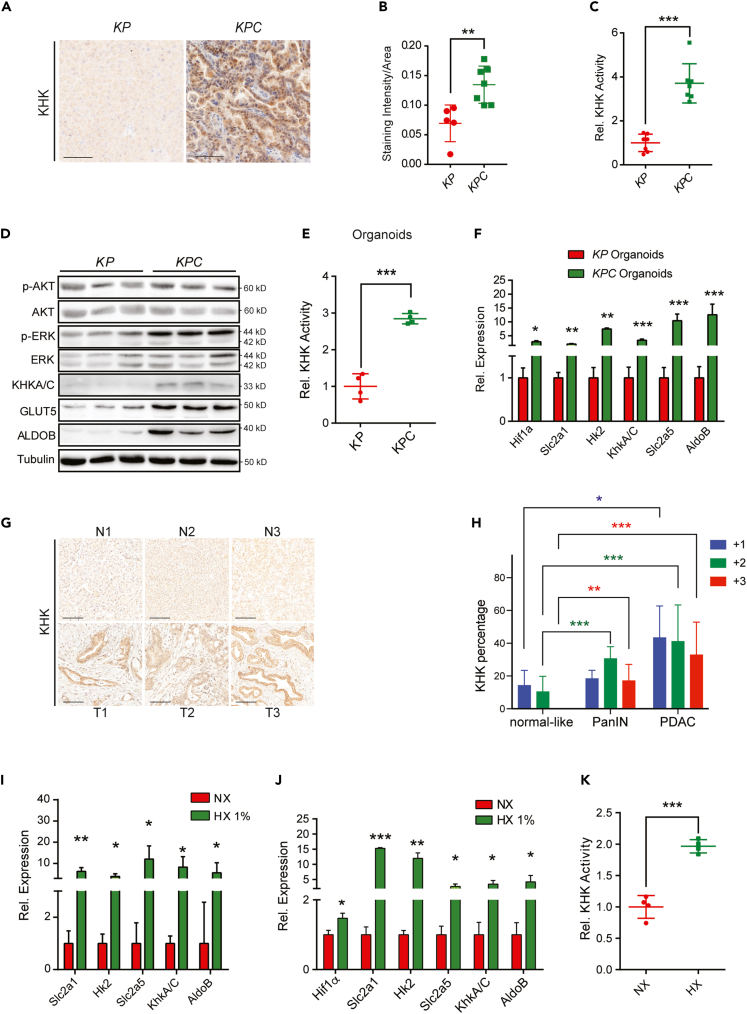
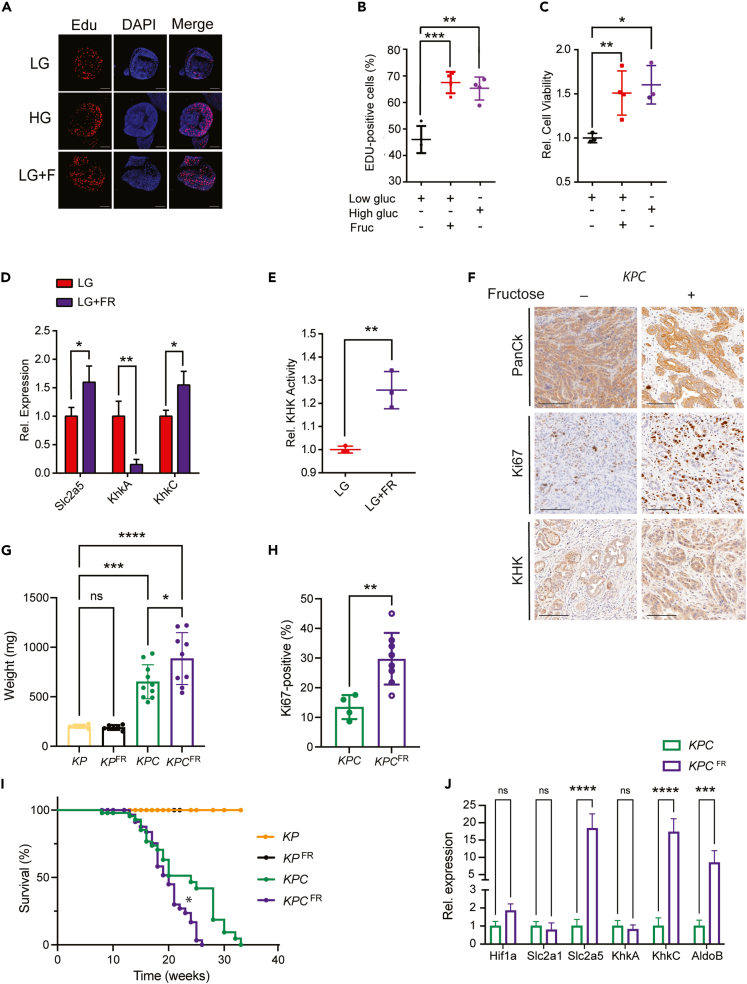
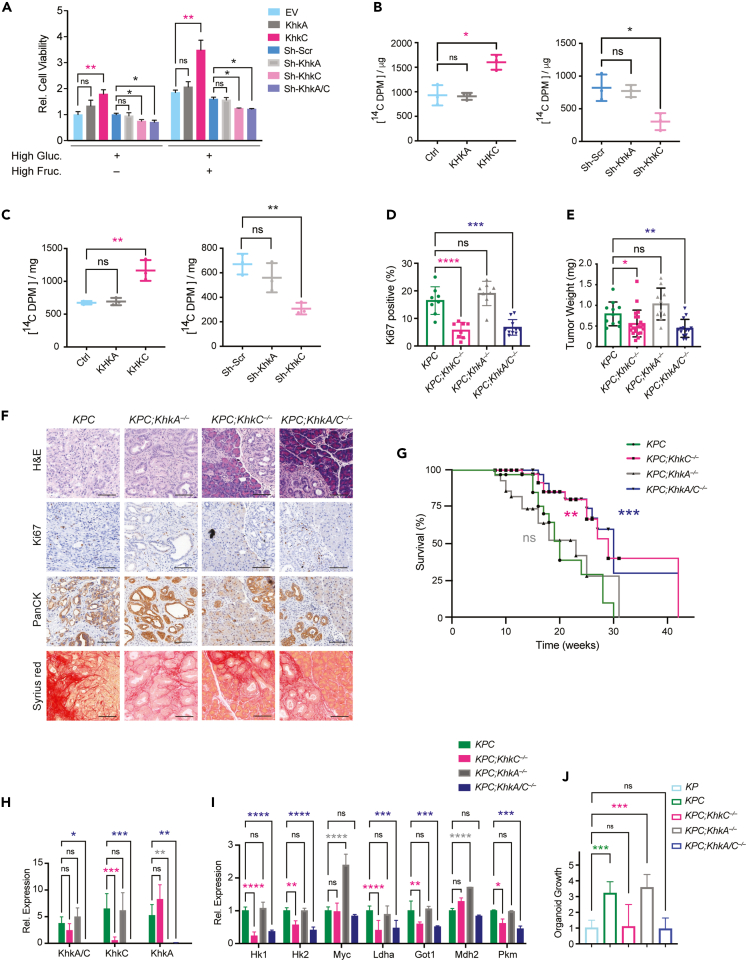
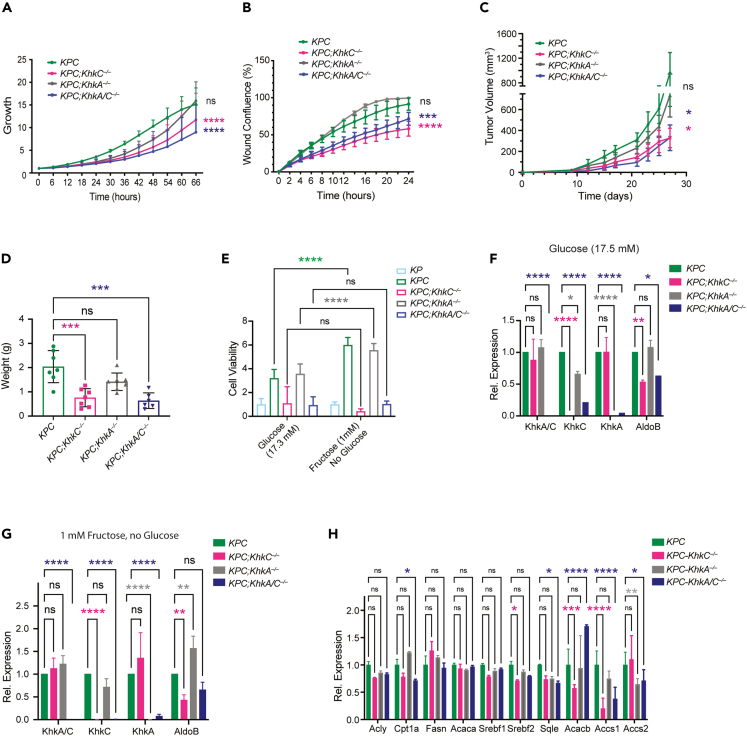
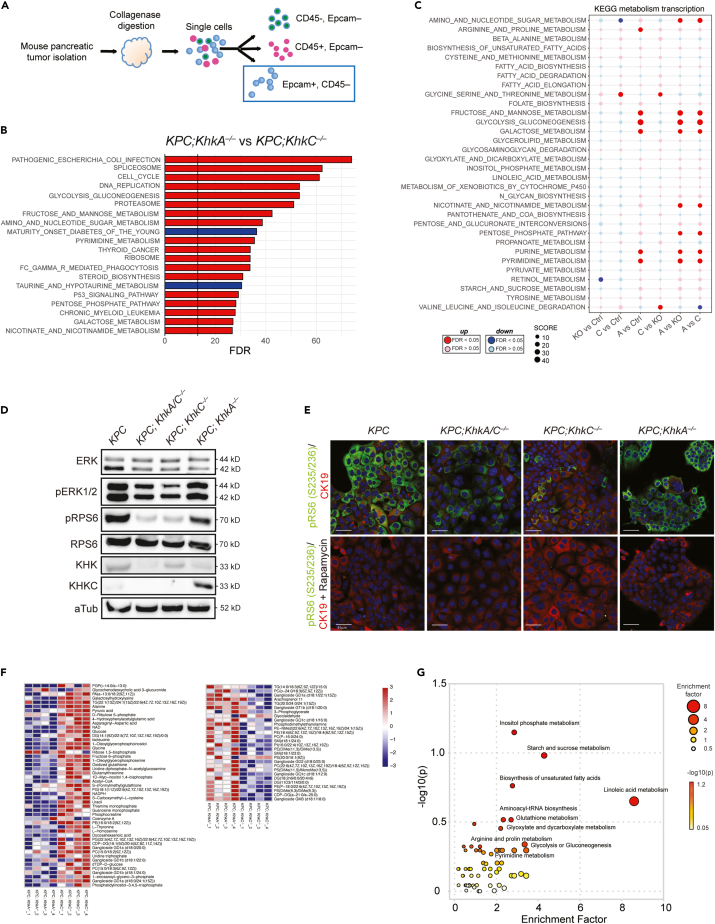
Although dietary fructose is associated with an elevated risk for pancreatic cancer, the underlying mechanisms remain elusive. Here, we report that ketohexokinase (KHK), the rate-limiting enzyme of fructose metabolism, is a driver of PDAC development. We demonstrate that fructose triggers KHK and induces fructolytic gene expression in mouse and human PDAC. Genetic inactivation of KhkC enhances the survival of KPC-driven PDAC even in the absence of high fructose diet. Furthermore, it decreases the viability, migratory capability, and growth of KPC cells in a cell autonomous manner. Mechanistically, we demonstrate that genetic ablation of KHKC strongly impairs the activation of KRAS-MAPK pathway and of rpS6, a downstream target of mTORC signaling. Moreover, overexpression of KHKC in KPC cells enhances the downstream KRAS pathway and cell viability. Our data provide new insights into the role of KHK in PDAC progression and imply that inhibiting KHK could have profound implications for pancreatic cancer therapy.

Keywords: Biochemistry; Biological sciences; Cancer systems biology; Natural sciences; Systems biology.


Conflict of interest statement

M.S. is a member of the Scientific Advisory Board of Alnylam Pharmaceuticals. All other authors declare no conflict of interest relating to this study.

Figures

None
Graphical abstract
Figure 1
Figure 1
KHKA/C is overexpressed in human and mouse PDAC tumors (A) Representative images of KHK in KP versus KPC mouse pancreata at the age of 20 weeks. Scale bar: 100 μm. (B) Quantification, represented as mean of staining intensity/area of KHK from KP versus KPC mouse pancreata, n = 13. (C) KHK activity measured in mouse pancreata, n = 7. (D) Western blots of indicated proteins from KP versus KPC mouse tumor organoids. Each lane represents an independent tumor organoid. (E) KHK activity determined in KP and KPC organoids, n = 4. (F) Expression levels of glycolytic and fructose metabolism genes in KP and KPC mouse organoids, n = 3. (G) Representative IHC images of KHK in human normal pancreata and PDAC tumors. Scale bar: 100 μm. (H) KHK staining intensities as a percentage per area determined by IHC stainings, n = 42. (I) Transcript levels of glycolytic and fructose metabolism genes in human KPC organoids in normoxic and hypoxic (1%) conditions, n = 3. (J) Relative transcript levels of glycolytic and fructose metabolism genes in KPC organoids, cultured in normoxic and hypoxic (1%) conditions for 24 h, n = 3. (K) KHK activity of KPC organoids cultured in normoxic and hypoxic conditions for 24 h, n = 4. Data are represented as Mean ± SEM. The p values were determined by Student’s t test (unpaired two-tailed), n.s. (non-significant), ∗p < 0.05, ∗∗p < 0.01 and ∗∗∗p < 0.001.
Figure 2
Figure 2
High Fructose enhances proliferation and decreases the overall survival of mice with KPC-driven PDAC (A) Representative images of Edu incorporation assay performed in KPC organoids and cultured in low glucose (LG, 3 mM), high glucose (HG, 17.3 mM) or low glucose with fructose (LG, 3 mM, 1 mM FR) medium for 48 h. Scale bar: 100 μm. (B) Dot plot representing the percentage of Edu positive cells from organoids as shown in A, n = 3. (C) Dot plot representing the percentage of cell viability from organoids as shown in A, n = 3. (D) Relative transcript levels of Slc2a5, KhkA and KhkC isoforms in KPC organoids, cultured in low glucose (LG) and low glucose with 1 mM fructose (LG + FR), n = 3. (E) KHK activity measurements of KPC organoids cultured in low glucose (LG) and low glucose with 1 mM fructose (LG + FR), n = 3. (F) Representative IHC images of PanCK (Pan-Cytokeratin), Ki67 and KHK stainings in tissue sections from KPC mice treated with 25% of fructose for 10 weeks. Scale bar: 100 μm. (G) Tumors weight endpoints (mg) from KP and KPC mice treated with 25% of fructose diet for 10 weeks, n = 31 in total. The p values were determined by ANOVA multiple comparison test (Sidák’s multiple comparison test). (H) Percentage of Ki67 positivity in KPC mice treated with 25% of fructose diet for 10 weeks, n = 12 in total. The p values were determined by Student’s t test (unpaired two-tailed). (I) Survival percentage of KP and KPC mice with or without 25% of fructose diet for 10 weeks. Kaplan-Meier survival curves were compared by Mantel-Cox log rank test, n = 177 in total. (J) Relative transcript levels of glycolytic (Hif1α, Slc2a1) and fructose metabolic genes (Slc2a5, KhkA, KhkC and AldoB) in KPC pancreata treated with a fructose 25% diet, n = 3. Data are represented as Mean ± SEM. The p values were determined by Student’s t test (unpaired two-tailed) or ANOVA multiple comparison test (Sidák’s test) when mentioned, n.s. (non-significant), ∗p < 0.05, ∗∗p < 0.01 and ∗∗∗p < 0.001, ∗∗∗∗p < 0.0001.
Figure 3
Figure 3
KHKC overexpression promotes tumor growth and KhkC KO is sufficient to delay the onset and development of tumors (A) KhkA or KhkC was either over-expressed or downregulated by shRNAs in KPC organoids and cell viability was measured after a 48-h incubation in media with or without fructose, n = 3. ANOVA multiple comparison test (Tukey’s test). (B) [14C] fructose incorporation into DNA in KPC organoids overexpressing empty vector (Ctrl), KhkA or KhkC, or after knockdown using sh-Scr (Scramble control) sh-KhkA or sh-KhkC, respectively after a 16 h incubation, n = 3. (C) [14C] fructose incorporation measurements into protein of KPC organoids overexpressing empty vector (Ctrl), KhkA or KhkC or after knockdown using sh-Scr (Scramble control) sh-KhkA or sh-KhkC, respectively, following a 16 h incubation, n = 3. (D) Percentage of Ki67 positivity in mouse tumor sections with the indicated genotype, n = 34 in total. ANOVA multiple comparison test (Tukey’s test). (E) Evaluation of pancreas tumor weight from mice with the indicated genotypes at 20 weeks of age, n = 57. ANOVA multiple comparison test (Tukey’s test). (F) Representative IHC images of H&E, Ki67, PanCK and Sirius red staining from KPC, KPC;KhkC−/−; KPC;KhkA−/−; KPC;KhkA/C−/− tumors at 20 weeks of age. (G) Percentage of survival of KPC, KPC;KhkC−/−; KPC;KhkA−/−; KPC;KhkA/C−/− mice, n = 149. Kaplan-Meier survival curves were compared by Mantel-Cox log rank test. (H) Relative transcript levels of KhkA/C, KhkC, KhkA from mouse organoids derived from the indicated genotypes. (I) Relative transcript levels of metabolism genes from organoids of all four aforementioned genotypes. (J) Growth measurements of organoids from all indicated genotypes cultured for 4 days in 17.3 mM glucose, n = 6. ANOVA multiple comparisons test (Tukey’s test). Data are represented as Mean ± SEM. The p values were determined by Student’s t test (unpaired two-tailed) or ANOVA multiple comparison test (Tukey’s test) when mentioned, n.s. (non-significant), ∗p < 0.05, ∗∗p < 0.01 and ∗∗∗p < 0.001, ∗∗∗∗p < 0.0001.
Figure 4
Figure 4
Pancreatic ablation of KhkC dampens the proliferation and migration of KPC driven tumors in a cell autonomous manner (A) Cell proliferation measurements of mouse derived cancer cells of KPC, KPC;KhkC−/−; KPC;KhkA−/−; KPC;KhkA/C−/−, determined by live-cell imaging analysis for 66 h, ANOVA multiple comparison test (Tukey’s test), n = 3. (B) Cell migration measurements of mouse derived KPC, KPC;KhkC−/−; KPC;KhkA−/−; KPC;KhkA/C−/− cancer cells, determined by live-cell imaging analysis of wound healing confluence for 24 h. ANOVA multiple comparison test (Tukey’s test), n = 3. (C) Fold-change of the tumor volume (mm3) of KPC, KPC;KhkC−/−; KPC;KhkA−/−; KPC;KhkA/C−/− cancer cells. ANOVA multiple comparison test (Tukey’s test), n = 8. (D) Tumor weight endpoints (in g) from KPC, KPC;KhkC−/−; KPC;KhkA−/−; KPC;KhkA/C−/− xenograft tumors. ANOVA multiple comparison test (Tukey’s test), n = 7. (E) Cell viability measurements from KPC, KPC;KhkC−/−; KPC;KhkA−/−; KPC;KhkA/C−/− mouse tumors organoids upon treatment with high glucose (17.3 mM) and high fructose (1 mM) for 4 days. (F) Relative transcript levels of KhkA/C, KhkC, KhkA and AldoB organoids treated with high glucose (17.3 mM). (G) Relative transcript levels of KhkA/C, KhkC, KhkA and AldoB from organoids of the indicated genotypes treated with high fructose (1 mM). (H) Gene expression analysis of fatty acid oxidation and lipid metabolism in high glucose diet from KPC, KPC;KhkC−/−, KPC;KhkA−/−, and KPC;KhkA/C−/− organoids. ANOVA multiple comparison test (Tukey’s test), n = 3. Data are represented as Mean ± SEM. The p values were determined by Student’s t test (unpaired two-tailed) or ANOVA multiple comparison test (Tukey’s test) when mentioned, n.s. (non-significant), ∗p < 0.05, ∗∗p < 0.01 and ∗∗∗p < 0.001, ∗∗∗∗p < 0.0001.
Figure 5
Figure 5
Pancreatic KhkC inactivation rewires PDAC metabolism-related pathways (A) Schematic of sorting strategy of Epcam+; CD45– cells from KPC, KPC;KhkC−/−; KPC;KhkA−/−; KPC;KhkA/C−/− mouse tumors at 20 weeks of age. (B) Gene set enrichment analysis (GSEA) on the most regulated KEGG pathways from RNA-seq analysis of Epcam+; CD45– KPC;KhkA−/− and KPC;KhkC−/− mouse tumor cells (n = 2). p values are expressed in form of −10 × log 10FDR (FDR-adjusted). Upregulated: red; downregulated: blue. (C) Dot plots representing a KEGG analysis of metabolic pathways from ex vivo Epcam+; CD45cells transcriptomics analysis. (KPC: n = 3; KPC;KhkA/C−/−: n = 3; KPC;KhkC−/−: n = 2; KPC;KhkA−/−: n = 2). p values are expressed in form of −10 × log 10 FDR (FDR-adjusted). Upregulated: red; downregulated: blue. (D) Representative Western blot of KPC, KPC;KhkC−/−, KPC;KhkA−/−, and KPC;KhkA/C−/− mouse tumors cells showing the downregulation of p-ERK1/2 and p-RPS6. (E) Representative IF images from KPC, KPC;KhkC−/−, KPC;KhkA−/−, and KPC;KhkA/C−/− cancer cells showing CK19 and phospho RpS6 expression (upper panel), and validation by treatment for 16 h with Rapamycin (lower panel). Scale bar: 45μm. (F) Heatmap showing the quantification of LC-MS metabolites of KPC;KhkC−/− and KPC;KhkA−/− cancer cell lines upon high fructose treatment for 48 h, n = 4. (G) Bubble chart of KEGG pathway enrichment. The size and color of each circle indicate the significance of the pathway ranked by p value (red: higher p values and yellow: lower p values) and enrichment factor (the larger the circle the higher the impact score), respectively.

Similar articles

Cited by

References

    1. Hosein A.N., Dougan S.K., Aguirre A.J., Maitra A. Translational advances in pancreatic ductal adenocarcinoma therapy. Nat. Cancer. 2022;3:272–286. doi: 10.1038/s43018-022-00349-2. - DOI - PubMed
    1. Ushio J., Kanno A., Ikeda E., Ando K., Nagai H., Miwata T., Kawasaki Y., Tada Y., Yokoyama K., Numao N., et al. Pancreatic ductal adenocarcinoma: epidemiology and risk factors. Diagnostics. 2021;11:562. doi: 10.3390/diagnostics11030562. - DOI - PMC - PubMed
    1. Hu H.F., Ye Z., Qin Y., Xu X.W., Yu X.J., Zhuo Q.F., Ji S.R. Mutations in key driver genes of pancreatic cancer: molecularly targeted therapies and other clinical implications. Acta Pharmacol. Sin. 2021;42:1725–1741. doi: 10.1038/s41401-020-00584-2. - DOI - PMC - PubMed
    1. Biancur D.E., Kimmelman A.C. The plasticity of pancreatic cancer metabolism in tumor progression and therapeutic resistance. Biochim. Biophys. Acta. Rev. Cancer. 2018;1870:67–75. doi: 10.1016/j.bbcan.2018.04.011. - DOI - PMC - PubMed
    1. Vander Heiden M.G., Cantley L.C., Thompson C.B. Understanding the Warburg effect: the metabolic requirements of cell proliferation. Science. 2009;324:1029–1033. doi: 10.1126/science.1160809. - DOI - PMC - PubMed

LinkOut - more resources