. 2023 Jul 15;13(7):2790-2813.
eCollection 2023.

Autotaxin production in the human breast cancer tumor microenvironment mitigates tumor progression in early breast cancers

Affiliations

Autotaxin production in the human breast cancer tumor microenvironment mitigates tumor progression in early breast cancers

Matthew Gk Benesch et al. Am J Cancer Res. .

Abstract

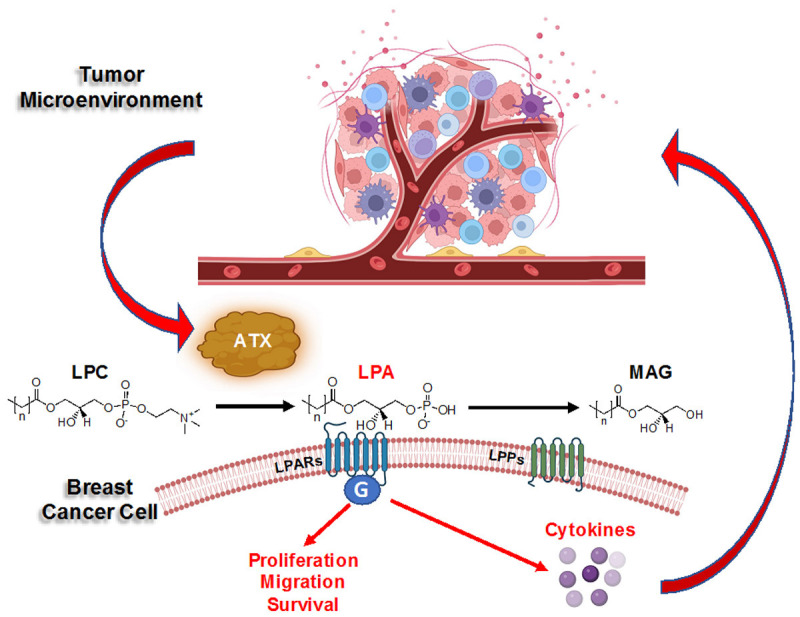
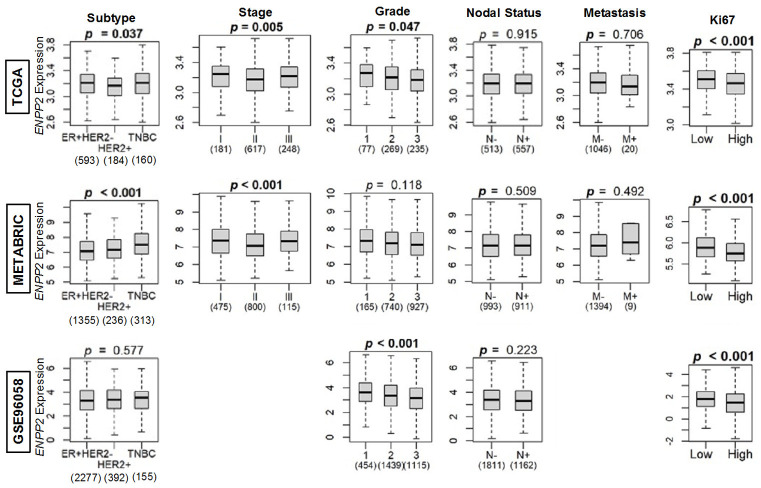
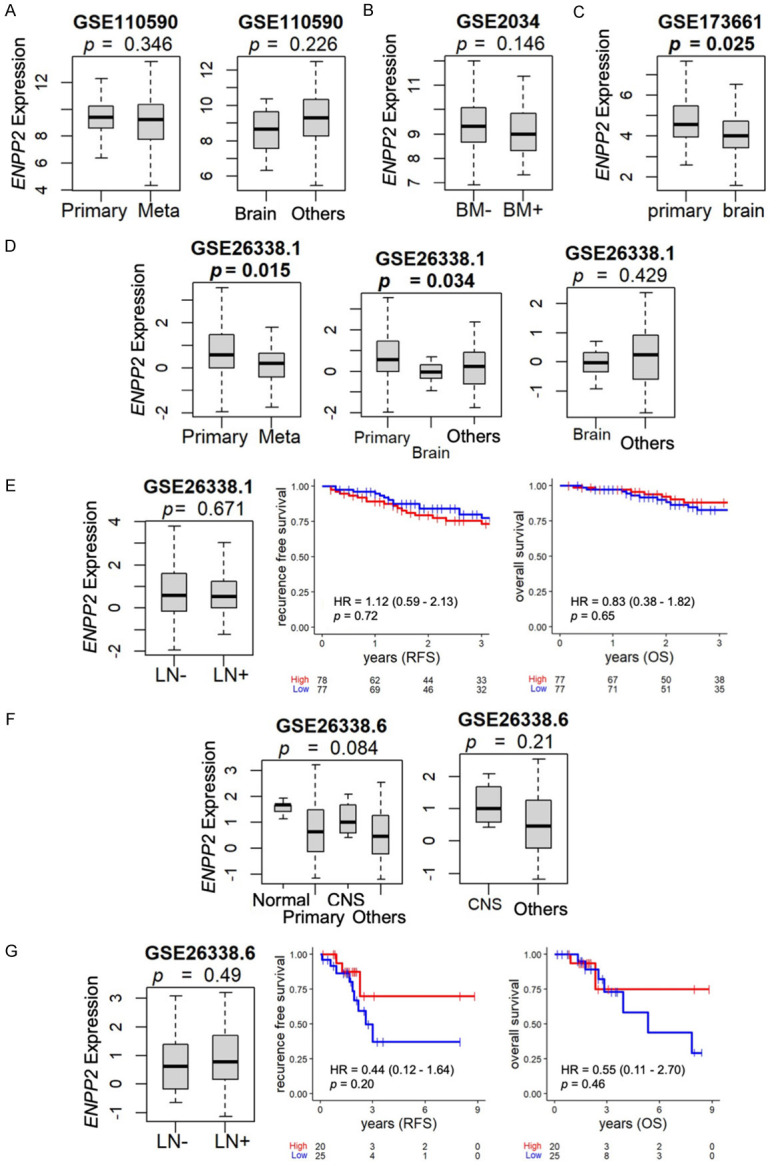
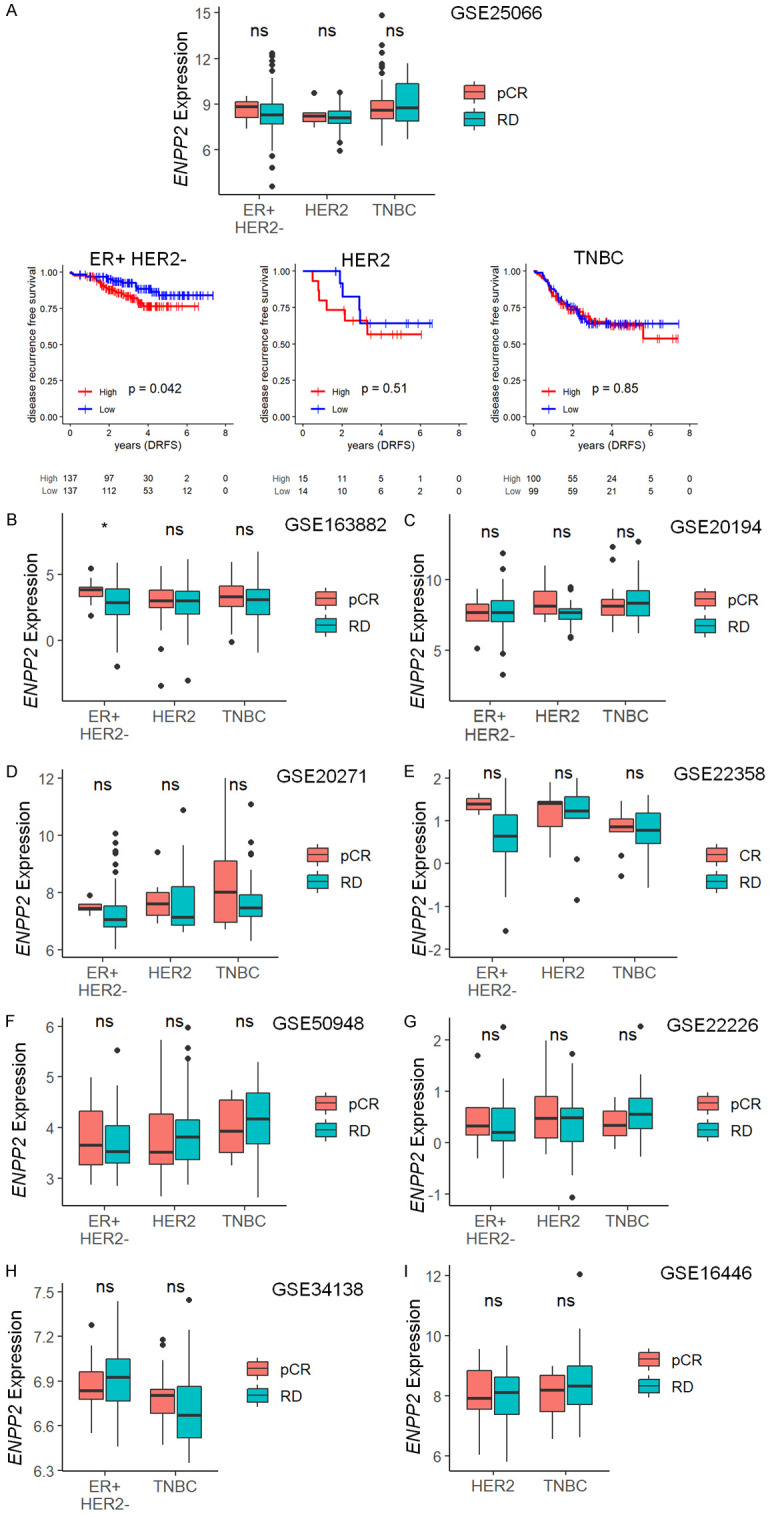
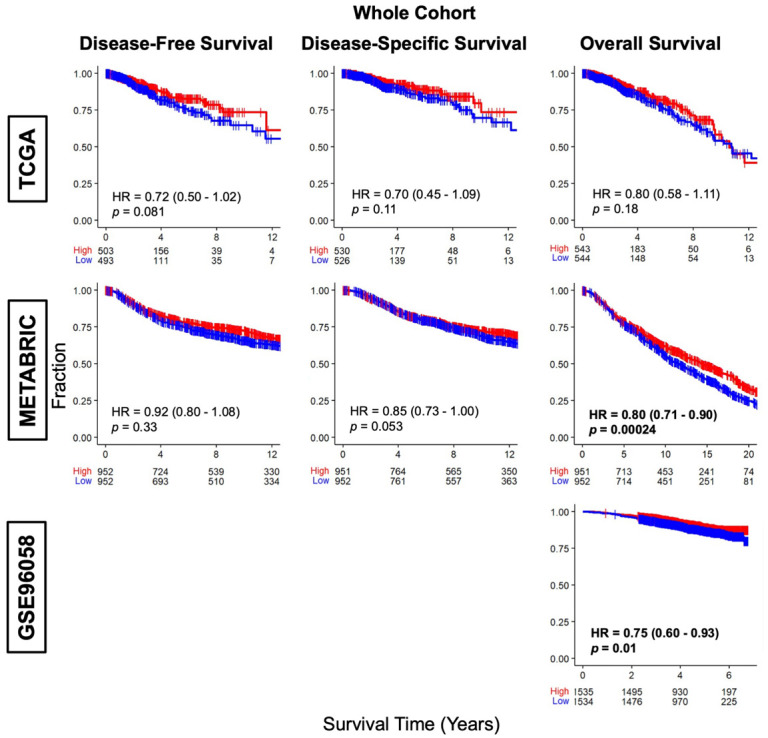
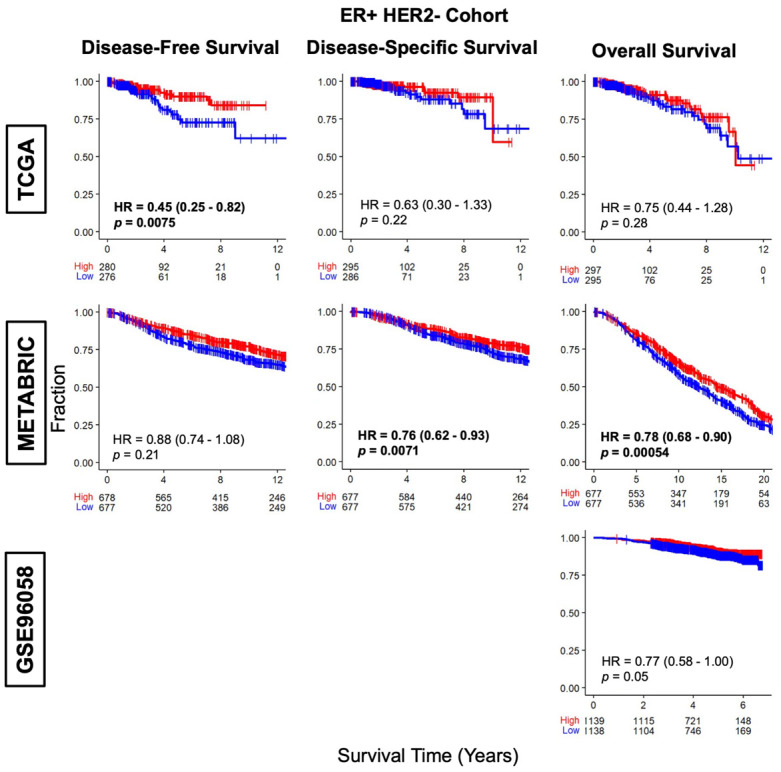
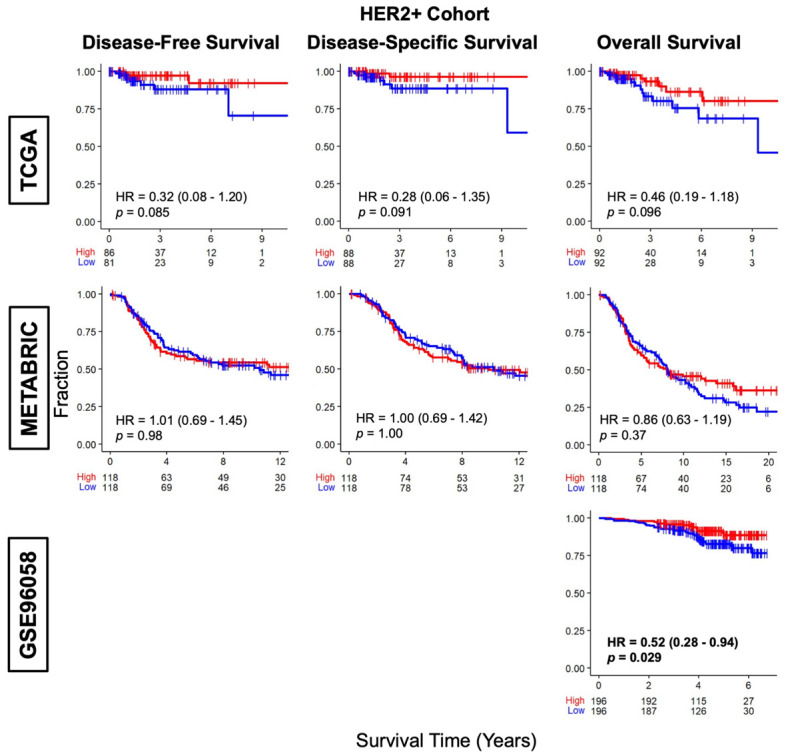
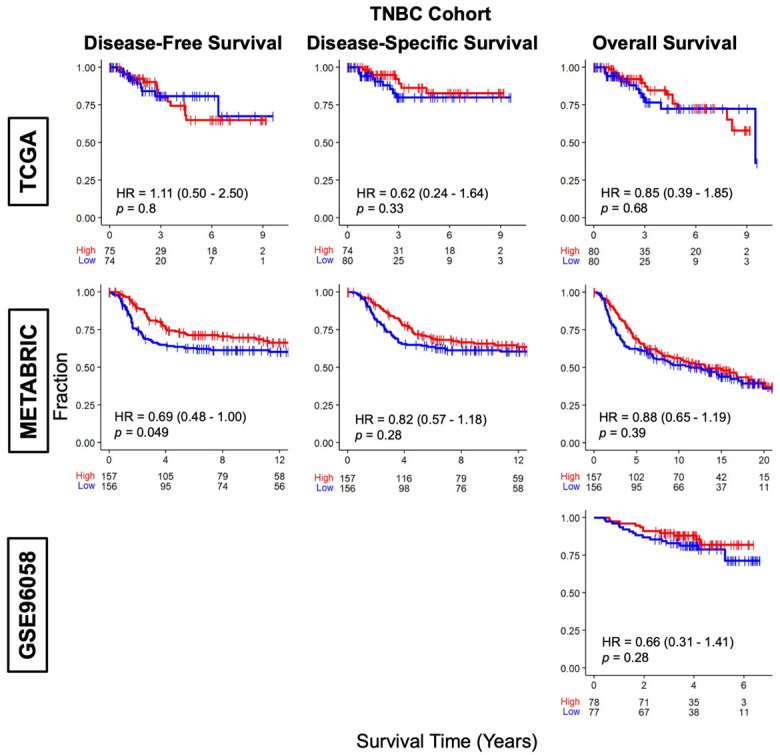
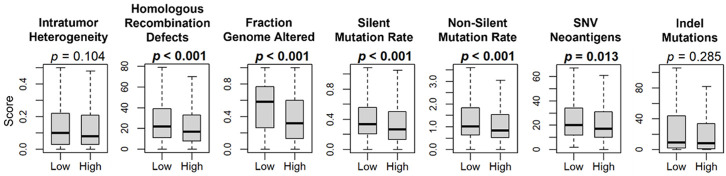
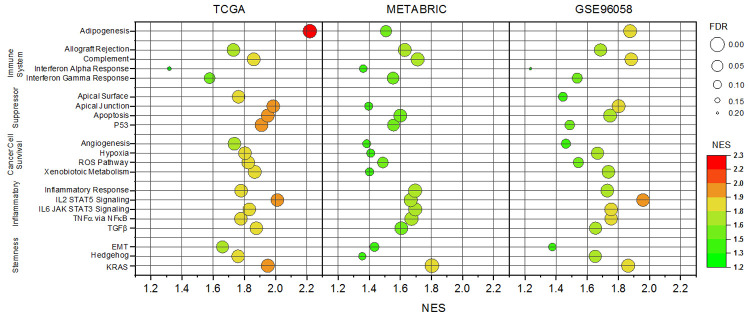
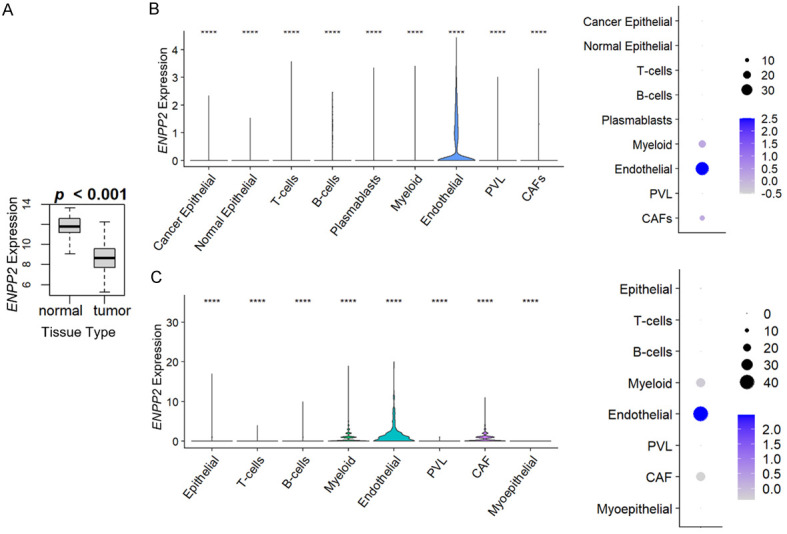
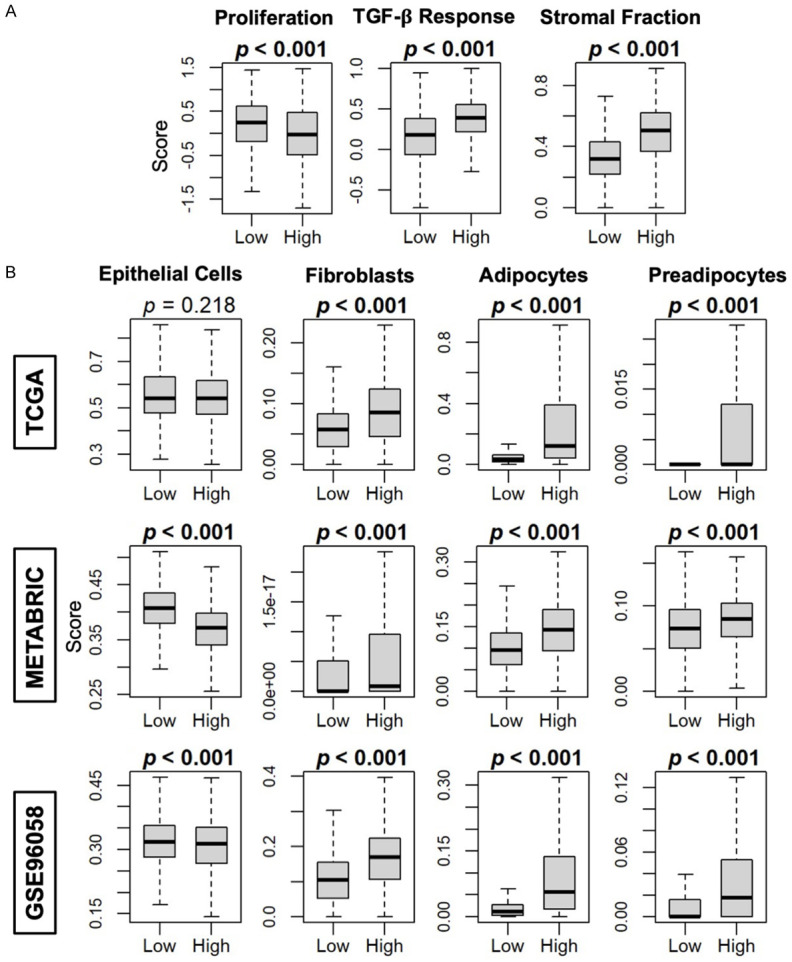
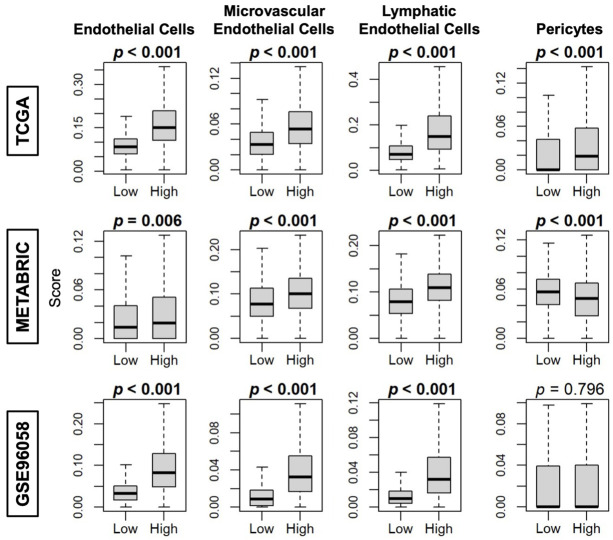
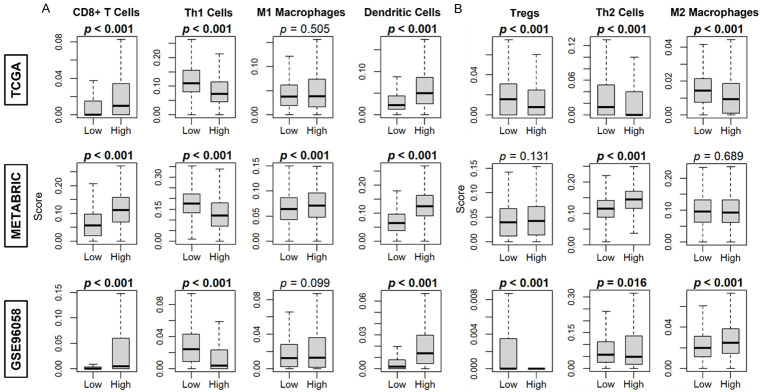
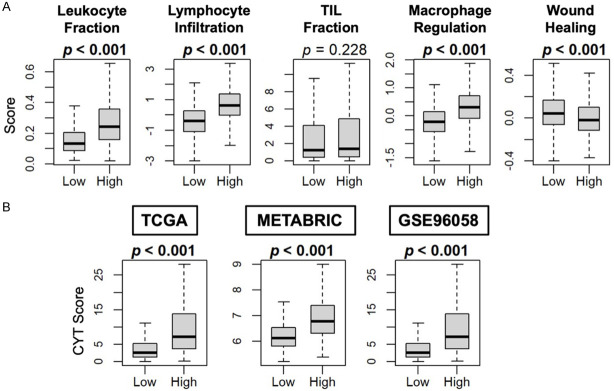
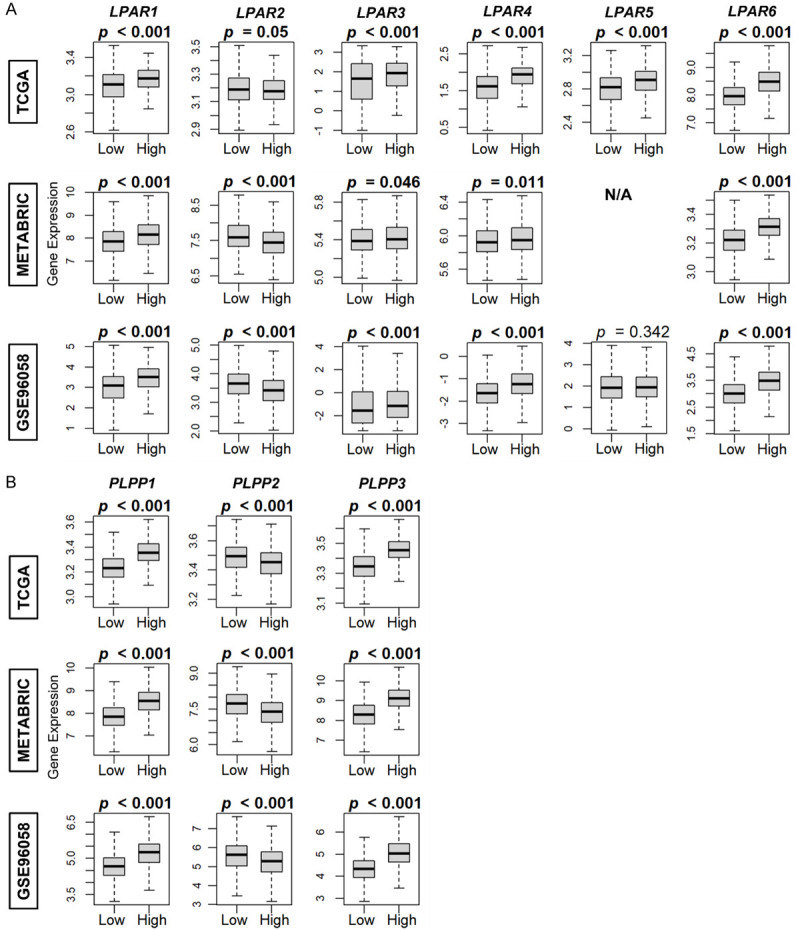
Autotaxin (ATX) is a secreted enzyme that produces extracellular lysophosphatidate in physiological wound healing. ATX is overexpressed in many cancers to promote growth, metastasis, and treatment resistance. However, ATX expression is very low in breast cancer cells, and is instead secreted by the tumor microenvironment (TME). Paracrine ATX expression, and its effects on tumor progression, has not been robustly studied in human breast tumors. In this study, ATX expression was analyzed in over 5000 non-metastatic breast cancers from databases TCGA, METABRIC and GSE96058, dichotomized by the median. Gene set enrichment analysis (GSEA) and the xCell algorithm investigated biological functions of ATX and correlation to TME cell populations. TME ATX production was verified by single cell RNA sequencing. The highest ATX expression occurred in endothelial cells and cancer-associated fibroblasts (P<0.0001). High tumor ATX expression correlated to increased adipocyte, fibroblast, and endothelial cell fractions (P<0.01), and GSEA demonstrated enriched immune system, tumor suppressor, pro-survival, stemness, and pro-inflammatory signaling in multiple gene sets. Tumor mutational burden was decreased, Ki67 scores were decreased, tumor infiltrating immune cell populations increased, and immune cytolytic activity scores increased (all P<0.01) for ATX-high tumors. Overall survival trends favored ATX-high tumors (hazard ratios 0.75-0.80). In summary, in human breast cancers, ATX is produced by the TME, and in non-metastatic tumors, high levels correlate with an anti-tumor phenotype. Because pre-clinical models use aggressive pro-metastatic cell lines where ATX-mediated signaling promotes tumorigenesis, further research is required to verify an anti-to-pro-tumor phenotype switch with breast cancer progression and/or treatment resistance.

Keywords: Adipose tissue; adjuvant therapy; cytokines; lysophosphatidic acid; novel therapeutics; tumor progression.


Conflict of interest statement

None.

Figures

Figure 1
Figure 1
Overview of autotaxin (ATX) signaling in the breast cancer tumor microenvironment from pre-clinical studies. ATX is produced primarily by the breast cancer tumor stroma and surrounding inflamed adipose tissue in response to cytokines produced by the growing tumor. These cytokines in turn increase further production of ATX. The signaling effects of ATX are mediated by its production of extracellular lysophosphatidate (LPA) from lysophosphatidylcholine (LPC), which signals through six G-protein coupled receptors within the tumor to elicit pro-cancer effects. LPA is turned over to biologically inactive monoacylglycerol (MAG) by the ecto-activity of three enzymes known as the lipid phosphate phosphatases (LPPs).
Figure 2
Figure 2
ATX (ENPP2) gene expression by breast cancer characteristics. Breast cancer subtype. ER+ HER2- (estrogen receptor positive, human epidermal growth factor receptor negative tumors), HER2+, TNBC (triple negative breast cancer). Staging according to the American Joint Committee on Cancer (AJCC). Stage is not available for the GSE96058 cohort. Grading according to AJCC. Tumor nodal status (negative or positive). Tumor metastasis (negative or positive). Because stage is not available for the GSE96058 cohort, metastasis data is also unavailable for this cohort. Ki67 box plots based on median ENPP2 expression. Counts for non-median box plot groupings are displayed in brackets. Units of ENPP2 expression: TCGA - log2 transformed RSEM, METABRIC - log intensity levels, and GSE96058 - log2 transformed CPM. The bolded center bar within the box plots represents the median, the lower and upper box bounds represent the 25th and 75th percentiles, respectively, and the lower and upper tails represent the minimum and maximum values, respectively.
Figure 3
Figure 3
ATX (ENPP2) expression and survival trends for locally advanced or metastatic breast cancer tumors. A. Results from 17 primary tumors (Primary) and 66 metastatic (Meta) tumors from matched patients (left), and comparison between 10 brain metastases (Brain) and 56 other non-brain specimens (Others) (right). B. Results from 217 primary tumors without bone metastasis (BM-) and 69 primary tumors with bone metastasis (BM+). C. Results from 45 primary tumors with patient matched brain metastasis tumors. D. Results from 204 primary tumors, from which patients a total of 29 metastasis occurred (left). ATX expression comparison among the 204 primary tumors, 8 brain metastatic tumors, and 21 metastatic tumors from non-brain sites (middle). Direct comparison between the 8 brain metastatic tumors and 21 metastatic tumors from non-brain sites (right). E. Results from 104 primary tumors without lymph node (LN) involvement, and 75 with LN involvement (left). Recurrence free survival (middle) and overall survival (right) dichotomized by medial ATX expression for this cohort. F. Results from 5 normal breast tissues (Normal), 71 primary tumors (Primary), 4 central nervous system (CNS) metastatic tumors, and 20 metastatic tumors at other sites (Other) (right). Comparison between the CNS and other sites (left). G. Results from 36 primary tumors without LN involvement, and 33 with LN involvement (left). Recurrence free survival (middle) and overall survival (right) dichotomized by medial ATX expression for this cohort. All units of ENPP2 expression are log2 transformed CPM.
Figure 4
Figure 4
Association between neoadjuvant chemotherapy (NAC) response (pathological complete response (pCR) and residual disease (RD)) and ATX (ENPP2) expression levels from pre-treatment biopsies. A. NAC regimen: AC-T (doxorubicin and cyclophosphamide followed by paclitaxel); ER+ HER2- n = 274, HER2 n = 29, TNBC n = 199. Disease recurrence free survival plots for the entire cohort dichotomized into low and high ATX expression by the mean are shown for each hormonal subtype. B. NAC regimen: anthracycline and taxane (± trastuzumab); ER+ HER2- n = 69, HER2 n = 63, TNBC n = 90. C. NAC regimen: TFAC (paclitaxel, 5-fluorouracil, doxorubicin, cyclophosphamide); ER+ HER2- n = 140, HER2 n = 59, TNBC n = 79. D. NAC regimen: FAC/TFAC; ER+ HER2- n = 89, HER2 n = 26, TNBC n = 63. E. NAC regimen: Docetaxel and capecitabine; ER+ HER2- n = 67, HER2 n = 34, TNBC n = 52. F. NAC regimen: AT followed by CMF (cyclophosphamide, methotrexate, 5-fluorouracil), or the same regimen in combination with trastuzumab for 1 year; ER+ HER2- n = 25, HER2 n = 114, TNBC n = 17. G. NAC regimen: AC-T; ER+ HER2- n = 41, HER2 n = 39, TNBC n = 31. H. NAC regimen: dose-dense doxorubicin and cyclophosphamide; ER+ HER2- n = 119, TNBC n = 57. I. NAC regimen: Anthracycline (epirubicin) monotherapy; HER2 n = 31, TNBC n = 62. The bolded center bar within the box plots represents the median, the lower and upper box bounds represent the 25th and 75th percentiles, respectively, and the lower and upper tails represent the 1 percentile and 99 percentile values, respectively, with black dots representing values outside these percentiles. All units of ENPP2 expression are log2 transformed CPM. ER, estrogen receptor; HER2, human epidermal growth factor receptor; NAC, neoadjuvant chemotherapy; NS, not significant; TNBC, triple negative breast cancer.
Figure 5
Figure 5
Survival plots for low and high ATX (ENPP2) gene expression in breast tumors for the whole cohort for each dataset. Patients at risk for each time point are listed along the x-axis. ENPP2 expression is dichotomized into low and high groups by the median. The hazard ratio (HR) compares the high group against the low group.
Figure 6
Figure 6
Survival plots for low and high ATX (ENPP2) gene expression in breast tumors for the estrogen receptor (ER)-positive, human epidermal growth factor receptor (HER2)-negative cohort for each dataset. Patients at risk for each time point are listed along the x-axis. ENPP2 expression is dichotomized into low and high groups by the median. The hazard ratio (HR) compares the high group against the low group.
Figure 7
Figure 7
Survival plots for low and high ATX (ENPP2) gene expression in breast tumors for the human epidermal growth factor receptor (HER2)-positive cohort for each dataset. Patients at risk for each time point are listed along the x-axis. ENPP2 expression is dichotomized into low and high groups by the median. The hazard ratio (HR) compares the high group against the low group.
Figure 8
Figure 8
Survival plots for low and high ATX (ENPP2) gene expression in breast tumors for the triple negative breast cancer (TNBC) cohort for each dataset. Patients at risk for each time point are listed along the x-axis. ENPP2 expression is dichotomized into low and high groups by the median. The hazard ratio (HR) compares the high group against the low group.
Figure 9
Figure 9
ATX (ENPP2) gene expression association with breast cancer mutations. Box plots of intratumor heterogeneity, homologous recombination defects, fraction genome altered, silent mutation rate, non-silent mutation rate, single-nucleotide variant (SNV) neoantigens, and indel mutations. Data is based on the scores by Thorsson et al. [45]. ENPP2 expression is dichotomized into low and high groups by the median (total counts by cohort: TCGA - 1090, METABRIC - 1094, GSE96058 - 3609). Units of ENPP2 expression: TCGA - log2 transformed RSEM, METABRIC - log intensity levels, and GSE96058 - log2 transformed CPM. The bolded center bar represents the median, the lower and upper box bounds represent the 25th and 75th percentiles, respectively, and the lower and upper tails represent the minimum and maximum values, respectively.
Figure 10
Figure 10
Gene set enrichment analysis (GSEA) for ATX (ENPP2) in breast cancer. Gene sets are grouped into common themes. All gene sets displayed were significantly increased in all three datasets examined. A false discovery rate (FDR) of less than 0.25 was considered statistically significant. Dot size represents the FDR value, and they are colored according to the normalized enrichment score (NES).
Figure 11
Figure 11
ATX gene expression (ENPP2) is increased in normal breast tissue compared to breast cancer tumors and is primarily produced by tumor stromal cells. (A) mRNA expression from 114 normal breast tissues is compared to 1090 breast cancer tumors from the TCGA database. Results are plotted as box plots. The bolded center bar represents the median, the lower and upper box bounds represent the 25th and 75th percentiles, respectively, and the lower and upper tails represent the minimum and maximum values, respectively. (B) Results from cohort described in [36], comprised of 26 tumors (11 ER+ HER2-, 5 HER2+, and 10 TNBC), with a total of 130,246 single cells. (C) Results from cohort described in [35], comprised of 5 TNBC tumors, with a total of 24,271 single cells. For results in (B, C), violin plot results are shown following t-test for each type compared with the base mean (****P≤0.0001). The summary chart shows the overall percentage of the total ATX expression by cell type and the average expression within each cell type for each cohort.
Figure 12
Figure 12
Proliferation and stromal related scores, and epithelial, fibroblast, adipocyte, and preadipocyte composition correlation with ATX (ENPP2) expression in breast cancer. A. Box plots of calculated scores for proliferation, TGF-β response, and stromal fraction based on Thorsson et al. [45]. B. Box plots of epithelial cell, fibroblast, adipocyte, and preadipocyte composition based on the xCell algorithm for the TCGA, METABRIC, and GSE96058 cohorts. ENPP2 expression is dichotomized into low and high groups by the median (total counts by cohort: TCGA - 1090, METABRIC - 1094, GSE96058 - 3609). The bolded center bar represents the median, the lower and upper box bounds represent the 25th and 75th percentiles, respectively, and the lower and upper tails represent the minimum and maximum values, respectively.
Figure 13
Figure 13
Endothelial cell, microvascular endothelial cell, lymphatic endothelial cell, and pericyte composition correlation with ATX (ENPP2) expression in breast cancer. Box plots of endothelial cell, microvascular endothelial cell, lymphatic endothelial cell, and pericyte composition based on the xCell algorithm for the TCGA, METABRIC, and GSE96058 cohorts. ENPP2 expression is dichotomized into low and high groups by the median (total counts by cohort: TCGA - 1090, METABRIC - 1094, GSE96058 - 3609). The bolded center bar represents the median, the lower and upper box bounds represent the 25th and 75th percentiles, respectively, and the lower and upper tails represent the minimum and maximum values, respectively.
Figure 14
Figure 14
Anti-cancerous and pro-cancerous immune cell correlation with ATX (ENPP2) expression in breast cancer tumors. A. Populations of anti-cancerous immune cells. B. Populations of pro-cancerous immune cells. Box plots are based on the xCell algorithm for the TCGA, METABRIC, and GSE96058 cohorts. ENPP2 expression is dichotomized into low and high groups by the median (total counts by cohort: TCGA - 1090, METABRIC - 1094, GSE96058 - 3609). The bolded center bar represents the median, the lower and upper box bounds represent the 25th and 75th percentiles, respectively, and the lower and upper tails represent the minimum and maximum values, respectively.
Figure 15
Figure 15
Immune scores for markers of tumor immune cell populations and cytolytic (CYT) score correlation with ATX (ENPP2) expression in breast cancer tumors. A. Immune score results are based on score by Thorsson et al. [45]. B. CYT scores are calculated using the xCell algorithm. ENPP2 expression is dichotomized into low and high groups by the median (total counts by cohort: TCGA - 1090, METABRIC - 1094, GSE96058 - 3609). The bolded center bar represents the median, the lower and upper box bounds represent the 25th and 75th percentiles, respectively, and the lower and upper tails represent the minimum and maximum values, respectively.
Figure 16
Figure 16
LPA receptor (LPAR) and lipid phosphate phosphatase (LPP) expression correlation to low and high ATX (ENPP2) expression breast tumors. A. ENPP2 expression by LPARs. B. ENPP2 expression by LPPs. ENPP2 expression is dichotomized into low and high groups by the median (total counts by cohort: TCGA - 1090, METABRIC - 1094, GSE96058 - 3609). Units of gene expression: TCGA - log2 transformed RSEM, METABRIC - log intensity levels, and GSE96058 - log2 transformed CPM. The bolded center bar represents the median, the lower and upper box bounds represent the 25th and 75th percentiles, respectively, and the lower and upper tails represent the minimum and maximum values, respectively. LPAR5 expression data is not available in the METABRIC cohort.

Similar articles

Cited by

References

    1. Siegel RL, Miller KD, Fuchs HE, Jemal A. Cancer statistics, 2022. CA Cancer J Clin. 2022;72:7–33. - PubMed
    1. Wang R, Zhu Y, Liu X, Liao X, He J, Niu L. The clinicopathological features and survival outcomes of patients with different metastatic sites in stage IV breast cancer. BMC Cancer. 2019;19:1091. - PMC - PubMed
    1. Centers for Disease Control and Prevention. U.S. Cancer Statistics Female Breast Cancer Stat Bite. US Department of Health and Human Services. 2022
    1. Benesch MGK, Tang X, Brindley DN. Autotaxin and breast cancer: towards overcoming treatment barriers and sequelae. Cancers (Basel) 2020;12:374. - PMC - PubMed
    1. Lainetti PF, Leis-Filho AF, Laufer-Amorim R, Battazza A, Fonseca-Alves CE. Mechanisms of resistance to chemotherapy in breast cancer and possible targets in drug delivery systems. Pharmaceutics. 2020;12:1193. - PMC - PubMed

LinkOut - more resources