. 2023 Jul 15;13(7):3027-3040.
eCollection 2023.

High miR-200c expression is associated with suppressed epithelial-mesenchymal transition, TGF-β signaling and better survival despite enhanced cell proliferation in gastric cancer patients

Affiliations

High miR-200c expression is associated with suppressed epithelial-mesenchymal transition, TGF-β signaling and better survival despite enhanced cell proliferation in gastric cancer patients

Keiko Shichiri et al. Am J Cancer Res. .

Abstract

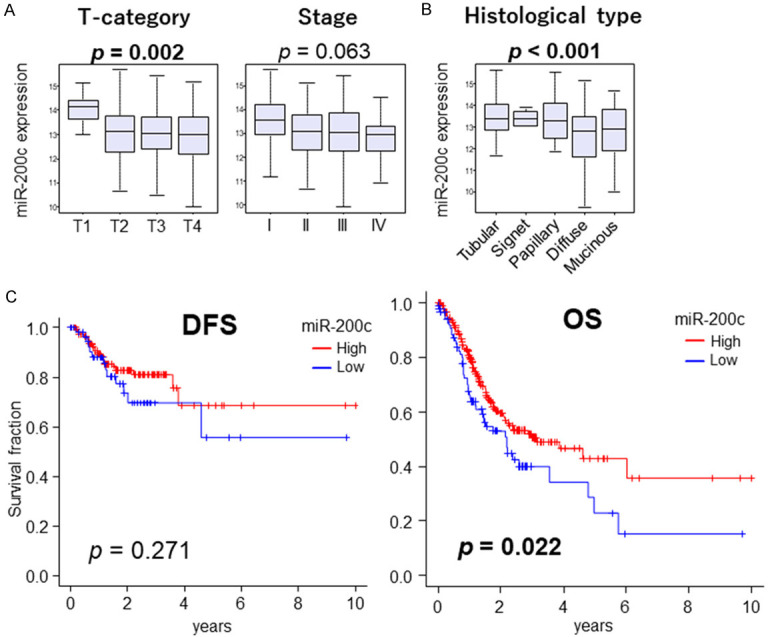
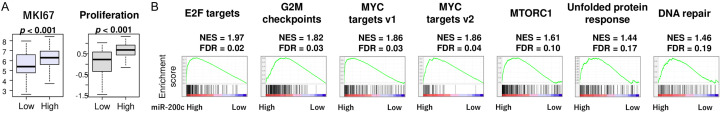
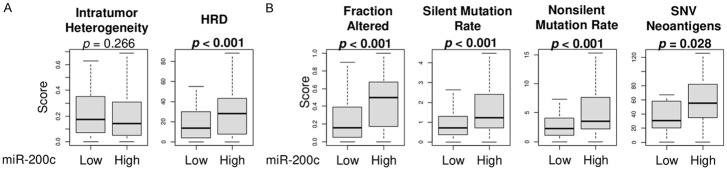
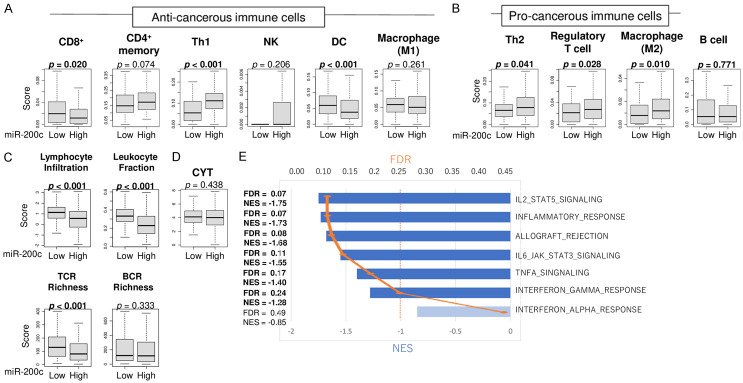
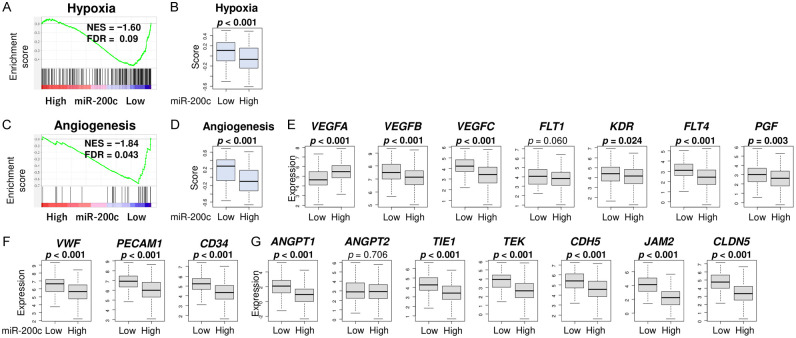
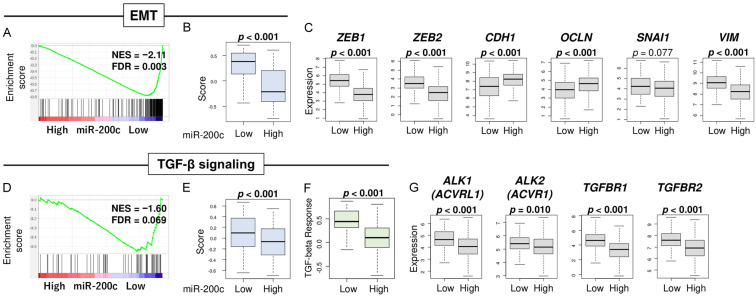
MicroRNAs are small non-coding RNAs that epigenetically regulate gene expression. MiR-200c is a known tumor suppressive microRNA found in many types of cancer, and its high expression has been associated with improved prognosis. However, the association between miR-200c expression and its clinical relevance in gastric cancer (GC) patients remains controversial. Here, we hypothesized that gastric cancer patients with high miR-200c gene expression translated to better overall survival. A total of 372 GC patients from the Cancer Genome Atlas (TCGA) were analyzed. The top three quartiles were defined as a high miR-200c expression group. High miR-200c expression was associated with decreased invasion, favorable histological type, and improved overall survival in gastric cancer patients. Unexpectedly, high miR-200c expression GC was also associated with enhanced cell proliferation, shown by MKi67 expression, proliferation score, and enrichment of Hallmark cell proliferation-related gene sets (E2F targets, G2M checkpoints, MYC targets v1 and v2) by gene set enrichment assay (GSEA). High miR-200c GC was also associated with a high mutation rate and homologous recombination deficiency. Despite the association with elevated neoantigens, high miR-200c GC was associated with significantly low infiltration of anti-cancer immune cells, decreased immune response, and with suppressed IL2, TNF-α, and IFN-γ pathways. On the other hand, GC with low miR-200c expression significantly enriched hypoxia, angiogenesis, epithelial-mesenchymal transition (EMT), and TGF-β signaling gene sets, all of which promote cancer progression and metastasis in GSEA. In conclusion, patients with high miR-200c expression GC had better survival despite association with aggressive tumor biology, such as high mutation rates, cell proliferation, and low cancer immunity. Given that low miR-200c GC was associated with hypoxia, angiogenesis, EMT and TGF-β signaling, we cannot help but speculate that the difference in survival by miR-200c expression may be at least partly due to the association between low miR-200c expression and aggressive biology.

Keywords: EMT; Gastric cancer; angiogenesis; prognosis; signaling.


Conflict of interest statement

None.

Figures

Figure 1
Figure 1
Clinical relevance of miR-200c in GC. A. Boxplots of miR-200c expression by AJCC T-category, AJCC staging. B. Boxplots of miR-200c expression by histological type. The group comparisons were tested by Mann-Whitney U test, and multiple groups by Kruskal-Wallis test. The error bars in each boxplot show the 95% confidence interval. Horizontal line inside the boxes are the median, and top and bottom show the 25th and 75th percentiles, respectively. C. Disease-Free Survival (DFS) and Overall Survival (OS) between high and low miR-200c expression groups. Top three quartiles were defined as high miR-200c expression. High groups are indicated by red lines, low groups by blue lines. P-value less than 0.05 are in bold. Log-rank test was used to test the significance of the survival analysis.
Figure 2
Figure 2
Association of miR-200c expression and cell proliferation. A. Boxplots of Ki67 gene expression (MKI67) and proliferation score by high and low miR-200c expression groups. Top three quartiles were defined as high miR-200c expression group. B. Enrichment plots of cell proliferation-related gene sets; E2F targets, G2M checkpoints, MYC targets v1 and v2, as well as other pro-cancerous gene sets; MTORC1, unfolded protein response, and DNA repair pathways in gene enrichment analysis (GSEA) comparing high vs low expression of miR200c. FDR less than 0.25 is regarded as significant in GSEA. All two group comparisons are tested by Whitney U test. The error bars in each boxplot show the 95% confidence interval. The line in the box shows the median, and top and bottom show the 25th and 75th percentiles, respectively.
Figure 3
Figure 3
Association of miR-200c expression and scores of mutation-related, intratumor heterogeneity, and homologous recombination defects (HRD) in GC. Boxplots of (A) intratumor heterogeneity and HRD. (B) Mutation-related scores; fraction altered, silent and non-silent mutation rate, and SNV (Single-nucleotide variations) neoantigens, by high and low miR-200c groups. Top three quartiles were defined as high miR-200c expression group. p-value of less than 0.05 is in bold. All two group comparisons are tested by Mann-Whitney U test.
Figure 4
Figure 4
Association of miR-200c expression and immune cell infiltrations and immune response. Boxplots of infiltrations of (A) anti-cancerous immune cells; CD8+ T cells, CD4+ memory T cells, T helper 1 (Th1) cells, NK cells, dendritic cells (DC), and M1 macrophages, (B) pro-cancerous immune cells; T helper 2 (Th2) cells, regulatory T cells, and M2 macrophages, as well as B cells, (C) immune-related score; lymphocyte infiltration signaling, leukocyte fraction, TCR and BCR richness, all pre-calculated for individual patients in TCGA by Thorsson, et al., and (D) Cytolytic activity score (CYT), by high and low miR-200c groups. Top three quartiles were defined as high miR-200c expression group. p-values less than 0.05 are in bold. All two group comparisons are tested by Whitney U test. The error bars in each boxplot show the 95% confidence interval. The line in the box shows the median, and top and bottom show the 25th and 75th percentiles, respectively. (E) Gene set enrichment analysis with immune-related hallmark gene sets; IL2/STAT5, Inflammatory response, allograft rejection, IL6/JAK/STAT, TNF-β signaling, and interferon (IFN)-α and IFN-γ response, with FDR (orange plot) and NES (blue bar). FDR less than 0.25 is regarded as significant in GSEA.
Figure 5
Figure 5
Association of miR-200c expression and hypoxia and angiogenesis scores. (A) Enrichment plot of hypoxia in GSEA comparing high vs low expression of miR200c. FDR less than 0.25 is regarded as significant in GSEA. (B) Boxplot of hypoxia. (C) Enrichment plot of angiogenesis in GSEA. Boxplots of (D) angiogenesis, (E) VEGF-related genes; VEGFA, VEGFB, VEGFC, VEGFR1, VEGFR2, and VEG-FR3 (F) endothelial cell marker; VWF, PECAM1, and CD31, and (G) vascular stability-related genes; ANGPT1, ANG-PT2, TIE1, TIE2, TEK, VE-Cadherin, JAM2, and Claudin5 between high and low miR-200c groups. Top three quartiles were defined as high miR-200c expression group. *P-value of statistical significance. All two group comparisons are tested by Whitney U test. The error bars in each boxplot show the 95% confidence interval. The line in the box shows the median, and top and bottom show the 25th and 75th percentiles, respectively.
Figure 6
Figure 6
Association of miR-200c expression and EMT and TGF-β signaling. (A) Enrichment plot of EMT signaling in GSEA comparing high vs low expression of miR-200c. FDR less than 0.25 is regarded as significant in GSEA. Boxplots of (B) EMT 5thscore (C) EMT-related genes; ZEB1, ZEB2, CDH1, SNAI1, and VIM. (D) Enrichment plot of TGF-β signaling in GSEA. Boxplots of (E) TGF-β signaling score (F) TGF-β response, which is calculated by Thorsson et al. (G) TGF-β related genes; ALK1, ALK2, TGFB1, and TGFBR2, between high and low miR-200c groups. Top three quartiles were defined as high miR-200c expression group. p-values less than 0.05 are in bold. All two group comparisons are tested by Whitney U test. The error bars in each boxplot show the 95% confidence interval. The line in the box shows the median, and top and bottom show the 25th and 7 percentiles, respectively.

Similar articles

Cited by

References

    1. Sung H, Ferlay J, Siegel RL, Laversanne M, Soerjomataram I, Jemal A, Bray F. Global cancer statistics 2020: GLOBOCAN estimates of incidence and mortality worldwide for 36 cancers in 185 countries. CA Cancer J Clin. 2021;71:209–249. - PubMed
    1. Kawaguchi T, Yan L, Qi Q, Peng X, Gabriel EM, Young J, Liu S, Takabe K. Overexpression of suppressive microRNAs, miR-30a and miR-200c are associated with improved survival of breast cancer patients. Sci Rep. 2017;7:15945. - PMC - PubMed
    1. Zhang Y, Duan Y, Wu C, Peng W, Chen W, Wang L, Deng Z. MiR-200c regulates invasion, proliferation and EMT of anaplastic thyroid cancer cells by targeting parathyroid hormone like hormone. Growth Factors. 2022;40:175–185. - PubMed
    1. Cong J, Gong J, Yang C, Xia Z, Zhang H. MiR-200c/FUT4 axis prevents the proliferation of colon cancer cells by downregulating the Wnt/β-catenin pathway. BMC Cancer. 2021;21:2. - PMC - PubMed
    1. Klicka K, Grzywa TM, Mielniczuk A, Klinke A, Włodarski PK. The role of miR-200 family in the regulation of hallmarks of cancer. Front Oncol. 2022;12:965231. - PMC - PubMed

LinkOut - more resources