. 2023 Aug;28(8):087002.
doi: 10.1117/1.JBO.28.8.087002. Epub 2023 Aug 8.

Porcine vocal fold elasticity evaluation using Brillouin spectroscopy

Affiliations

Porcine vocal fold elasticity evaluation using Brillouin spectroscopy

Vsevolod Cheburkanov et al. J Biomed Opt. 2023 Aug.

Abstract

Significance: The vocal folds are critically important structures within the larynx which serve the essential functions of supporting the airway, preventing aspiration, and phonation. The vocal fold mucosa has a unique multilayered architecture whose layers have discrete viscoelastic properties facilitating sound production. Perturbations in these properties lead to voice loss. Currently, vocal fold pliability is inferred clinically using laryngeal videostroboscopy and no tools are available for in vivo objective assessment.

Aim: The main objective of the present study is to evaluate viability of Brillouin microspectroscopy for differentiating vocal folds' mechanical properties against surrounding tissues.

Approach: We used Brillouin microspectroscopy as an emerging optical imaging modality capable of providing information about local viscoelastic properties of tissues in noninvasive and remote manner.

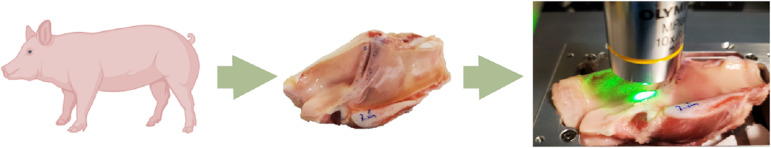
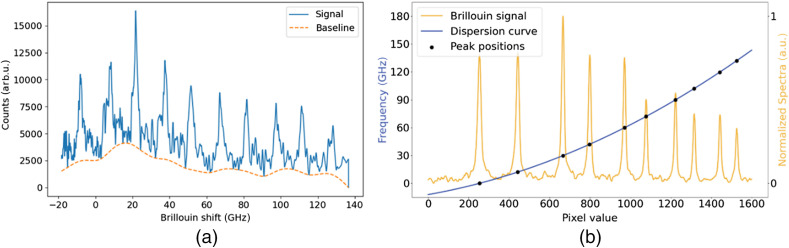
Results: Brillouin measurements of the porcine larynx vocal folds were performed. Elasticity-driven Brillouin spectral shifts were recorded and analyzed. Elastic properties, as assessed by Brillouin spectroscopy, strongly correlate with those acquired using classical elasticity measurements.

Conclusions: These results demonstrate the feasibility of Brillouin spectroscopy for vocal fold imaging. With more extensive research, this technique may provide noninvasive objective assessment of vocal fold mucosal pliability toward objective diagnoses and more targeted treatments.

Keywords: Brillouin; confocal imaging; ex vivo; larynx.


Figures

Fig. 1
Fig. 1
Porcine vocal fold cross-section and tissue layers. 1 – epithelium, 2 – superficial layer (lamina propria), 3 – intermediate layer, 4 – vocalis muscle, and 5 – deep layer.
Fig. 2
Fig. 2
Experimental flowchart. Created with BioRender.
Fig. 3
Fig. 3
Brillouin confocal microspectrometer layout. (BB: beam block; C1: 1064 nm FC/APC fiber collimator; CL: cylindrical lens; D2: dichroic mirror; EMCCD: electron-multiplying charge coupled device detector; HWP1: 1064 nm half-wave plate; HWP2: 532 nm half-wave plate; L1, L2, and L7: plano-convex lens; L3, L4, L5, and L6: cemented achromatic doublets; O: objective; BS: broadband visible range polarizing beamsplitter cube; PH: precision pinhole; PPLN: periodically poled second harmonic generating lithium niobate crystal; QWP: 532 nm quarter-wave plate; RR: hollow-roof prism retroreflector; S: sample; SPF: 750 nm short-pass filter; VC: Iodine reference vapor cell; and VIPA: virtually image phased array).
Fig. 4
Fig. 4
(a) Lateral half after a vertical midline section of a pig larynx sample. Highlighted regions are: SGW (red), SVF (green), IVF (blue), subglottal Wall (white), and arytenoid (black). (b)–(e) Samples prepared for interrogation with each region selected are labeled consecutively from top to bottom. White bar shows a 15 mm scale.
Fig. 5
Fig. 5
(a) Retrieved porcine larynx Brillouin scattering signal (solid line) and baseline curve (dashed line) and (b) retrieved acetone Brillouin scattering spectra, registered from acetone at 20°C (orange line), VIPA dispersion curve (blue line).
Fig. 6
Fig. 6
(a) Brillouin frequency shift value distribution for acetone at 20°C and (b) Brillouin line FWHM value distribution for acetone at 20°C. Orange bar plot represents number of values. Blue line represents Gaussian fit.
Fig. 7
Fig. 7
(a) Larynx sample cumulative Brillouin frequency shift value statistics and (b) Brillouin line FWHM statistics.
Fig. 8
Fig. 8
Brillouin frequency shift values overlapped on larynx sample images. (a)–(d) Samples I through IV, respectively. White bar shows a 15 mm scale.
Fig. 9
Fig. 9
Brillouin line FWHM values overlapped on larynx sample images. (a)–(d) Samples I through IV, respectively. White bar shows a 15 mm scale.

References

    1. Castelijns J. A., et al. , “Imaging of the larynx,” Neuroimaging Clin. N. Am. 6, 401–415 (1996).NCNAEO - PubMed
    1. Burks G., De Vita R., Leonessa A., “Characterization of the continuous elastic parameters of porcine vocal folds,” J. Voice 34, 1–8 (2020).JOVOEA10.1016/j.jvoice.2018.09.007 - DOI - PubMed
    1. Hirano M., “Morphological structure of the vocal cord as a vibrator and its variations,” Folia Phoniatr. 26, 89–94 (1974).10.1159/000263771 - DOI - PubMed
    1. Alipour F., Jaiswal S., Vigmostad S., “Vocal fold elasticity in the pig, sheep, and cow larynges,” J. Voice 25, 130–136 (2011).JOVOEA10.1016/j.jvoice.2009.09.002 - DOI - PMC - PubMed
    1. Garcia J. A., et al. , “Collagen content limits optical coherence tomography image depth in porcine vocal fold tissue,” Otolaryngol. Head Neck Surg. 155, 829–836 (2016).10.1177/0194599816658005 - DOI - PubMed

Publication types