Epidemiology of pediatric trauma and fractures during and beyond the COVID-19 pandemic
- PMID: 37560351
- PMCID: PMC10285363
- DOI: 10.1177/18632521231180161
Epidemiology of pediatric trauma and fractures during and beyond the COVID-19 pandemic
Abstract
Purpose: Previous literature has shown decreases in pediatric trauma during the COVID-19 outbreak, but few have analyzed beyond the peak of the pandemic. This study assesses the epidemiology of pediatric trauma cases in a high-volume teaching hospital in New York City before, during, and after the height of the COVID-19 pandemic.
Methods: Institutional data on pediatric trauma orthopedic cases from January 1, 2018 to November 30, 2021 were extracted. The following time frames were studied: (1) April 1-June 22 in 2018 and 2019 (pre-pandemic), (2) April 1-June 22, 2020 (peak pandemic), and (3) April 1-June 22, 2021 (post-peak pandemic). Inferential statistics were used to compare patient and trauma characteristics.
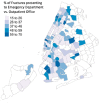
Results: Compared to the pre-pandemic cohort (n = 6770), the peak pandemic cohort (n = 828) had a greater proportion of fractures (p < 0.01) and had a significantly decreased overall traumas per week rate (p < 0.01) and fractures per week rate (p < 0.01). These decreased trauma (p < 0.01) and fracture rates (p < 0.01) persisted for the post-peak pandemic cohort (n = 2509). Spatial analysis identified zip code clusters throughout New York City with higher rates of emergency department presentation during the peak pandemic compared to pre-pandemic, and these areas aligned with lower-income neighborhoods.
Conclusion: During the peak of the pandemic, overall trauma and fracture volumes decreased, the types of prevalent injuries changed, and neighborhoods of different economic resources were variably impacted. These trends have mostly persisted for 12 months post-peak pandemic. This longitudinal analysis helps inform and improve long-term critical care and public health resource allocation for the future.
Level of evidence: Level III.
Keywords: COVID-19; geospatial analysis; healthcare utilization; pediatric fractures; pediatric orthopedic trauma.
© The Author(s) 2023.
Conflict of interest statement
The author(s) declared no potential conflicts of interest with respect to the research, authorship, and/or publication of this article.
Figures


References
-
- Bram JT, Johnson MA, Magee LC, et al.. Where have all the fractures gone? The epidemiology of pediatric fractures during the COVID-19 pandemic. J Pediatr Orthop 2020; 40(8): 373–379. - PubMed
-
- Charney SA, Camarata SM, Chern A. Potential impact of the COVID-19 pandemic on communication and language skills in children. Otolaryngol Head Neck Surg 2021; 165(1): 1–2. - PubMed
LinkOut - more resources
Full Text Sources
Research Materials
Miscellaneous

