. 2023 Aug 8;21(8):e08145.
doi: 10.2903/j.efsa.2023.8145. eCollection 2023 Aug.

Scientific opinion on the tolerable upper intake level for vitamin D, including the derivation of a conversion factor for calcidiol monohydrate

Scientific opinion on the tolerable upper intake level for vitamin D, including the derivation of a conversion factor for calcidiol monohydrate

EFSA Panel on Nutrition, Novel Foods and FoodAllergens (NDA) et al. EFSA J. .

Abstract

Following two requests from the European Commission (EC), the EFSA Panel on Nutrition, Novel Foods and Food Allergens (NDA) was asked to deliver a scientific opinion on the revision of the tolerable upper intake level (UL) for vitamin D and to propose a conversion factor (CF) for calcidiol monohydrate into vitamin D3 for labelling purposes. Vitamin D refers to ergocalciferol (vitamin D2), cholecalciferol (vitamin D3), and calcidiol monohydrate. Systematic reviews of the literature were conducted to assess the relative bioavailability of calcidiol monohydrate versus vitamin D3 on serum 25(OH)D concentrations, and for priority adverse health effects of excess vitamin D intake, namely persistent hypercalcaemia/hypercalciuria and endpoints related to musculoskeletal health (i.e. falls, bone fractures, bone mass/density and indices thereof). Based on the available evidence, the Panel proposes a CF for calcidiol monohydrates of 2.5 for labelling purposes. Persistent hypercalciuria, which may be an earlier sign of excess vitamin D than persistent hypercalcaemia, is selected as the critical endpoint on which to base the UL for vitamin D. A lowest-observed-adverse-effect-level (LOAEL) of 250 μg/day is identified from two randomised controlled trials in humans, to which an uncertainty factor of 2.5 is applied to account for the absence of a no-observed-adverse-effect-level (NOAEL). A UL of 100 μg vitamin D equivalents (VDE)/day is established for adults (including pregnant and lactating women) and for adolescents aged 11-17 years, as there is no reason to believe that adolescents in the phase of rapid bone formation and growth have a lower tolerance for vitamin D compared to adults. For children aged 1-10 years, a UL of 50 μg VDE/day is established by considering their smaller body size. Based on available intake data, European populations are unlikely to exceed the UL, except for regular users of food supplements containing high doses of vitamin D.

Keywords: Ergocalciferol; calcidiol monohydrate; cholecalciferol; conversion factor; tolerable upper intake level.


Figures

Figure 1
Figure 1
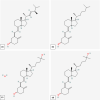
Chemistry of vitamin D Ergocalciferol (a), cholecalciferol (b), calcidiol monohydrate (c), and 25‐hydroxyvitamin D3 (d). Source: PubChem (CID 5280793, 5280795, 6441383 and 5283731)
Figure 2
Figure 2
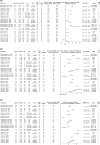
The effect of calcidiol monohydrate on serum 25(OH)D concentration compared to vitamin D3: (a) difference of means of achieved serum 25(OH)D concentration; (b) difference of means of achieved serum 25(OH)D concentration per μg/day of vitamin D; (c) ratio of means (ROM) of achieved serum 25(OH)D concentration per μg/day of vitamin D Duration of the intervention as reported by the authors. For age, recruitment target range is presented unless otherwise indicated. Achieved concentration refers to serum 25(OH)D concentration at the end of the treatment. Mean difference = mean serum 25(OH)D concentrations achieved with (a) calcidiol minus those achieved with vitamin D3, (b) per μg/day of vitamin D, and (c) ratio of means. Abbreviations: CI, confidence interval; CH, Switzerland; CLIA, chemiluminescence immune assay; D3, vitamin D3; ELISA, enzyme‐linked immunosorbent assay; ES, Spain; F, females; HPLC–MS/MS, high‐performance liquid chromatography tandem mass spectrometry; IE, Ireland; IT, Italy; LC–MS/MS, liquid chromatography tandem mass spectrometry; M, males; MD, mean difference; NL, Netherlands; NR, not reported; RoB, risk of bias; ROM = ratio of means; S‐25(OH)D, serum 25‐hydroxyvitamin D; UK, United Kingdom; UV, ultraviolet; US, United States; 25(OH)D3, 25‐hydroxyvitamin D3, i.e., calcidiol. *From hospital admission to 3 months after discharge.
Figure 3
Figure 3
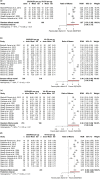
Relative bioavailability of calcidiol monohydrate [25(OH)D3] compared to vitamin D3: ratio of means achieved serum 25(OH)D concentration per μg/day of vitamin D administered Meta‐analysis was performed among: (a) RCTs using the same doses of calcidiol and vitamin D3; (b) all RCTs and intervention arms available; (c) excluding 3 RCTs at high RoB (tier 3); (d) excluding studies using doses ~60 μg/day vitamin D3 as control. ‘Mean’ and ‘SD’ refer to study means and standard deviations for the achieved S‐25(OH)D concentrations per μg/day of vitamin D, respectively. Abbreviations: CI, confidence interval; μg: micrograms; RCT, randomised controlled trial; ROM, ratio of means; SD, standard deviation; S‐25(OH)D, serum 25‐hydroxyvitamin D; Vit‐D3, vitamin D3; 25(OH)D3, 25‐hydroxyvitamin D3, i.e., calcidiol.
Figure 4
Figure 4
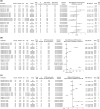
The effect of calcidiol monohydrate on serum PTH concentration compared to vitamin D3: (a) achieved serum PTH concentration; b) achieved PTH concentration per μg/day of vitamin D; (c) ratio of means (ROM) of achieved PTH concentration per μg/day of vitamin D Duration as reported by the authors. For age, recruitment target range is presented unless otherwise indicated. Outcome measure: end concentration refers to S‐PTH concentration at the end of the treatment; change from baseline concentration refers to difference between end concentration and baseline concentration [end concentration minus baseline concentration]. Mean difference = mean S‐PTH concentrations achieved with calcidiol minus those achieved with vitamin D3. Abbreviations: CI, confidence interval; CH, Switzerland; CLIA, chemiluminescence immune assay; D3, vitamin D3; EIA, enzyme immunoassay; ES, Spain; F, females; IE, Ireland; IT, Italy; M, males; MD, mean difference; NL, the Netherlands; RoB, risk of bias; S‐PTH, serum parathyroid hormone; UK, United Kingdom; 25(OH)D3, 25‐hydroxyvitamin D3, i.e., calcidiol. *From hospital admission to 7 months after discharge.
Figure 5
Figure 5
Distribution of vitamin D content in food supplements as displayed on labels in EU Member States and Norway (μg/serving) Source: Mintel GNPD. Search for vitamin D‐containing supplements available in the EU market in the last 5 years (from November 2017 to November 2022). A total of 2,150 products available in 24 EU Member States and Norway were identified, of which 2,098 contained complete data on μg/serving.
Figure 6
Figure 6
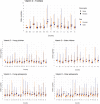
Mean, median, 5th and 95th percentiles of background vitamin D intakes in toddlers (≥ 1 year to < 3 years old), young children (≥ 3 years to < 7 years old), older children (≥ 7 years to < 10 years old), intakes in young adolescents (≥ 10 to < 14 years) and older adolescents (≥ 14 to < 18 years), by sex and country Estimates for females in orange and for males in blue. Squares correspond to medians and stars to means. Lines represent the range between the 5th and 95th percentiles. Estimated intakes from 5th and 95th percentiles are not presented when sample size is below 60 participants. Abbreviations: AT, Austria; BE, Belgium; BG, Bulgaria; CY, Cyprus; CZ, Czech Republic; DE, Germany; DK, Denmark; EE, Estonia; EL, Greece; ES, Spain; FI, Finland; FR, France; HU, Hungary; IT, Italy; LV, Latvia; NL, the Netherlands; PT, Portugal; RO, Romania; SE, Sweden; SI, Slovenia. *Country for which more than one survey was available; estimates presented in the plot are those of the most recent survey; when surveys covered the same period those, with the highest number of participants are displayed.
Figure 7
Figure 7
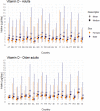
Mean, median, 5th and 95th percentiles of background vitamin D intakes in adults (≥ 18 years to < 65 years old) and older adults (≥ 65 years), by sex and country. Estimates for females in orange and for males in blue. Squares correspond to medians and stars to means. Lines represent the range between the 5th and 95th percentiles. Estimated intakes from 5th and 95th percentiles are not presented when sample size is below 60 participants. Abbreviations: AT, Austria; BE, Belgium; CY, Cyprus; CZ, Czech Republic; DE, Germany; DK, Denmark; EE, Estonia; EL, Greece; ES, Spain; FI, Finland; FR, France; HR, Croatia; HU, Hungary; IE, Ireland; IT, Italy; LV, Latvia; NL, the Netherlands; PT, Portugal; RO, Romania; SE, Sweden; SI, Slovenia. *Country for which more than one survey was available; estimates presented in the plot are those of the most recent survey; when surveys covered the same period those with the highest number of participants are displayed.
Figure 8
Figure 8
Mean, median, 5th and 95th percentiles of background vitamin D intakes in pregnant and lactating women, by country Squares correspond to medians and stars to means. Lines represent the range between the 5th and 95th percentiles. Estimated intakes from 5th and 95th percentiles are not presented when sample size is below 60 participants. Abbreviations: EE, Estonia; EL, Greece.
Figure 9
Figure 9
The effect of high doses of vitamin D on the odds of developing persistent hypercalcaemia in children and adolescents For age, recruitment target range is presented. Mean baseline S‐25(OH)D concentrations were classified as follows: < 25 nmol/L, 25–49 nmol/L, 50–74 nmol/L, ≥ 75 nmol/L. ‘Cases’ indicates the number of participants who developed hypercalcaemia. All effect sizes were estimated because pre‐calculated effect sizes were not available. Abbreviations: BMI, body mass index; F, females; IQR, inter quartile range; IR, Iran; LB, Lebanon; LK, Sri Lanka; M, males; S‐25(OH)D, serum 25‐hydroxyvitamin D; S‐Ca, serum calcium; OR, odds ratio; RoB, risk of bias; US, United States.
Figure 10
Figure 10
The effect of high doses of vitamin D on the odds of developing persistent (a) hypercalcaemia or (b) hypercalciuria in pregnant and lactating women For age, recruitment target range is presented. Mean baseline S‐25(OH)D concentrations were classified as follows: < 25 nmol/L, 25–49 nmol/L, 50–74 nmol/L, ≥ 75 nmol/L. ‘Cases’ indicates the number of participants who developed hypercalcaemia or hypercalciuria. ‘Ca’ indicates whether calcium was provided as a co‐intervention. Abbreviations: BD, Bangladesh; BMI, body mass index; MDIG, Maternal Vitamin D for Infant Growth; MN, Mongolia; NR, not reported; OR, odds ratio; RoB, risk of bias; S‐25(OH)D, serum 25‐hydroxyvitamin D; S‐Ca, serum calcium; U‐Ca, urinary calcium; US, United States. Note: In the RCT of Hollis and Wagner (2004), 100 μg/day of vitamin D (90 μg/day of vitamin D2 + 10 μg/day of vitamin D3) was compared with 50 μg/day of vitamin D (40 μg/day of vitamin D2 + 10 μg/day of vitamin D3). Effect sizes for Roth et al., (2018) were estimated because pre‐calculated effect sizes were not available.
Figure 11
Figure 11
The effect of high doses of vitamin D on the odds of developing persistent hypercalcaemia among general adult populations treated with vitamin D for (a) 8–26 weeks and (b) 1 year or more For age, recruitment target range is presented. Mean baseline S‐25(OH)D concentrations were classified as follows: < 25 nmol/L, 25–49 nmol/L, 50–74 nmol/L, ≥ 75 nmol/L. ‘Cases’ indicates the number of participants who developed hypercalcaemia. ‘Ca’ indicates whether calcium was provided as a co‐intervention. ‘Note’ indicate the effect size included in the forest plot. Pre‐calculated effect sizes were used if available without performing conversions; please note that effect sizes can be therefore different from the one expressed in the plot title. ‘Note2’ provides further information on the outcome. ‘Recurrent’ refers to the number of participants who demonstrated elevated S‐Ca at least at two measurement points after baseline. The zero cases refer to no occurrence of hypercalcaemia or to transient hypercalcaemia. Abbreviations: AR, Argentina; AU, Australia; BEST‐D: Biochemical Efficacy and Safety Trial of vitamin D; CA, Canada; CI, confidence interval; D2d: the Vitamin D and Type 2 Diabetes; DK, Denmark; F, females; M, males; NO, Norway; NR, not reported; S‐25(OH)D, serum 25‐hydroxyvitamin D; S‐Ca, serum calcium; SE, Sweden; OR, odds ratio; RoB, risk of bias; UK, United Kingdom; US, United States; ViDOS, Vitamin D supplementation in Older Women. Note: Aloia et al. (2013) used a 2 × 2 factorial design, but the results are shown for the groups with vitamin D and without vitamin D. *The effect size was computed based on case numbers because pre‐calculated effect sizes were not available; **Two study sites applied different cut‐off points.
Figure 12
Figure 12
The effect of high doses of vitamin D on the odds of developing persistent hypercalciuria among general adult populations For age, recruitment target range is presented. Mean baseline S‐25(OH)D concentrations were classified as follows: < 25 nmol/L, 25–49 nmol/L, 50–74 nmol/L, ≥ 75 nmol/L. ‘Cases’ indicates the number of participants who developed hypercalciuria. ‘Ca’ indicates whether calcium was provided as a co‐intervention. ‘Note’ indicates the effect size included in the forest plot. Pre‐calculated effect sizes were used if available, without performing conversions; please note that effect sizes can be therefore different from the one expressed in the plot title. ‘Note2’ provides further information on the outcome. ‘Recurrent’ refers to the number of participants who demonstrated elevated U‐Ca at least at two measurement points after baseline. The zero cases refer to no occurrence of hypercalciuria or to transient hypercalciuria. Abbreviations: AR, Argentina; CA, Canada; Ca, calcium; CI, confidence interval; F, females; IRR, incidence rate ratio; M, males; NR, not reported; OR, odds ratio; Rob, risk of bias; S‐25(OH)D, serum 25‐hydroxyvitamin D; U‐Ca, urinary calcium; U‐Ca/Cr, urinary calcium/creatinine ratio; US, United States. Note: Recurrent hypercalciuria cases for Gallagher et al. (2012, 2014b) were received from prof. Gallagher (personal communication).
*The effect size was computed based on case numbers because pre‐calculated effect sizes were not available.
Figure 13
Figure 13
The effect of vitamin D2 or vitamin D3 supplementation on the odds of sustaining at least one fracture For age, recruitment target range is presented, unless otherwise stated. Mean baseline S‐25(OH)D concentrations were classified as follows, unless otherwise stated: < 25 nmol/L, 25–49 nmol/L, 50–74 nmol/L, ≥ 75 nmol/L. ‘Cases’ indicates the number of participants who sustained at least one fracture during the intervention period. ‘Note’ indicates the effect size included in the forest plot. Pre‐calculated effect sizes were used if available without performing conversions; please note that effect sizes can be therefore different from the one expressed in the plot title. Abbreviations: AU, Australia; BEST‐D: Biochemical Efficacy and Safety Trial of vitamin D; CA, Canada; Ca, calcium; CI, confidence interval; F, females; HR: hazard ratio; M, males; OR, odds ratio; RECORD: Randomised Evaluation of Calcium Or vitamin D; RoB: risk of bias; S‐25(OH)D; serum 25‐hydroxyvitamin D; UK, United Kingdom. Note: Burt et al. (2019) provided calcium supplementation to participants with dietary intake of less than 1,200 mg per day. Flicker et al. (2005) started with a vitamin D dose of 36 μg/day [= 250 μg/week], but due to the discontinuation of the preparation of commercial 250 μg‐tablets during the intervention, they switched to 25 μg‐tablets. Hin et al. (2016) combined the results of the groups treated with 50 μg and 100 μg of vitamin D3 . *Effect size was computed based on the reported case numbers because pre‐calculated effect sizes were not available.
Figure 14
Figure 14
The effect of vitamin D supplements on the odds of falling at least once or twice. For age, recruitment target range is presented, unless otherwise stated. Mean baseline S‐25(OH)D concentrations were classified as follows, unless otherwise stated: < 25 nmol/L, 25–49 nmol/L, 50–74 nmol/L, ≥ 75 nmol/L. ‘Fallers’ indicate the number of participants who encountered one fracture or more. ‘Note’ indicates the effect size included in the forest plot. Pre‐calculated effect sizes were used if available without performing conversions; please note that effect sizes can be therefore different from the one expressed in the plot title. ‘Note2’ indicates the adjusted effect size, if reported in the publication, or further information on the outcome. Abbreviations: AT, Austria; AU, Australia; aOR, adjusted odds ratio; BEST‐D: Biochemical Efficacy and Safety Trial of vitamin D; CA, Canada; CH, Switzerland; CI, confidence interval; DE, Germany; DEX; Vitamin D and Exercise in Falls Prevention; DO‐HEALTH: Vitamin D3 ‐ Omega3 ‐ Home Exercise ‐ Healthy Aging and Longevity Trial; EX, exercise program; F, females; FA, fatty acids; FI, Finland; FR, France; HR, hazard ratio; M, males; NR, not reported; OR, odds ratio; PT, Portugal; RECORD, Randomised Evaluation of Calcium Or vitamin D; RoB, risk of bias; S‐25(OH)D, serum 25‐hydroxyvitamin D; STURDY, Study to Understand Fall Reduction and Vitamin D in You; UK, United Kingdom; US, United States; ViDOS, Vitamin D supplementation in Older Women. Note: Flicker et al. (2005) started with 250 μg/week [= 36 μg/day], but due to the discontinuation of the preparation of commercial 250 μg‐tablets during the intervention, they switched to 25 μg‐tablets. Hin et al. (2016) and Smith et al. (2017) combined the results of the groups treated with higher vitamin D3 doses. Uusi‐Rasi et al. (2015) did not report raw data, i.e., the number of fallers. Bischoff‐Ferrari et al. (2022) adjusted for study site, sex, age, previous fall, baseline BMI, and baseline use of walking aids. Prince et al. (2008) adjusted for baseline height as difference was observed between groups. *Effect size was computed based on the reported case numbers because pre‐calculated effect sizes were not available.
Figure 15
Figure 15
The effect of high doses of vitamin D3 supplements on the areal BMD at the (a) lumbar spine, (b) femoral neck and (c) total hip among general adult populations For age, recruitment target range is presented. Mean baseline S‐25(OH)D concentrations were classified as follows, unless otherwise stated: < 25 nmol/L, 25–49 nmol/L, 50–74 nmol/L, ≥ 75 nmol/L. ‘BMD Result/Change’ indicates the results/changes reported in the publications. ‘Ca’ indicates whether calcium was provided as a co‐intervention. Effect size was standardised mean difference because the outcome metrics were different, except for plot (b) where the effect size was standardised mean difference because all studies reported %‐changes from baseline. Abbreviations: BMD, bone mineral density; CA, Canada; CI, confidence interval; F, females; M, males; MD, mean difference; NO, Norway; LB, Lebanon; RoB: risk of bias; SMD, standardised mean difference; S‐25(OH)D; serum 25‐hydroxyvitamin D; US, United States; ViDOS; Vitamin D supplementation in Older Women. Note: In Rahme et al. (2017), the analysed test dose was close to 100 μg/day, which is why it was decided to include the study in the evidence synthesis.
Figure A.1
Figure A.1
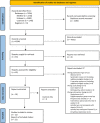
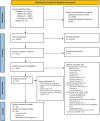
Flow chart for the selection of studies on bioavailability of calcidiol and vitamin D3
Figure A.2
Figure A.2
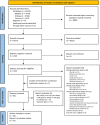
Flow chart for the selection of studies on hypercalcaemia and hypercalciuria
Figure A.3
Figure A.3
Flow chart for the selection of studies on bone fractures, falls, BMD/BMC, and bone strength
Figure F.1
Figure F.1
Scatter plot of the Ratio of Means (RoM) versus the achieved 25(OH)D per unit dose (nmol/L) of the comparator (vitamin D3) Legend to Figure F.1: the colours represent studies; the shape indicates the dose of the control group (dot = 20 μg/d, triangle = 25 μg/d, square = 60 μg/d, cross = 62.5 μg/d); the size of the points is proportional to the sample size of the control group (vitamin D3).
Figure F.2
Figure F.2
Funnel plot of the 16 arms from the 10 eligible studies

Similar articles

  • Scientific and technical assistance to the evaluation of the safety of calcidiol monohydrate as a novel food.
    European Food Safety Authority (EFSA); Turck D, McArdle HJ, Naska A, Neuhäuser-Berthold M, Passeri G, Craciun I, Roldán-Torres R, Valtueña Martínez S. European Food Safety Authority (EFSA), et al. EFSA J. 2024 Jan 25;22(1):e8520. doi: 10.2903/j.efsa.2024.8520. eCollection 2024 Jan. EFSA J. 2024. PMID: 38273990 Free PMC article.
  • Safety of calcidiol monohydrate produced by chemical synthesis as a novel food pursuant to Regulation (EU) 2015/2283.
    EFSA Panel on Nutrition, Novel Foods and Food Allergens (NDA); Turck D, Castenmiller J, De Henauw S, Hirsch-Ernst KI, Kearney J, Maciuk A, Mangelsdorf I, McArdle HJ, Naska A, Peláez C, Pentieva K, Siani A, Thies F, Tsabouri S, Vinceti M, Cubadda F, Frenzel T, Heinonen M, Marchelli R, Neuhauser-Berthold M, Poulsen M, Maradona MP, Schlatter JR, van Loveren H, Dumas C, Roldán-Torres R, Steinkellner H, Knutsen HK. EFSA Panel on Nutrition, Novel Foods and Food Allergens (NDA), et al. EFSA J. 2021 Jul 1;19(7):e06660. doi: 10.2903/j.efsa.2021.6660. eCollection 2021 Jul. EFSA J. 2021. PMID: 34249156 Free PMC article.
  • Scientific opinion on the tolerable upper intake level for preformed vitamin A and β-carotene.
    EFSA Panel on Nutrition, Novel Foods and Food Allergens (NDA); Turck D, Bohn T, Castenmiller J, de Henauw S, Hirsch-Ernst KI, Knutsen HK, Maciuk A, Mangelsdorf I, McArdle HJ, Pentieva K, Siani A, Thies F, Tsabouri S, Vinceti M, Lietz G, Passeri G, Craciun I, Fabiani L, Horvath Z, Valtueña Martínez S, Naska A. EFSA Panel on Nutrition, Novel Foods and Food Allergens (NDA), et al. EFSA J. 2024 Jun 6;22(6):e8814. doi: 10.2903/j.efsa.2024.8814. eCollection 2024 Jun. EFSA J. 2024. PMID: 38846679 Free PMC article.
  • Dietary glycation compounds - implications for human health.
    Hellwig M, Diel P, Eisenbrand G, Grune T, Guth S, Henle T, Humpf HU, Joost HG, Marko D, Raupbach J, Roth A, Vieths S, Mally A. Hellwig M, et al. Crit Rev Toxicol. 2024 Sep;54(8):485-617. doi: 10.1080/10408444.2024.2362985. Epub 2024 Aug 16. Crit Rev Toxicol. 2024. PMID: 39150724
  • Calcidiol [25(OH)D3]: from diagnostic marker to therapeutical agent.
    Brandi ML, Minisola S. Brandi ML, et al. Curr Med Res Opin. 2013 Nov;29(11):1565-72. doi: 10.1185/03007995.2013.838549. Epub 2013 Sep 13. Curr Med Res Opin. 2013. PMID: 24020910 Review.

Cited by

References

    1. Ahn J, Yu K, Stolzenberg‐Solomon R, Simon KC, McCullough ML, Gallicchio L, Jacobs EJ, Ascherio A, Helzlsouer K, Jacobs KB, Li Q, Weinstein SJ, Purdue M, Virtamo J, Horst R, Wheeler W, Chanock S, Hunter DJ, Hayes RB, Kraft P and Albanes D, 2010. Genome‐wide association study of circulating vitamin D levels. Human Molecular Genetics, 19, 2739–2745. 10.1093/hmg/ddq155 - DOI - PMC - PubMed
    1. Akaike H, 1974. A new look at the statistical model identification. IEEE Transactions on Automatic Control, 19, 716–723.
    1. Aloia JF, Talwar SA, Pollack S and Yeh J, 2005. A randomized controlled trial of vitamin D3 supplementation in African American women. Archives of Internal Medicine, 165, 1618–1623. 10.1001/archinte.165.14.1618 - DOI - PMC - PubMed
    1. Aloia JF, Dhaliwal R, Shieh A, Mikhail M, Islam S and Yeh JK, 2013. Calcium and vitamin d supplementation in postmenopausal women. Journal of Clinical Endocrinology and Metabolism, 98, E1702–E1709. - PubMed
    1. Aloia J, Dhaliwal R, Mikhail M, Shieh A, Stolberg A, Ragolia L, Fazzari M and Abrams SA, 2015. Free 25(OH)D and Calcium Absorption, PTH, and Markers of Bone Turnover. The Journal of Clinical Endocrinology and Metabolism, 100, 4140–4145. 10.1210/jc.2015-2548 - DOI - PMC - PubMed

LinkOut - more resources