

Robust design of a logistics system using FePIA procedure and analysis of trade-offs between CO2 emissions and net present value
- PMID: 37560647
- PMCID: PMC10407056
- DOI: 10.1016/j.heliyon.2023.e18444
Robust design of a logistics system using FePIA procedure and analysis of trade-offs between CO2 emissions and net present value
Abstract
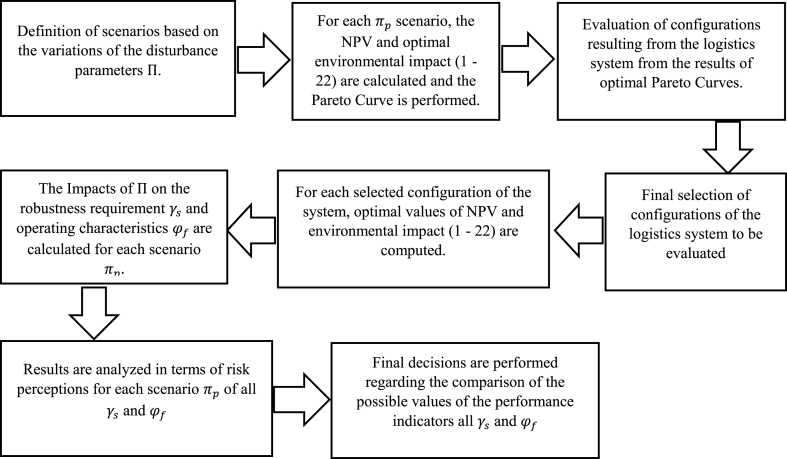
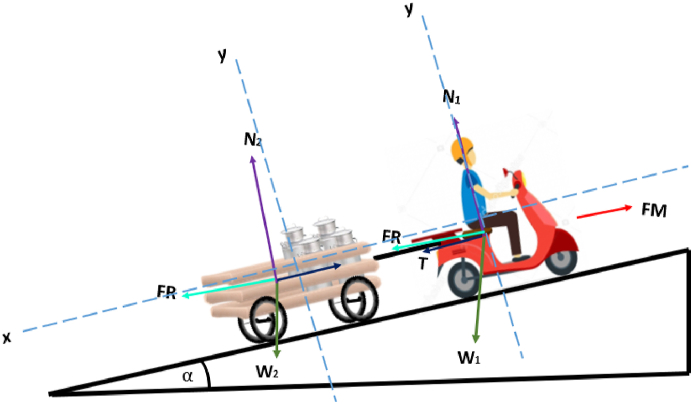
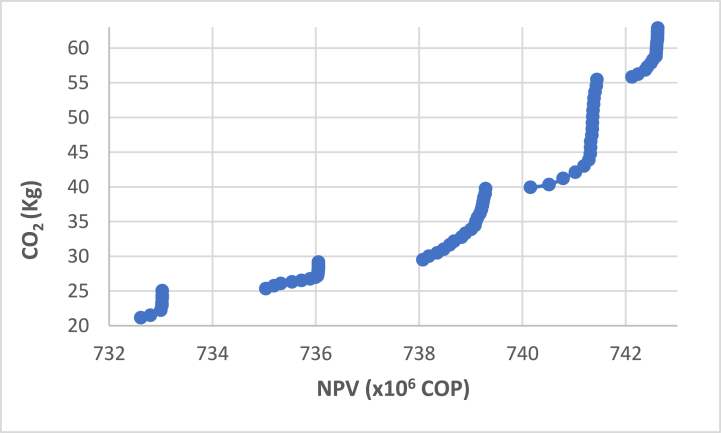
The problems of flexible planning of the design of logistics systems for the collection of food products such as raw milk can result in a decrease in the performance of critical indicators for their performance. This paper proposes a new efficient methodology for robustly designing a first-mile logistics system for storing and refrigerating milk as a perishable product considering decisions related to open facilities and the flow of products, including sustainability indices. The proposed approach is modeled as a bi-objective problem by considering the minimization of greenhouse gas emissions (CO2) produced by milk transportation canteens and the maximization of the system configuration's net present value (NPV). We have analyzed and determined the most robust configuration for the first time and explained the robustness-NPV and robustness-CO2 relationships. The proposed mathematical model is solved by the Epsilon constraints method, and the robustness is calculated considering an extension of the FePIA methodology for multiobjective problems. A novel contribution is a balance in the possible future values generated by the company related to its cash flows and the generation of CO2 emissions when using a motorized transport frequently used in the shipment of raw milk considering a new important aspect such as the volume of product transported and the slope of the path between the production farm and the storage cooling tanks.
Keywords: Decision support system (DSS); FePIA; Supply chain; Sustainability.
© 2023 The Authors.
Conflict of interest statement
The authors declare that they have no known competing financial interests or personal relationships that could have appeared to influence the work reported in this paper.
Figures


References
-
- Janssen E., Swinnen J. Technology adoption and value chains in developing countries: evidence from dairy in India. Food Pol. 2019;83:327–336. doi: 10.1016/j.foodpol.2017.08.005. - DOI
-
- Kuijpers R., Swinnen J. Value chains and technology transfer to agriculture in developing and emerging economies. Am. J. Agric. Econ. 2016;98(5):1403–1418. doi: 10.1093/ajae/aaw069. - DOI
-
- Ledo J., Hettinga K.A., Bijman J., Luning P.A. Persistent challenges in safety and hygiene control practices in emerging dairy chains: the case of Tanzania. Food Control. 2019;105:164–173. doi: 10.1016/j.foodcont.2019.05.011. - DOI
-
- Ding H., Fu Y., Zheng L., Yan Z. Determinants of the competitive advantage of dairy supply chains: evidence from the Chinese dairy industry. Int. J. Prod. Econ. 2019;209(October):360–373. doi: 10.1016/j.ijpe.2018.02.013. - DOI
-
- Statista . 2023. Global Dairy Industry - Statistics & Facts.https://www.statista.com/topics/4649/dairy-industry
LinkOut - more resources
Full Text Sources
