. 2023 Sep 15;133(18):e163266.
doi: 10.1172/JCI163266.

Nucleus accumbens D1/D2 circuits control opioid withdrawal symptoms in mice

Affiliations

Nucleus accumbens D1/D2 circuits control opioid withdrawal symptoms in mice

Yongsheng Zhu et al. J Clin Invest. .

Abstract

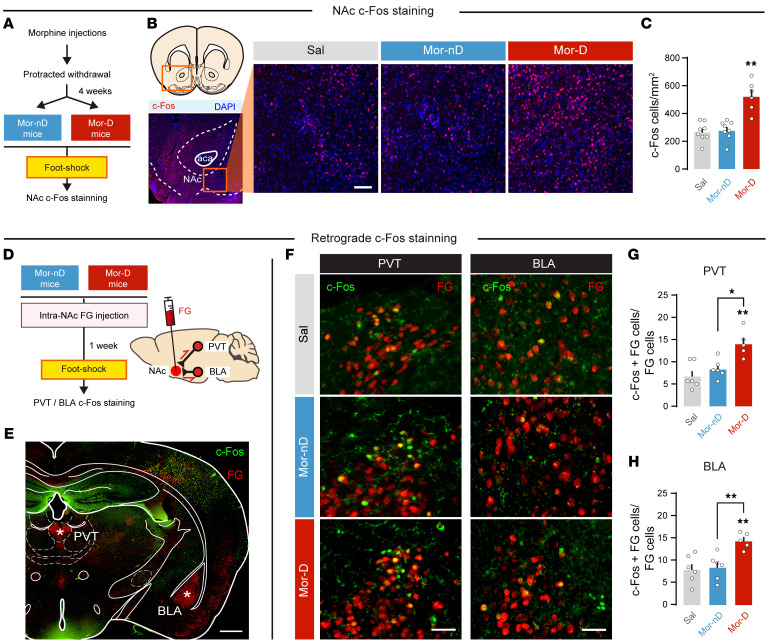
The nucleus accumbens (NAc) is the most promising target for drug use disorder treatment. Deep brain stimulation (DBS) of NAc is effective for drug use disorder treatment. However, the mechanisms by which DBS produces its therapeutic effects remain enigmatic. Here, we define a behavioral cutoff criterion to distinguish depressive-like behaviors and non-depressive-like behaviors in mice after morphine withdrawal. We identified a basolateral amygdala (BLA) to NAc D1 medium spiny neuron (MSN) pathway that controls depressive-like behaviors after morphine withdrawal. Furthermore, the paraventricular nucleus of thalamus (PVT) to NAc D2 MSN pathway controls naloxone-induced acute withdrawal symptoms. Optogenetically induced long-term potentiation with κ-opioid receptor (KOR) antagonism enhanced BLA to NAc D1 MSN signaling and also altered the excitation/inhibition balance of NAc D2 MSN signaling. We also verified that a new 50 Hz DBS protocol reversed morphine withdrawal-evoked abnormal plasticity in NAc. Importantly, this refined DBS treatment effectively alleviated naloxone-induced withdrawal symptoms and depressive-like behaviors and prevented stress-induced reinstatement. Taken together, the results demonstrated that input- and cell type-specific synaptic plasticity underlies morphine withdrawal, which may lead to novel targets for the treatment of opioid use disorder.

Keywords: Addiction; Depression; Mouse models; Neuroscience.


Figures

Figure 1
Figure 1. Mice treated repeatedly with morphine show depressive-like behaviors during a protracted withdrawal period.
(A) Withdrawal score within 4 weeks of drug withdrawal in heroin users. n = 576 per group. ***P < 0.0001, by repeated-measures (RM) 1-way ANOVA followed by Šidák’s test. (B) Depressive ratio of heroin users. (C) Flowchart of withdrawal symptoms and behavioral tests. (D) Withdrawal symptoms. n = 30 per group. ***P < 0.0001, by Mann-Whitney U test. (E) Depressive-like behaviors appeared 4 weeks after morphine withdrawal. n = 62 saline (Sal) mice, and n = 131 morphine (Mor) mice. **P < 0.01, ***P < 0.0001, by mixed RM 2-way ANOVA followed by Šidák’s test. (F and G) Correlation analysis between SPT sucrose preference, TST immobility time, and FST immobility time in Mor group and Sal group. *P < 0.05, **P < 0.01, by Pearson’s correlation test. Data are presented as mean ± SEM.
Figure 2
Figure 2. A subpopulation of morphine withdrawal mice with depressive-like phenotypes are vulnerable to stress-induced CPP reinstatement.
(A) Three-dimensional plot showing the variability in depressive-like behaviors of SPT, TST, and FST. (B) ROC algorithm to establish cutoff criteria based on SPT, TST, and FST. Orange line, cutoff value based on the maximum Youden index. AUC, area under the curve (0–1). n = 62 Sal, and n = 131 Mor. ***P < 0.0001, by unpaired Student’s t test. (C and D) Bimodal distribution of depression scores. Sal and Mor mice were considered positive for behavioral criteria 0 to 3 according to the cutoff value (orange line). (E) Separation of groups according to depression score. Mor mice that met all 3 positive criteria (D-3) were classified as the depressive-like phenotype (Mor-D). Mor mice with a D-0 or D-1 were classified as the non-depressive-like phenotype (Mor-nD). The Sal group only included mice with D-0 or D-1. (F) Correlation analysis between SPT sucrose preference, TST immobility time, and FST immobility time in Mor-nD and Mor-D group. *P < 0.05, **P < 0.01, by Pearson’s correlation test. (G) Flowchart of the CPP reinstatement test. (H) Left: Example traces of morphine CPP tests. The red chamber indicates the morphine-paired chamber. Right: CPP scores in pretest, post-test, and extinction test. (I) CPP reinstatement test. Left: CPP score before and after foot shock in different groups. n = 8 Sal, n = 21 Mor-nD, and n = 9 Mor-D. **P < 0.01, by mixed RM 2-way ANOVA followed by Šidák’s test. Right: A priming dose of morphine evoked CPP reinstatement in different groups. ***P < 0.0001, by 1-way ANOVA followed by Tukey’s test. Data are presented as mean ± SEM.
Figure 3
Figure 3. The BLA and PVT afferents to NAc are activated in mice with depressive-like behaviors after morphine withdrawal (Mor-D).
(A) Flowchart of NAc c-Fos staining. (B) Representative NAc c-Fos immunostaining photos. Scale bar: 200 μm. (C) Total c-Fos–positive cells in NAc. Four slices per mouse, n = 6–8 per group. **P < 0.01, by 1-way ANOVA followed by Šidák’s test. (D) Flowchart of retrograde tracer Fluorogold (FG) injection and c-Fos staining in PVT or BLA. (E) Representative photo of c-Fos and FG staining in PVT and BLA. Scale bar: 0.5 mm. (F) Representative co-immunostaining photos for c-Fos and FG. Scale bars: 100 μm. (G and H) Active c-Fos cells (c-Fos+FG to total FG cells) in PVT and BLA. Four slices per mouse, n = 5–6 per group. *P < 0.05, **P < 0.01, by 1-way ANOVA followed by Šidák’s test. Data are presented as mean ± SEM.
Figure 4
Figure 4. Mor-D mice show increased PVT→NAcD2 and decreased BLA→NAcD1 synaptic efficiency.
(A) Schematic of the in vivo recording of NAc D1/D2 MSNs. D1-tdTomato×D2-eGFP double transgenic mice were used to identify NAc D1/D2 MSNs. Scale bar: 100 μm. (B and C) Sample of optically evoked EPSC traces of NAc D1 MSNs and D2 MSNs from PVT or BLA inputs. The A/N ratio is shown in NAc D1 MSNs and D2 MSNs. n = 16–20 neurons from 4–5 animals per group. *P < 0.05, **P < 0.01, by 1-way ANOVA followed by Tukey’s test. (D) Flowchart of the classical high-frequency DBS treatment in bilateral NAc (130 Hz, 1 h/d for 5 days). (E) Depressive-like behaviors in mice treated with or without 130 Hz DBS. n = 16 per group Mor-nD, and n = 6 per group Mor-D. *P < 0.05, **P < 0.01, by mixed RM 2-way ANOVA followed by Šidák’s test. (F) Foot shock–induced CPP reinstatement. (G) A/N ratio in NAc of Mor-D mice. n = 18–22 neurons from 4–6 animals per group. ***P < 0.0001, by unpaired Student’s t test. Data are presented as mean ± SEM.
Figure 5
Figure 5. The PVT→NAcD2 pathway modulates aversive withdrawal symptoms in Mor mice.
(A) Ex vivo oLFS-induced LTD in PVT→NAc D2 MSNs. The ChR2-expressing PVT→NAc pathway was stimulated by 1 Hz of oLFS to induce LTD. (B) Image of ChR2 expression in PVT terminals of D2-eGFP mice. Scale bar: 100 μm. (C) Normalized EPSC. oLFS induced a long-lasting reduction in EPSC in NAc D2 MSNs (n = 16 neurons from 4 mice) but not D1 MSNs (n = 9 neurons from 3 mice). ***P < 0.0001, by unpaired Student’s t test. (D) In vivo optogenetic depotentiation of PVT→NAcD2 pathway. Mice were implanted with optical fibers in dorsal to bilateral NAc and subjected to morphine treatment plus daily 1 Hz photo-stimulation for 15 minutes. (E) Naloxone-induced withdrawal symptoms in mice. n = 12–30 per group. ***P < 0.0001, by 2-way ANOVA followed by Šidák’s test. (F) Flowchart of CPP reinstatement test. Mor-D of D2-eGFP mice was subjected to daily 1 Hz photo-stimulations to induce oLFS in PVT→NAcD2 pathway. (G) Foot shock–induced CPP reinstatement. n = 6 per group. ***P < 0.0001, by mixed RM 2-way ANOVA followed by Šidák’s test. Data represent mean ± SEM.
Figure 6
Figure 6. The KOR on BLA→NAc pathway is essential for Mor-D mice.
(A) Photos of in situ hybridization of KOR mRNA and Fluorogold (FG) in BLA and PVT. fr, fasciculus retroflexus. Scale bars: 50 μm. (B) Mean KOR mRNA intensity in BLA and PVT. n = 5 per group. *P < 0.05, by 1-way ANOVA followed by Tukey’s test. (C) Percentage of KOR mRNA plus FG double-labeled cells in BLA and PVT. n = 5–6 per group. **P < 0.01, by 1-way ANOVA followed by Tukey’s test. (D) Flowchart of behavioral tests after norBNI infusion. The KOR antagonist norBNI (5 μg/μL, 0.5 μL/side) was infused bilaterally into NAc or BLA of Mor-D mice 24 hours before behavioral tests. (E) Depressive-like behaviors in norBNI-treated mice. n = 7–10 per group. *P < 0.05, **P < 0.01, by unpaired Student’s t test. (F) Foot shock–induced CPP reinstatement. n = 8–10 per group. ***P < 0.0001, by mixed RM 2-way ANOVA followed by Šidák’s test. (G) Conditional KOR knockdown on BLA→NAc pathway. Scale bars: 100 μm. (H) Depressive-like behaviors in the wild-type (WT) or conditional-KOR-knockdown (cKO) mice. n = 10–12 per group. *P < 0.05, **P < 0.01, by unpaired Student’s t test. (I) Foot shock–induced CPP reinstatement in the WT or cKO mice. n = 9 per group. **P < 0.01, ***P < 0.0001, by mixed RM 2-way ANOVA followed by Šidák’s test. Data are presented as mean ± SEM.
Figure 7
Figure 7. BLA→NAcD1 pathway bidirectionally modulates depressive-like behavior and stress-induced CPP reinstatement.
(A) Dual-channel ex vivo optogenetic LTP protocol in D1-Cre mice. Chronos and ChrimsonR were activated by 405 nm and 590 nm light, respectively. Scale bar: 100 μm. (B) Optogenetic high-frequency stimulation (oHFS; 405 nm, 50 Hz, 100 pulses, repeated 4 times with a 20-second interval) combined with optogenetic postsynaptic depression (oPSD; 2 seconds, 590 nm) induced a long-lasting elevation of EPSC in BLA→NAcD1 pathway. n = 15 neurons from 3 animals. ***P < 0.0001, by unpaired Student’s t test. Scale bars: 50 ms and 50 pA. (C) oHFS + oPSD + U69 or oHFS + oPSD + norBNI induced a long-lasting increase in EPSC in BLA→NAcD1 pathway. n = 15–22 neurons in 3–6 animals per group. ***P < 0.0001, by 1-way ANOVA followed by Tukey’s test. (D) Flowchart of the dual-channel in vivo optogenetic LTP protocol. Chronos and ChrimsonR were expressed in BLA→NAcD1 afferents of Mor-D mice. (E) Depressive-like behaviors in D1-oLTP treatment. n = 6 per group. *P < 0.05, ***P < 0.0001, by 2-way ANOVA followed by Šidák’s test. (F) Foot shock–induced CPP reinstatement. n = 6 per group. **P < 0.01, by 2-way ANOVA followed by Šidák’s test. (G) Schematic of the in vivo chemogenetic inhibition protocol. hM4Di was expressed in BLA→NAc afferents of Mor-nD mice. CNO was administered before foot shock. (H) Depressive-like behaviors after CNO administration. n = 12 per group. **P < 0.01, ***P < 0.0001, by unpaired Student’s t test. (I) Foot shock–induced CPP reinstatement. n = 12 per group. *P < 0.05, by unpaired Student’s t test. Data are presented as mean ± SEM.
Figure 8
Figure 8. Refined DBS increases the A/N ratio in NAc D1 MSNs.
(A) Schematic for excitation/inhibition (E/I) balance of NAc D2 MSNs. After induction of oLTP in BLA→NAc D1 MSNs with or without norBNI treatment, presumptive NAc D2 MSNs (MSNs without fluorescence) were recorded for EPSC and IPSC. (B) The LTP+norBNI group showed a lower E/I ratio. n = 14–15 neurons in 5 animals per treatment group. ***P < 0.0001, by unpaired Student’s t test. Scale bar: 50 ms, 50 pA. (C) Schematic of the in vivo DBS-induced LTP protocol in Mor-D mice. The refined in vivo DBS protocol includes 50 Hz DBS, D1 agonist (SKF38393), and norBNI treatment. NAc D1 MSNs (MSNs with red fluorescence) were recorded for EPSC of AMPAR and NMDAR. (D and E) The A/N ratio in NAc D1 MSNs (D) and D2 MSNs (E). Left: Example EPSC traces. Right: A/N ratio of NAc D1 MSNs. Scale bars: 50 ms, 100 pA. (F) The E/I balance in D2 MSNs. Left: Example IPSC traces. Right: E/I ratio of NAc D2 MSNs. n = 12–15 neurons in 5 animals per treatment group. Scale bar: 50 ms, 50 pA. **P < 0.01, ***P < 0.0001, by unpaired Student’s t test. Data are presented as mean ± SEM.
Figure 9
Figure 9. Refined DBS treatment improves depressive-like behaviors and inhibits stress-induced CPP reinstatement in Mor-D mice.
(A) Flowchart and schematic of the refined DBS treatment. Mor-D mice were implanted with bilateral NAc electrodes and treated with norBNI + SKF + DBS for 5 days. (B) Depressive-like behaviors before and after refined DBS treatment. n = 12–13 per group. *P < 0.05, **P < 0.01, ***P < 0.0001, by mixed 2-way ANOVA followed by Šidák’s test. (C) Novelty-suppressed feeding (NSF) test. n = 6–8 per group. **P < 0.01, by mixed 2-way ANOVA followed by Šidák’s test. (D) Flowchart of CPP reinstatement and memory tests. (E) Foot shock– or morphine-induced CPP reinstatement. n = 7–12 per group. **P < 0.01, ***P < 0.0001, by mixed 2-way ANOVA followed by Šidák’s test. (F) Immunostaining of NAc c-Fos following the CPP reinstatement test. Scale bar: 200 μm. Four slices per mouse, n = 6–8 per group. *P < 0.05, **P < 0.01, by mixed 1-way ANOVA followed by Tukey’s test. (G) Contextual freezing time in different memory stages. n = 10–12 per group. Data were analyzed by 1-way ANOVA. (H) Discrimination index in different memory stages. Left: Schematic for the novel object recognition test. Right: Discrimination index. n = 10–12 per group. Data were analyzed by 1-way ANOVA. Data are presented as mean ± SEM.
Figure 10
Figure 10. Refined DBS treatment in male and female mice.
(A) Schematic and flowchart of refined DBS treatment in male and female mice. (B) Naloxone-induced withdrawal symptoms in male and female mice following refined DBS treatment. n = 10 per group. *P < 0.05, **P < 0.01, ***P < 0.0001, by 1-way ANOVA followed by Tukey’s test. (C) Depressive-like behaviors in male and female mice following refined DBS treatment. n = 14–17 per group. *P < 0.05, **P < 0.01, ***P < 0.0001, by 1-way ANOVA followed by Tukey’s test. (D) Foot shock–induced CPP reinstatement in male and female mice following the refined DBS treatment. n = 12–17 per group. ***P < 0.0001, by mixed RM 2-way ANOVA followed by Šidák’s test. Data are presented as mean ± SEM.

References

    1. Kosten TR, Baxter LE. Review article: Effective management of opioid withdrawal symptoms: a gateway to opioid dependence treatment. Am J Addict. 2019;28(2):55–62. doi: 10.1111/ajad.12862. - DOI - PMC - PubMed
    1. Nuamah JK, et al. The past, present and future of opioid withdrawal assessment: a scoping review of scales and technologies. BMC Med Inform Decis Mak. 2019;19(1):113. doi: 10.1186/s12911-019-0834-8. - DOI - PMC - PubMed
    1. Goeldner C, et al. Impaired emotional-like behavior and serotonergic function during protracted abstinence from chronic morphine. Biol Psychiatry. 2011;69(3):236–244. doi: 10.1016/j.biopsych.2010.08.021. - DOI - PMC - PubMed
    1. Radke AK, Gewirtz JC. Increased dopamine receptor activity in the nucleus accumbens shell ameliorates anxiety during drug withdrawal. Neuropsychopharmacology. 2012;37(11):2405–2415. doi: 10.1038/npp.2012.97. - DOI - PMC - PubMed
    1. Peles E, et al. Depression in methadone maintenance treatment patients: rate and risk factors. J Affect Disord. 2007;99(1-3):213–220. doi: 10.1016/j.jad.2006.09.017. - DOI - PubMed

Publication types