. 2023 Oct 2;133(19):e169823.
doi: 10.1172/JCI169823.

Clinical-genomic determinants of immune checkpoint blockade response in head and neck squamous cell carcinoma

Affiliations

Clinical-genomic determinants of immune checkpoint blockade response in head and neck squamous cell carcinoma

Cristina Valero et al. J Clin Invest. .

Abstract

BACKGROUNDRecurrent and/or metastatic (R/M) head and neck squamous cell carcinoma (HNSCC) is generally an incurable disease, with patients experiencing median survival of under 10 months and significant morbidity. While immune checkpoint blockade (ICB) drugs are effective in approximately 20% of patients, the remaining experience limited clinical benefit and are exposed to potential adverse effects and financial costs. Clinically approved biomarkers, such as tumor mutational burden (TMB), have a modest predictive value in HNSCC.METHODSWe analyzed clinical and genomic features, generated using whole-exome sequencing, in 133 ICB-treated patients with R/M HNSCC, of whom 69 had virus-associated and 64 had non-virus-associated tumors.RESULTSHierarchical clustering of genomic data revealed 6 molecular subtypes characterized by a wide range of objective response rates and survival after ICB therapy. The prognostic importance of these 6 subtypes was validated in an external cohort. A random forest-based predictive model, using several clinical and genomic features, predicted progression-free survival (PFS), overall survival (OS), and response with greater accuracy than did a model based on TMB alone. Recursive partitioning analysis identified 3 features (systemic inflammatory response index, TMB, and smoking signature) that classified patients into risk groups with accurate discrimination of PFS and OS.CONCLUSIONThese findings shed light on the immunogenomic characteristics of HNSCC tumors that drive differential responses to ICB and identify a clinical-genomic classifier that outperformed the current clinically approved biomarker of TMB. This validated predictive tool may help with clinical risk stratification in patients with R/M HNSCC for whom ICB is being considered.FUNDINGFundación Alfonso Martín Escudero, NIH R01 DE027738, US Department of Defense CA210784, The Geoffrey Beene Cancer Research Center, The MSKCC Population Science Research Program, the Jayme Flowers Fund, the Sebastian Nativo Fund, and the NIH/NCI Cancer Center Support Grant P30 CA008748.

Keywords: Cancer immunotherapy; Head and neck cancer; Immunology; Oncology.


Figures

Figure 1
Figure 1. Response and survival outcomes for 133 patients with R/M HNSCC (64 V-negative, 56 HPV-positive, and 13 EBV-positive) treated with ICB.
(A) ORR and Kaplan-Meier estimates for PFS and OS following ICB treatment for all R/M HNSCC patients. (B) ORR, PFS, and OS data for V-negative, HPV-positive, and EBV-positive tumors separately. The P value in the ORR bar chart was obtained with a Fisher’s exact test with Freeman-Halton extension. HRs and 95% CIs for HPV-positive and EBV-positive tumors were calculated relative to V-negative tumors using Cox regression analysis. P values in PFS and OS Kaplan-Meier plot were calculated using a log-rank test.
Figure 2
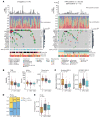
Figure 2. The genomic landscape of V-negative, HPV-positive, and EBV-positive HNSCC.
(A) Each column represents a unique sample. V-negative tumors are shown on the left and HPV-positive and EBV-positive tumors on the right. The top bar chart represents the TMB in mutations/Mbp per sample; the EBV-positive sample marked with an asterisk was microsatellite unstable. Below that, a stacked bar chart shows the proportion of the total mutational load attributed to COSMIC signatures (23) associated with APOBEC activity, smoking, or aging. Oncoprints show the top 15 most frequently mutated genes (listed on the left), the variant type (box color), the total proportion of samples with a mutation in that gene (percentage on the right), and the Q value per gene (bar chart on the right). Tracks below the oncoprints show mutations in the TERT promoter region; an individual tumor’s causative virus (in V-positive tumors only); the primary tumor site; the proportion of LOH at the HLA locus (51); and the tumors’ best objective response. Ins, insertion; Del, deletion; Sig., signature; val, value.(B) Box plots show (from left to right) the TMB, the sum of insertions and deletions per exome, and the total number of clonal mutations per exome in V-negative, HPV-positive, and EBV-positive tumors. The clonal mutational load was available for 124 samples. P values were calculated using a Kruskal-Wallis test. (C) Box plots show the contribution of an SBS signature associated with smoking (SBS 4) and APOBEC activity (SBS 2) in V-negative, HPV-positive, and EBV-positive tumors (n = 133). P values were calculated using a Kruskal-Wallis test. (D) Stacked bar chart shows the proportion of diploidy (blue, mean copy number [CN] of 1.5–2.5) and hyperploidy (yellow, mean CN >2.5) in V-negative, HPV-positive, and EBV-positive tumors (n = 133). The P value was calculated using a Fisher’s exact test with Freeman-Halton extension. (E) Box plots show the sample tumor purity estimates derived from FACETS in V-negative, HPV-positive, and EBV-positive tumors (n = 133). The P value was calculated using a Kruskal-Wallis test.
Figure 3
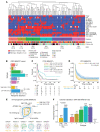
Figure 3. Molecular subtyping of HNSCC using WES data and its relevance to clinical outcomes after ICB treatment.
(A) Hierarchical clustering of 133 R/M HNSCC samples based on 13 genomic features that significantly associated with PFS in a univariable Cox model (listed right) and viral status. The dendrogram was cut at constant height, yielding 6 subtypes. Bottom tracks show the ICB response (printed as a percentage) and the tumor site. (B) ORR per molecular subtype and for grouped subtypes considered high risk (subtypes 1, 2, and 6) and low risk (subtypes 3, 4, and 5). Total n = 133. The P value was calculated using Fisher’s exact test. (C) PFS estimate for each molecular subtype. HRs and 95% CIs were calculated using Cox regression, with subtype 4 as a reference. The P value calculated using a log-rank test. (D) PFS estimate for tumors belonging to subtypes considered high risk (1, 2, and 6) and low risk (3, 4, and 5). HRs and 95% CIs were calculated using Cox regression, with low-risk tumors as a reference. The P value was calculated using a log-rank test. (E) Immunogenomic profiles of high-risk (yellow) and low-risk (blue) samples as well as each subtype individually, based on 7 parameters: high CD8-positive T cell infiltration, CPS of 1 or higher, high TMB, viral positivity, absence of 9p24.1 deletion (locus of CD274 [PD-L1], PDCD1LG2 [PD-L2], and JAK2), absence of a smoking signature, and the presence of an APOBEC signature. Radars extend from 0%–100%; the percentage of tumors positive per parameter is shown. For CD8-positive T cells, the cohort median was used as a cutoff. Thresholds for TMB (3.34 muts/Mbp), APOBEC signature, and smoking signature were chosen to obtain the best performance for predicting PFS in a univariable model. Genomic variables were available for 133 samples and IHC features for 62 samples. amp/wt, amplified or wild-type (diploid) copy number. (F) External validation of the subtypes relevance to the ICB response using KEYNOTE-012 data on patients with HNSCC (n = 102). Bars represent the ORR. The P value was calculated using Fisher’s exact test.
Figure 4
Figure 4. Association of previously described predictors of ICB treatment response in HNSCC.
P values were calculated by comparing patients with a complete or partial response with patients who had stable or progressive disease using a Wilcoxon rank-sum test. Note that some y axes have been log10- or log1p-transformed for visualization purposes. (A) TMB, clonal mutational (mut.) load per exome, and indel load per exome in 64 V-negative samples, per objective response category. The clonal mutational load was available for 59 samples. (B) TMB, clonal mutational load per exome, and indel load per exome in 69 V-positive samples, per objective response category. The clonal mutational load was available for 65 samples. (C) CPS, intratumoral CD3-positive T cell count, and intratumoral CD8-positive T cell count in 36 V-negative samples, per objective response category. The CD3-positive T cell count was available in 35 samples. (D) CPS, intratumoral CD3-positive T cell count, and intratumoral CD8-positive T cell count in 26 V-positive samples, per objective response category. (E) ROC analysis illustrating the performance of the TMB, CPS, CD3-positive infiltration, and CD8-positive infiltration in predicting objective responses, 6-month PFS, and 12-month OS in the patients (V-negative and V-positive) for whom these data were available (n = 62). The AUROC curve (AUC) is printed in each plot.
Figure 5
Figure 5. Training and testing of an integrated, clinical-genomic model in HNSCC using PFS as the outcome.
(A) Feature contribution of 23 clinical and genomic variables to a RF classifier predicting PFS. Variables are ordered from highest to lowest feature contribution. Colored bars on the left indicate the variables included in the PFS-RF23 model (all), the PFS-RF14 model (top 14 variables only), and the PFS-TMB model (TMB only). Autoimmun. dis., autoimmune disease; nonsyn, nonsynonomous mutation. (B) ROC analysis illustrating the performance of the 3 models (PFS-RF23, PFS-RF14, and PFS-TMB) in predicting 6-month PFS, 12-month OS, and objective response in the 70% training set (top row of plots, n = 91) and 30% hold-out test set (bottom row, n = 39). Three patients were excluded due to incomplete clinical data. (C) Bar charts showing the C-index (38) for the PFS-RF23, PFS-RF14, and PFS-TMB model’s performance in predicting PFS and OS, calculated in the test set (n = 39). (D) Kaplan-Meier PFS analysis in the test set for the PFS-RF23, PFS-RF14, and PFS-TMB models. The median predicted PFS for each model was used as a threshold to divide patients into predicted high-survival (blue) and low-survival (yellow) groups. HRs and 95% CIs were calculated using Cox regression, with predicted low-survival tumors as a reference. P values were calculated using a log-rank test.
Figure 6
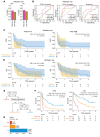
Figure 6. Validation of the clinical-genomic model associated with PFS upon ICB treatment in an independent cohort of 30 patients and model simplification using RPA.
Patient characteristics for the independent cohort are provided in Supplemental Table 2, and model simplification using RPA is shown in Supplemental Figure 5. (A) C-index illustrating the performance of the PFS-RF14 model applied in the independent validation cohort (n = 30), compared with the model based on TMB (PFS-TMB). (B) ROC analysis illustrating the performance of the PFS-RF14 and TMB model in predicting 6-month PFS, 12-month OS, and objective response in the validation cohort (n = 30). (C) PFS in the validation cohort for the PFS-RF14 and PFS-TMB models. The median predicted PFS for each model was used to divide patients into predicted high-survival (blue) and low-survival (yellow) groups. HRs and 95% CIs were calculated using Cox regression, with predicted low-survival tumors as a reference. P values were calculated using a log-rank test. (D) OS in the validation cohort for the PFS-RF14 and PFS-TMB models. The median predicted PFS for each model was used as a threshold to divide patients into predicted high-survival and low-survival groups. HRs and 95% CIs were calculated using Cox regression, with predicted low-survival tumors (yellow) as a reference. (E) RPA classifier created in the main cohort (n = 131) using PFS as a dependent variable. Variables selected for the model were the top 3 features from the PFS-RF23 model: SIRI, TMB, and smoking signature. Patients were classified into high-risk, intermediate-risk, and low-risk groups. (F) PFS (left) and OS (right) of the high- (red), intermediate- (orange), and low-risk (blue) groups obtained using the RPA classifier in the main cohort (n = 131). HRs and 95% CIs were calculated using Cox regression, with low-risk tumors as a reference. P values were calculated using a log-rank test. (G) ORR in the high- (red), intermediate- (orange), and low-risk (blue) groups obtained using the RPA classifier in the main cohort (n = 131). The P value was calculated using a Fisher’s exact test with Freeman-Halton extension. Intermed., intermediate.

References

    1. Siegel RL, et al. Cancer Statistics, 2017. CA Cancer J Clin. 2017;67(1):7–30. doi: 10.3322/caac.21387. - DOI - PubMed
    1. Ang KK, et al. Human papillomavirus and survival of patients with oropharyngeal cancer. N Engl J Med. 2010;363(1):24–35. doi: 10.1056/NEJMoa0912217. - DOI - PMC - PubMed
    1. Ferlay J, et al. GLOBOCAN 2012: Estimated Cancer Incidence, Mortality and Prevalence Worldwide in 2012 v1.0. Cancer Incidence and Mortality Worldwide; 2013.
    1. Janot F, et al. Randomized trial of postoperative reirradiation combined with chemotherapy after salvage surgery compared with salvage surgery alone in head and neck carcinoma. J Clin Oncol. 2008;26(34):5518–5523. doi: 10.1200/JCO.2007.15.0102. - DOI - PubMed
    1. Vermorken JB, et al. Platinum-based chemotherapy plus cetuximab in head and neck cancer. N Engl J Med. 2008;359(11):1116–1127. doi: 10.1056/NEJMoa0802656. - DOI - PubMed

Publication types

MeSH terms

Substances