. 2023 Sep 8;8(17):e170845.
doi: 10.1172/jci.insight.170845.

Vascular smooth muscle-specific YAP/TAZ deletion triggers aneurysm development in mouse aorta

Affiliations

Vascular smooth muscle-specific YAP/TAZ deletion triggers aneurysm development in mouse aorta

Marycarmen Arévalo Martínez et al. JCI Insight. .

Abstract

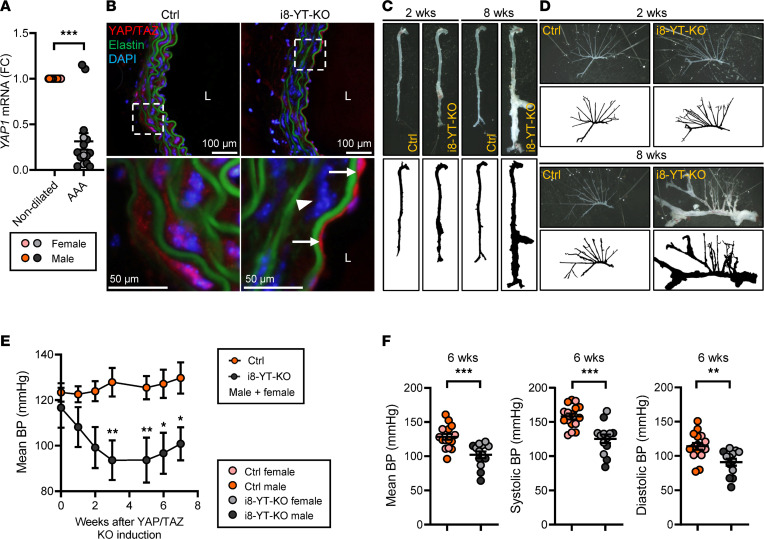
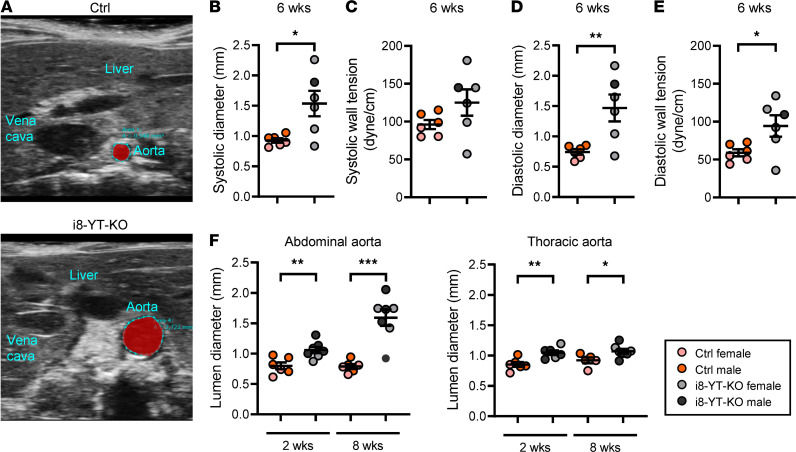
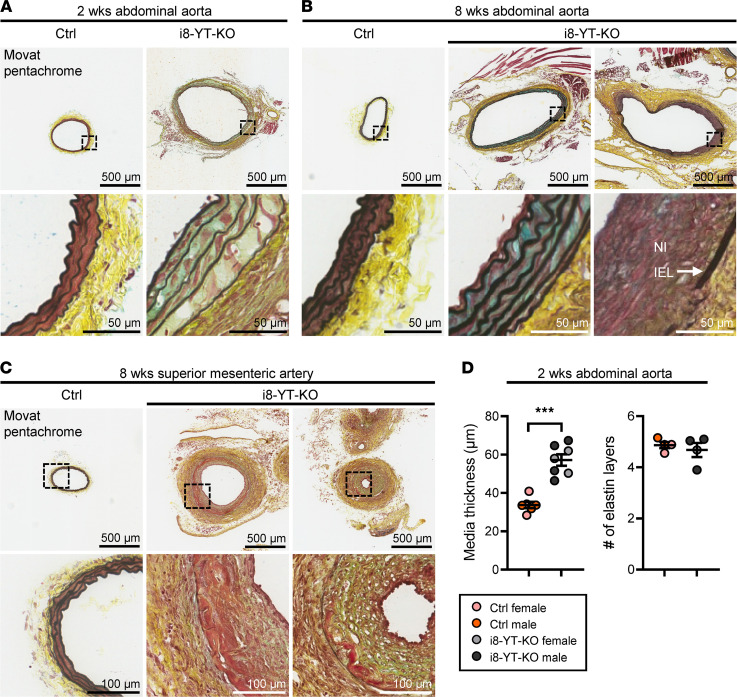
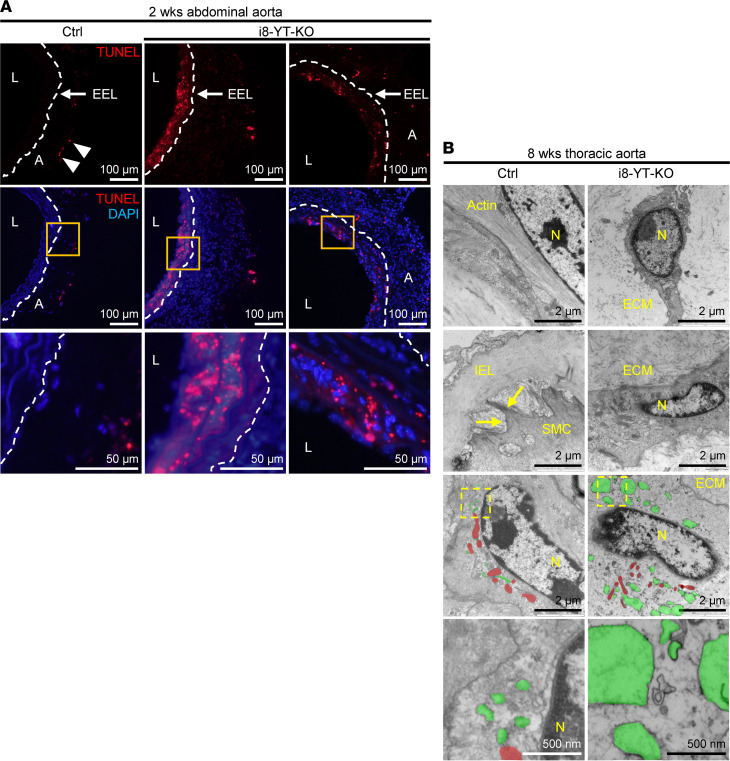
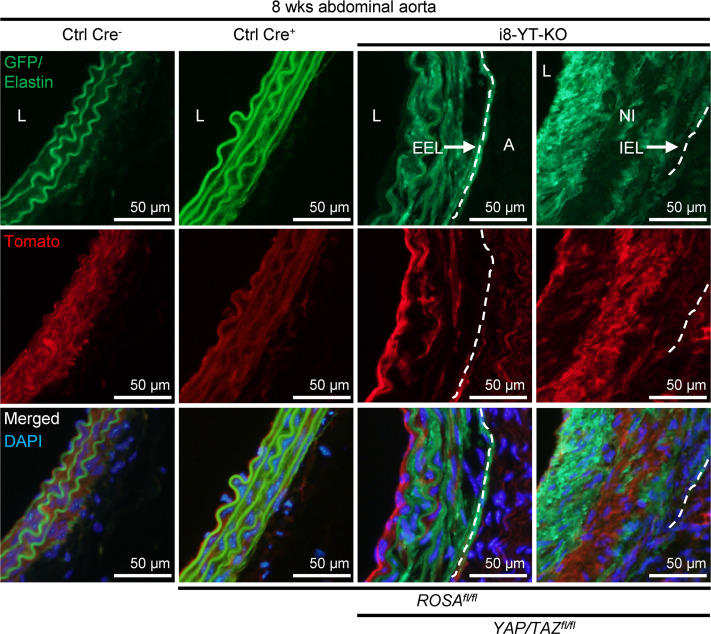
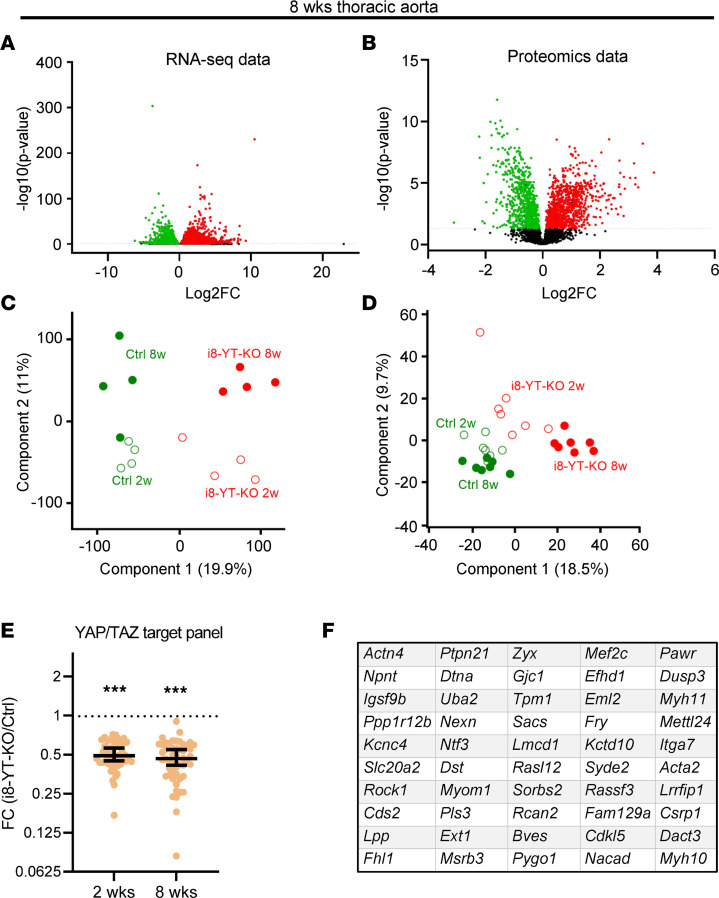
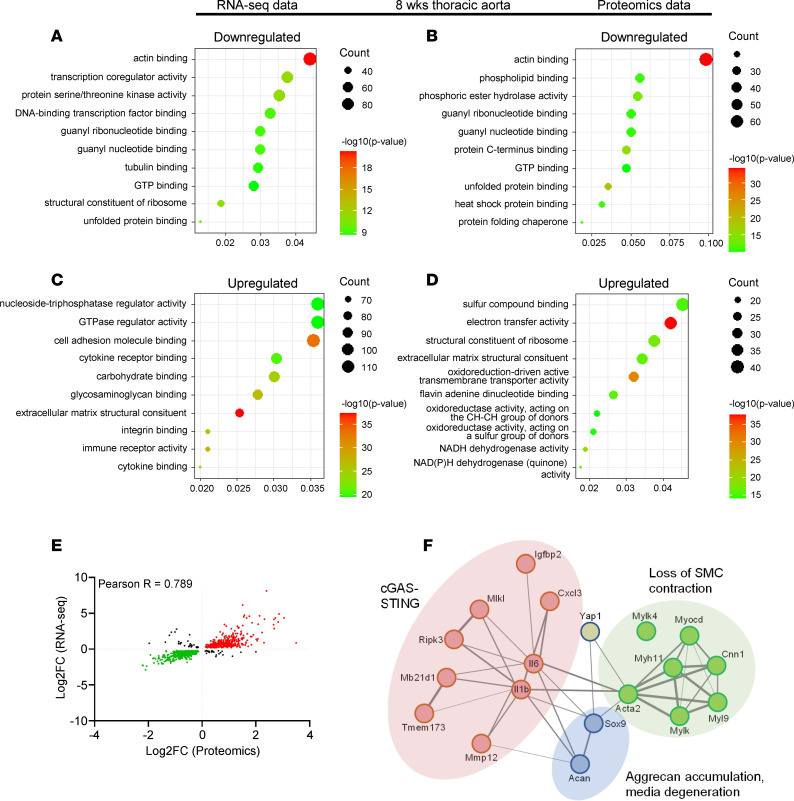
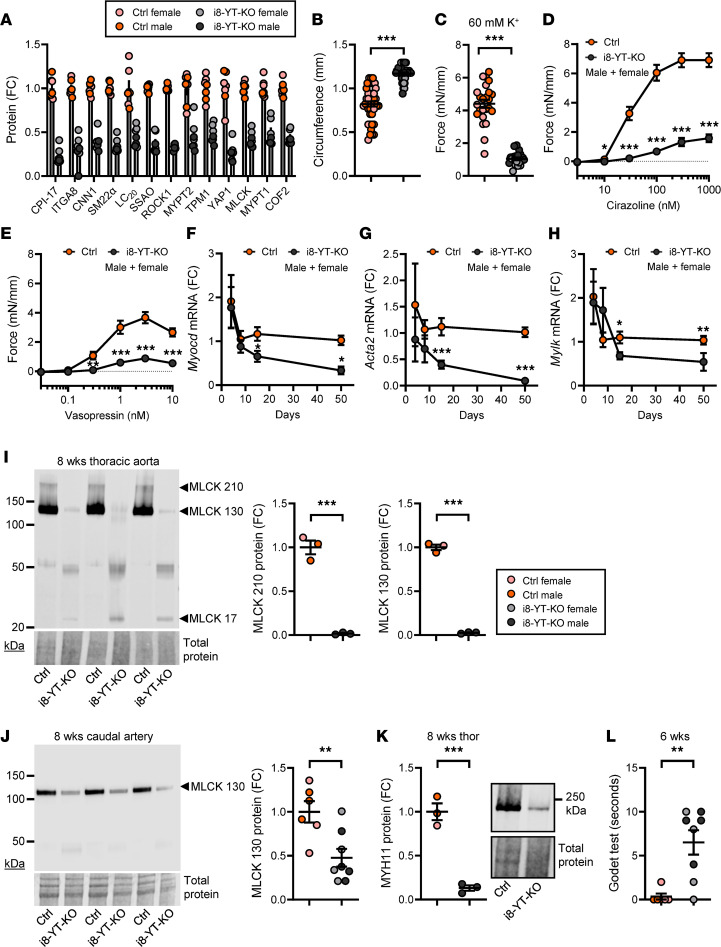
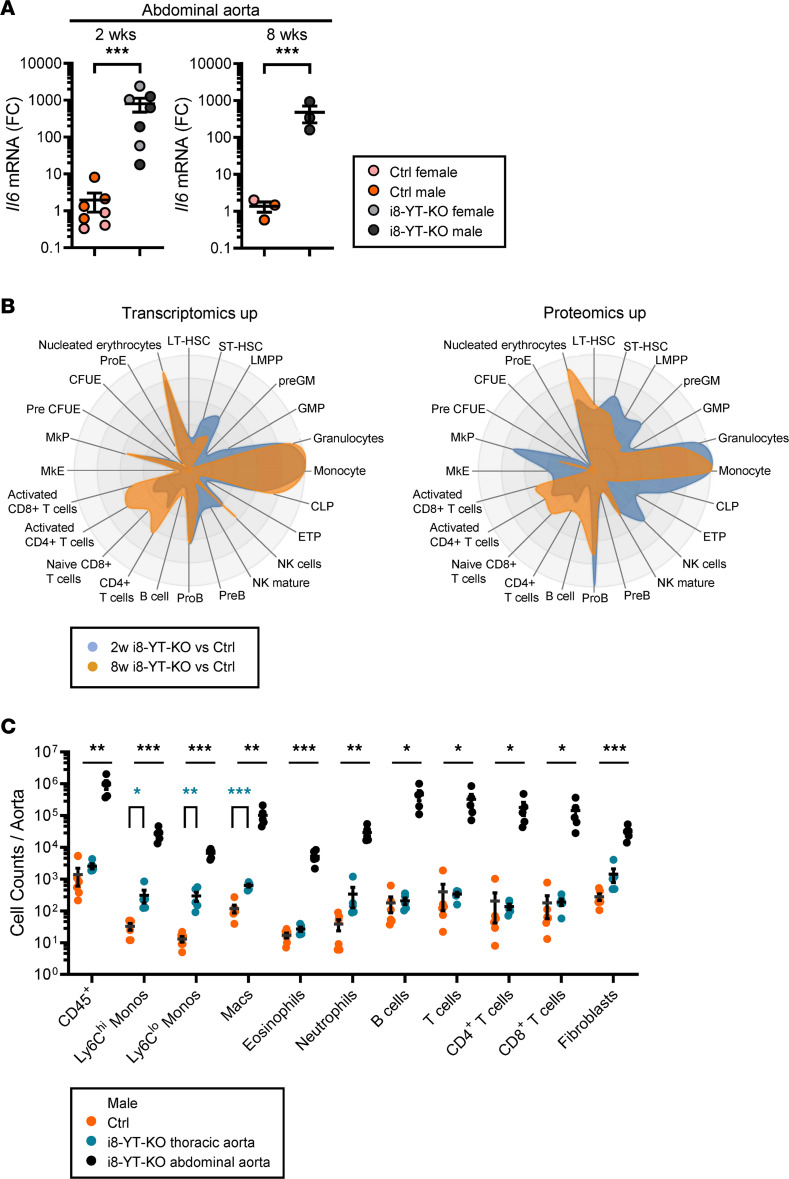
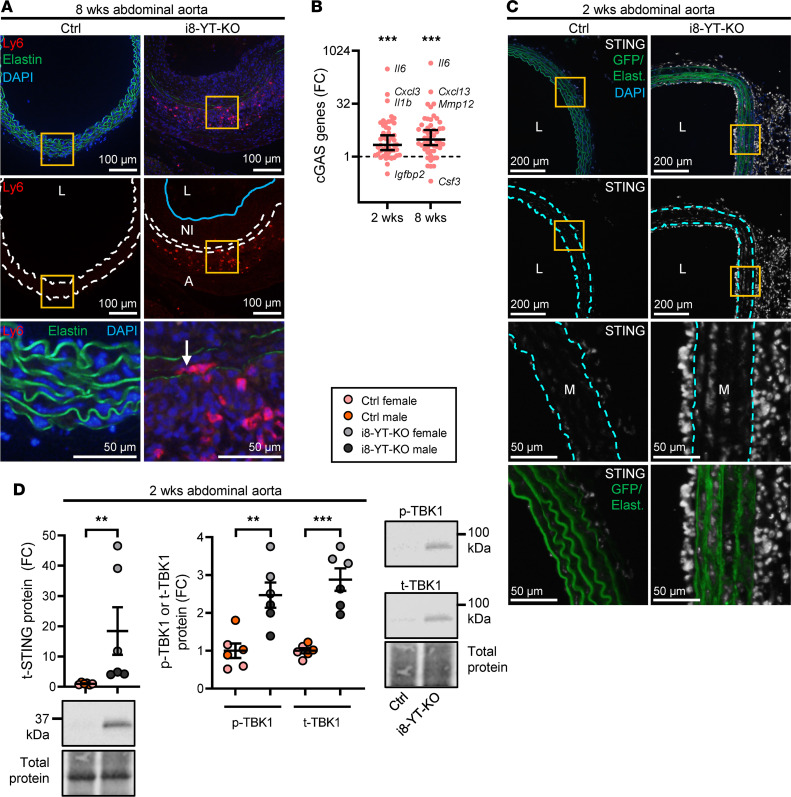
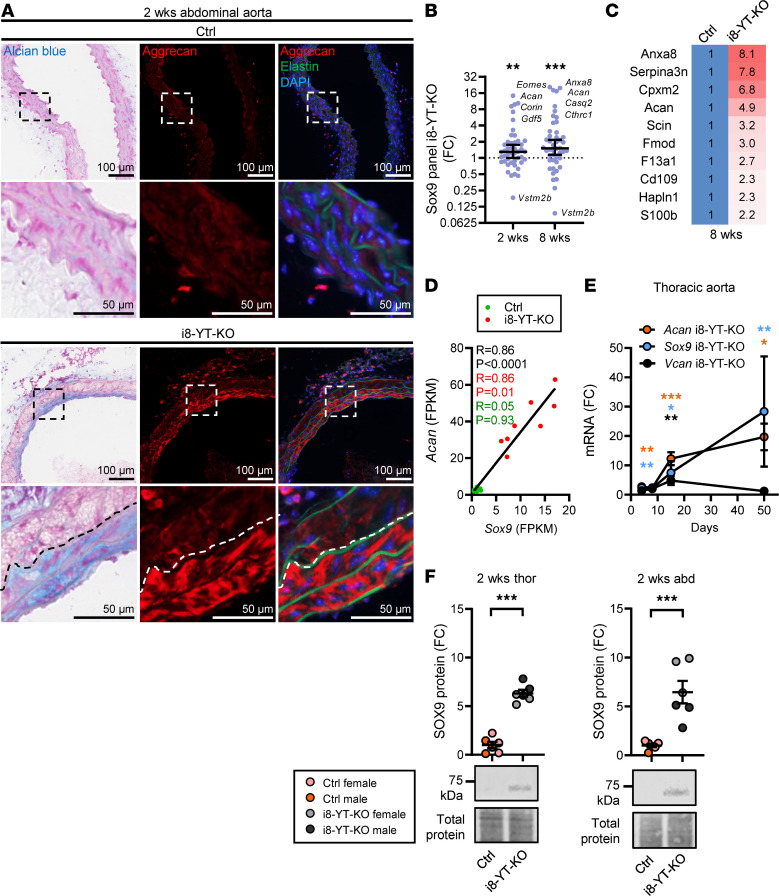
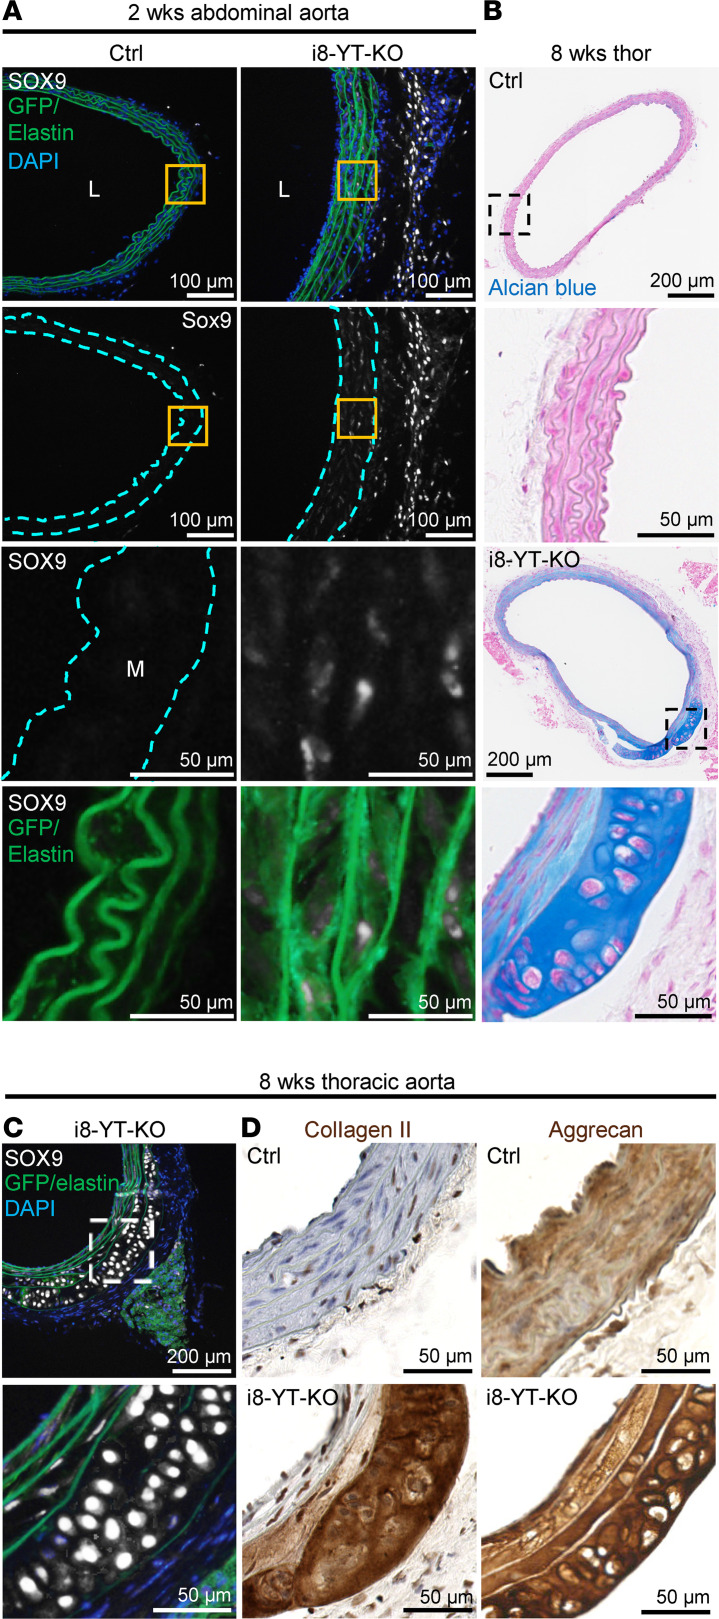
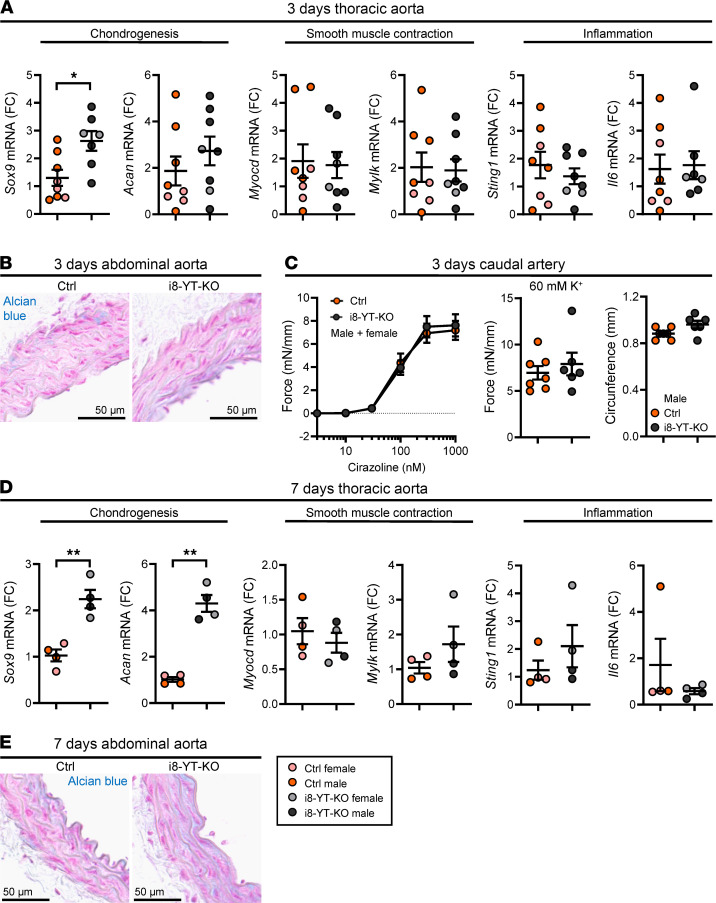
Inadequate adaption to mechanical forces, including blood pressure, contributes to development of arterial aneurysms. Recent studies have pointed to a mechanoprotective role of YAP and TAZ in vascular smooth muscle cells (SMCs). Here, we identified reduced expression of YAP1 in human aortic aneurysms. Vascular SMC-specific knockouts (KOs) of YAP/TAZ were thus generated using the integrin α8-Cre (Itga8-Cre) mouse model (i8-YT-KO). i8-YT-KO mice spontaneously developed aneurysms in the abdominal aorta within 2 weeks of KO induction and in smaller arteries at later times. The vascular specificity of Itga8-Cre circumvented gastrointestinal effects. Aortic aneurysms were characterized by elastin disarray, SMC apoptosis, and accumulation of proteoglycans and immune cell populations. RNA sequencing, proteomics, and myography demonstrated decreased contractile differentiation of SMCs and impaired vascular contractility. This associated with partial loss of myocardin expression, reduced blood pressure, and edema. Mediators in the inflammatory cGAS/STING pathway were increased. A sizeable increase in SOX9, along with several direct target genes, including aggrecan (Acan), contributed to proteoglycan accumulation. This was the earliest detectable change, occurring 3 days after KO induction and before the proinflammatory transition. In conclusion, Itga8-Cre deletion of YAP and TAZ represents a rapid and spontaneous aneurysm model that recapitulates features of human abdominal aortic aneurysms.

Keywords: Cardiovascular disease; Cell Biology; Hypertension; Vascular Biology; Vasculitis.


Figures

Figure 1
Figure 1. i8-YT-KO mice develop severe vascular lesions.
(A) YAP1 levels were determined by RT-qPCR in human control (nondilated) aortae and in abdominal aortic aneurysms (AAAs). To examine the role of YAP/TAZ in aneurysm development, the i8-YT-KO mouse was generated. (B) Immunofluorescence images of YAP/TAZ (red) in the aorta at 2 weeks after tamoxifen injection to induce knockout. Reduced YAP/TAZ labeling of smooth muscle cells (arrowhead), but not of endothelial cells (arrows), is apparent in i8-YT-KO aorta. Elastin, which is autofluorescent, is shown in green and DAPI nuclear stain in blue. (C) Photomicrographs (top) and black-and-white (bottom) images of dissected aortae from control and i8-YT-KO mice at 2 and 8 weeks following YAP/TAZ deletion. (D) The mesenteric arterial tree was dissected from 2- and 8-week mice. (E) Mean arterial blood pressure (BP) over time, starting before tamoxifen injections, is shown (n ≥ 6). (F) Mean, systolic, and diastolic blood pressures at 6 weeks from a larger cohort of mice (including mice from panel E) are represented as individual animals (n ≥ 13). L, lumen. *P < 0.05; **P < 0.01; ***P < 0.001 by Mann-Whitney test (A), 2-way ANOVA with Bonferroni’s post hoc test (E), or 2-tailed Student’s t test (F).
Figure 2
Figure 2. i8-YT-KO mice develop aortic aneurysms.
(A) Echocardiography was used to determine aortic diameter in anesthetized mice. (BE) The systolic and diastolic diameter of the abdominal aorta and systolic and diastolic wall tension at 6 weeks are shown (n = 6). (F) The aortic lumen diameter of abdominal (n ≥ 6) and thoracic (n ≥ 5) aortae in perfusion-fixed aortic specimens at 2 and 8 weeks. *P < 0.05; **P < 0.01; ***P < 0.001 by 2-tailed Student’s t test (BF).
Figure 3
Figure 3. Abdominal aortic aneurysms show disorganized elastin and neointima and adventitial expansion.
(A and B) Sections of the abdominal aorta at 2 and 8 weeks following the first tamoxifen injection. Movat pentachrome, which stains elastin black, collagen yellow, proteoglycans and mucins blue, and smooth muscle red, was used for staining transversally cut cryosections. Low and high magnifications are shown, and the latter are highlighted using boxes in the top row. In controls (Ctrl), medial cells in red were tightly packed between layers of elastin, and the adventitia was bright yellow. In knockout aorta (i8-YT-KO), the lumen circumference was enlarged, elastic lamellae more widely spaced, and there were fewer red medial cells, while blue staining was increased. The adventitia was more cellular. Advanced lesions in i8-YT-KO aortae were characterized by greater enlargement of the lumen diameter, advanced neointima formation (NI) inside the internal elastic lamina (IEL), and further elastin disarray with breaks in the continuity of individual lamellae. (C) Movat pentachrome–stained sections of lesions in the superior mesenteric artery. Neointima formation often encroached on the lumen, and black lamellae were sometimes difficult to identify. (D) Quantification of media thickness and the average number of lamellae in abdominal aorta at 2 weeks (n ≥ 4). ***P < 0.001 by 2-tailed Student’s t test (D).
Figure 4
Figure 4. Abdominal aortic aneurysms show medial apoptosis and ultrastructural changes in SMCs.
(A) TUNEL staining in red, indicative of apoptosis, in the abdominal aorta at 2 weeks. TUNEL-positive cells were found predominantly on the luminal side of the external elastic lamina (EEL, dashed line) in i8-YT-KO aortae. A few TUNEL-positive cells were identified in the adventitia (A) of control (Ctrl) mice (arrowheads). Orange boxes are shown at higher magnification in the bottom row. DAPI (blue) was used as nuclear stain. (B) Representative electron micrographs from Ctrl and i8-YT-KO aorta at 8 weeks. The 2 top rows indicate smooth muscle cell (SMC) shrinkage along with a reduction in thin actin filaments in i8-YT-KO aorta. Arrows point to focal adhesions, which appeared less prevalent in i8-YT-KO SMCs. The 2 bottom rows indicate an expansion of endoplasmic reticulum (green) in i8-YT-KO SMCs, interspersed between mitochondria (red) (n ≥ 3). L, lumen; N, nucleus; IEL, internal elastic lamina; ECM, extracellular matrix.
Figure 5
Figure 5. Lineage tracing in i8-YT-KO mice shows that SMCs contribute the bulk of cells to the neointima.
i8-YT-KO mice on the mT/mG background were used to track cells derived from SMCs in aneurysms. mT/mG mice carry a transgene that expresses Tomato (red) before recombination. After recombination, the cells instead express GFP (green). The media stained red in control (Ctrl) Cre mice at 8 weeks after tamoxifen administration. The only green staining was from elastin autofluorescence. Ctrl Cre refers to Cre-negative tamoxifen-treated ROSA Itga8-CreERT2 mice, whereas Ctrl Cre+ refers to Cre-positive tamoxifen-treated ROSA Itga8-CreERT2 mice. Following recombination (i8-YT-KO), medial red staining was reduced, and green staining appeared between the autofluorescent lamellae. In advanced lesions with thick neointimas (NI) inside the internal elastic lamina (IEL, dashed line), the neointima was intensely green. This suggests that SMCs derived from the media contributed to the formation of neointima. In contrast, the adventitia (A) was largely GFP negative. The top right section is identical to the right panel in Figure 3B. DAPI (blue) was used as nuclear stain. L, lumen; EEL, external elastic lamina (dashed line).
Figure 6
Figure 6. Transcriptomic and proteomic data highlight mechanisms of aneurysm formation in i8-YT-KO mice.
mRNAs and proteins were assayed in thoracic aortae at 8 weeks after tamoxifen injections using RNA sequencing (n = 4) and mass spectrometry (n = 7). (A and B) Volcano plots for mRNA and protein data at 8 weeks. Below, principal component analysis (PCA) plots for transcriptomic (C) and proteomic (D) data at 2 and 8 weeks, respectively, are shown. Components 1 and 2 are presented in each. FC, fold change. (E) Demonstrates the effect of i8-YT-KO on the expression of 53 selected genes that are among the 1000 transcripts that correlate best with YAP1 in human aorta (GTExPortal) and that have been identified as potential YAP/TAZ targets in 2 independent studies (12, 13). (F) Using RNA-sequencing data from 2- and 8-week i8-YT KO aortae, the vascular smooth muscle YAP/TAZ target panel used in E was further refined to include the 50 genes shown. A 2-tailed Student’s t test with permutation-based FDR was used in A and B; Wilcoxon’s signed-rank test was used in E. ***P < 0.001.
Figure 7
Figure 7. Transcriptomic and proteomic data highlight over- and underrepresented biological processes associated with aneurysm formation in i8-YT-KO mice.
(AD) Gene ontology enrichment analysis for downregulated transcripts (A) and proteins (B), as well as upregulated transcripts (C) and proteins (D) demonstrate significant pathways at 8 weeks. (E) Significant correlation between proteomic and transcriptomic data sets was seen. (F) STRING analysis that highlights 3 pathogenic domains of aneurysmal disease in i8-YT-KO mice. Pearson’s R was used in E. FC, fold change.
Figure 8
Figure 8. Loss of SMC differentiation and arterial contractility in i8-YT-KO mice at 8 weeks.
(A) Proteins with a role in SMC contraction that were significantly reduced in the proteomic experiment at 8 weeks after tamoxifen. Several of these, including integrin α8 (ITGA8), calponin-1 (CNN1), transgelin (SM22α), membrane primary amine oxidase (SSAO), and myosin light chain kinase (MLCK), are targets of the transcription factor myocardin (Myocd), the master regulator of SMC differentiation. To examine contractility, we mounted caudal arteries in Mulvany myographs and applied a basal tension of 5 mN. FC, fold change. (B) Shows that the internal circumference was greater in i8-YT-KO mice compared with controls (Ctrl) at 5 mN (n ≥ 18 mice and 38 arteries). (CE) Following equilibration, arteries were stimulated with 60 mM K+ (C, n ≥ 18 mice and 38 arteries), the α1-adrenergic receptor agonist cirazoline (D, n ≥ 10 mice and 20 arteries), and vasopressin (E, n ≥ 10 mice and 20 arteries). Preparations were washed and maintained in a relaxed state for 25 minutes between stimuli. Transcriptomic data indicated reduced expression of Myocd at 8 weeks after tamoxifen. (F) This reduced expression was confirmed using RT-qPCR in time-course studies of the aorta (n ≥ 4). (G and H) Parallel reduction of Acta2 (G, n ≥ 4) and Mylk (H, n ≥ 4) was observed. (I) Western blot for MLCK using 8-week aortae along with quantification of the bands at 210 and 130 kDa (n = 3). (J) MLCK in caudal arteries at 8 weeks (n ≥ 6). (K) Reduction in smooth muscle myosin heavy chain (MYH11) was also confirmed by Western blotting (n = 3). (L) Results from the Godet test (n ≥ 6). This test measures time taken (in seconds) for skin to rebound from pitting and is considered an indication of edema. *P < 0.05; **P < 0.01; ***P < 0.001 by Mann-Whitney test (B and L), 2-tailed Student’s t test (C and FK), or 2-way ANOVA with Bonferroni’s post hoc test (D and E).
Figure 9
Figure 9. Aortic inflammation in i8-YT-KO mice involves induction of proinflammatory mediators and infiltration of several immune cell populations.
RNA sequencing indicated upregulation of numerous inflammatory mediators in the aorta. (A) RT-qPCR assays for the proinflammatory cytokine interleukin 6 (Il6) confirmed upregulation in the abdominal aorta (2 weeks: n = 7; 8 weeks: n = 3). FC, fold change. (B) Upregulated transcripts and proteins were next used to predict distribution of bone marrow–derived inflammatory cells using CellRadar. Irrespective of the data set, monocytes/macrophages and granulocytes were predicted to reside in knockout (i8-YT-KO) aortae. (C) To directly measure infiltration of immune cells, cells were isolated from the aorta (8 weeks) and separated by flow cytometry. We assayed the thoracic (blue) and abdominal (black) aortae separately in i8-YT-KO mice, and compared cell counts with those of the whole aorta in control (Ctrl) mice (orange). All immune cell populations were increased in the abdominal aorta, whereas only monocytes and macrophages were significantly increased in thoracic aorta. LT-HSC, long-term hematopoietic stem cells; ST-HSC, short-term hematopoietic stem cells; LMPP, lympho-myeloid primed progenitor; GM, granulocyte-macrophage; GMP, granulocyte-monocyte progenitor; CLP, common lymphoid progenitor; ETP, early T cell precursor; NK, natural killer; MkE, megakaryocyte/erythroid; MkP, megakaryocyte progenitor; CFUE, colony-forming unit-erythroid; ProE, pro-erythrocyte. *P < 0.05; **P < 0.01; ***P < 0.001 by 2-tailed Student’s t test (A and C).
Figure 10
Figure 10. Aortic inflammation in i8-YT-KO mice involves cGAS genes.
(A) We used Ly6 immunofluorescence to localize monocytes in aneurysms and found them predominantly in the adventitia. Arrow depicts rare monocytes infiltrating the media. Dashed lines represent the internal and external elastic lamina and the blue line demarcates neointima border. NI, neointima; L, lumen; A, adventitia. (B) To approach possible underlying mechanisms of inflammation and immune cell infiltration, we interrogated our transcriptomic data sets with a panel of cGAS/STING target genes. This panel was significantly increased at both time points (2 and 8 weeks), with the largest relative changes seen for Il6, Cxcl3, Il1b, and Mmp12. FC, fold change. (C) mT/mG mice were used to stain for STING (grayscale), which was high in the neointima and in the adventitia. However, smooth muscle cells (SMCs) in media also showed clear evidence of STING induction. Boxed areas are highlighted in magnified images (third and fourth rows). Some STING-positive cells were GFP positive (green, bottom row), suggesting that they are of SMC origin. Dashed lines represent the internal and external elastic lamina. (D) We next assayed the level of total (t)-STING by Western blotting (n = 6) and found it to be increased. Also shown are the Western blot data for p-TBK1 and t-TBK1 in Ctrl and i8-YT-KO aortae (n = 6). t-STING, p-TBK1, and t-TBK1 were blotted for on the same membrane. The membrane was stripped of anti–p-TBK1 before being blotted and analyzed for t-TBK1. DAPI (blue) was used as nuclear stain. **P < 0.01; ***P < 0.001 by Wilcoxon’s signed-rank test (B), Mann-Whitney test (D, left graph), or 2-tailed Student’s t test (D, right graph).
Figure 11
Figure 11. SOX9 is induced and drives a program of chondrogenic differentiation in i8-YT-KO aortae.
(A) Staining of abdominal aorta with Alcian blue (left) and with an antibody directed against aggrecan (middle and right) in consecutive sections. Areas that were blue overlapped with areas that stained positive for aggrecan in red. Our transcriptomic data sets indicated increased expression of the chondrogenic transcription factor Sox9, a known regulator of aggrecan. (B) We thus interrogated RNA-sequencing data with a panel of knockout-validated SOX9 target genes and found the panel to be increased at 2 weeks and 8 weeks. FC, fold change. (C) A larger panel of SOX9 target genes in cartilage was next overlaid with our 8-week proteomic data, and the SOX9-regulated proteins that increased >2-fold are listed. (D) Sox9 and aggrecan (Acan) correlate in our transcriptomic data sets across genotypes and over time. Correlations were also tested for i8-YT-KO mice and control (Ctrl) mice separately, and the R values of those tests are given in red and green. (E) RT-qPCR for Sox9, aggrecan (Acan), and versican (Vcan) confirmed upregulation in thoracic aortae (n ≥ 4). (F) Western blot data for SOX9 in thoracic and abdominal aortae (n ≥ 6). DAPI (blue) was used as nuclear stain. *P < 0.05; **P < 0.01; ***P < 0.001 by Wilcoxon’s signed-rank test (B), Spearman’s correlation (D), or 2-tailed Student’s t test (E and F [except for versican, 8 weeks in panel E, where Mann-Whitney was used]).
Figure 12
Figure 12. SOX9 is induced in i8-YT-KO aortae and drives a program of chondrogenic differentiation.
(A) Staining for SOX9 (grayscale) in mT/mG control (Ctrl) and i8-YT-KO mice. No SOX9-positive cells were observed in Ctrl aortae. In contrast, SOX9-positive cells resided both in the adventitia and in the media (M) of the i8-YT-KO aortae. Those in the media are highlighted in the magnified images (third row, orange boxes in the low magnifications above). SOX9-positive cells in the media were GFP positive (green, bottom row), showing that they were of smooth muscle origin. (B) Alcian blue staining of cartilage-like tissue in the outer layers of the media in i8-YT-KO mice. (C and D) The same tissue stained strongly for SOX9, collagen II, and aggrecan, and it was demarcated by elastic lamellae. DAPI (blue) was used as nuclear stain. L, lumen.
Figure 13
Figure 13. Sox9 induction is the earliest detectable change in the i8-YT-KO aorta.
This study identified 3 areas of aneurysm pathogenesis in i8-YT-KO mice, involving SOX9 and chondrogenesis, myocardin (Myocd) and contractile differentiation, and STING and inflammation. To examine which comes first, we analyzed mice at 3 (AC) and 7 days (D and E) following the first injection of tamoxifen. We assayed transcripts relevant for each of the 3 areas of pathogenesis using RT-qPCR. (A and B) Sox9 was the only transcript that was increased at 3 days. A single outlier was identified using the iterative Grubb’s method and excluded. At 3 days, Myocd and Sting1 were unchanged (n = 7) (A), and no difference in Alcian blue staining was seen (B). FC, fold change. (C) Loss of contractility and remodeling of the caudal artery had not yet occurred (n ≥ 4 mice and 6 arteries). (D and E) At 7 days, both Sox9 and Acan were increased (D), while the remainder of the transcripts remained inert (n = 4) and Alcian blue staining had not yet followed suit (E). *P < 0.05; **P < 0.01 by 2-tailed Student’s t test (A, C [right 2 graphs], and D [except Il6, where Mann-Whitney was used]) or 2-way ANOVA with Bonferroni’s post hoc test (C, left graph).

References

    1. Virani SS, et al. Heart disease and stroke statistics-2021 update: a report from the American Heart Association. Circulation. 2021;143(8):e254–e743. doi: 10.1161/CIR.0000000000000950. - DOI - PubMed
    1. Daoud F, et al. Role of smooth muscle YAP and TAZ in protection against phenotypic modulation, inflammation, and aneurysm development. Biochem Pharmacol. 2022;206:115307. doi: 10.1016/j.bcp.2022.115307. - DOI - PubMed
    1. Daoud F, et al. YAP and TAZ in vascular smooth muscle confer protection against hypertensive vasculopathy. Arterioscler Thromb Vasc Biol. 2022;42(4):428–443. doi: 10.1161/ATVBAHA.121.317365. - DOI - PMC - PubMed
    1. Zhang C, et al. Aortic stress activates an adaptive program in thoracic aortic smooth muscle cells that maintains aortic strength and protects against aneurysm and dissection in mice. Arterioscler Thromb Vasc Biol. 2023;43(2):234–252. doi: 10.1161/ATVBAHA.122.318135. - DOI - PMC - PubMed
    1. Sladitschek-Martens HL, et al. YAP/TAZ activity in stromal cells prevents ageing by controlling cGAS-STING. Nature. 2022;607(7920):790–798. doi: 10.1038/s41586-022-04924-6. - DOI - PMC - PubMed

Publication types

Substances