. 2023 Oct 2;133(19):e162731.
doi: 10.1172/JCI162731.

Pathogenic myelin-specific antibodies in multiple sclerosis target conformational proteolipid protein 1-anchored membrane domains

Affiliations

Pathogenic myelin-specific antibodies in multiple sclerosis target conformational proteolipid protein 1-anchored membrane domains

Gregory P Owens et al. J Clin Invest. .

Abstract

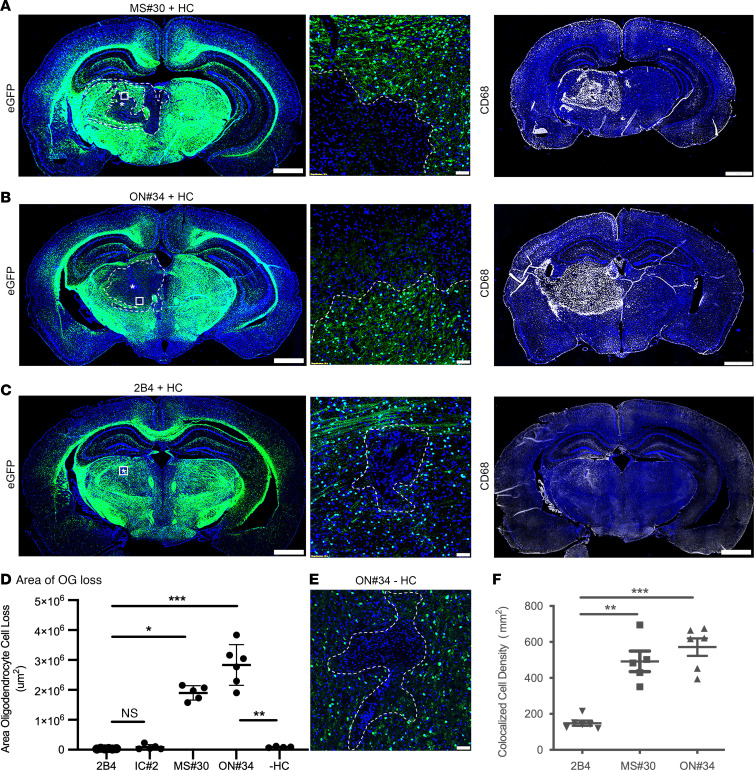
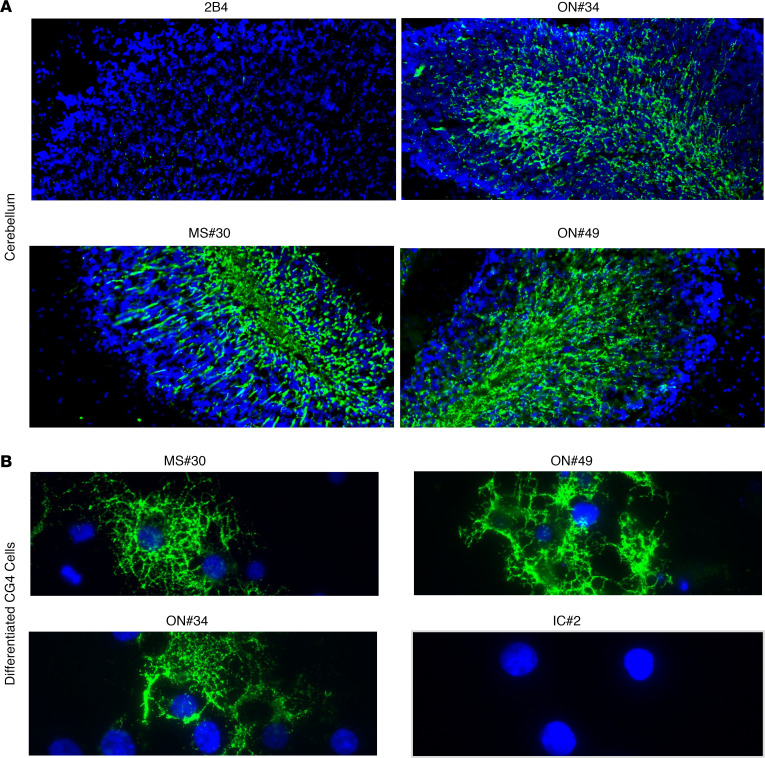
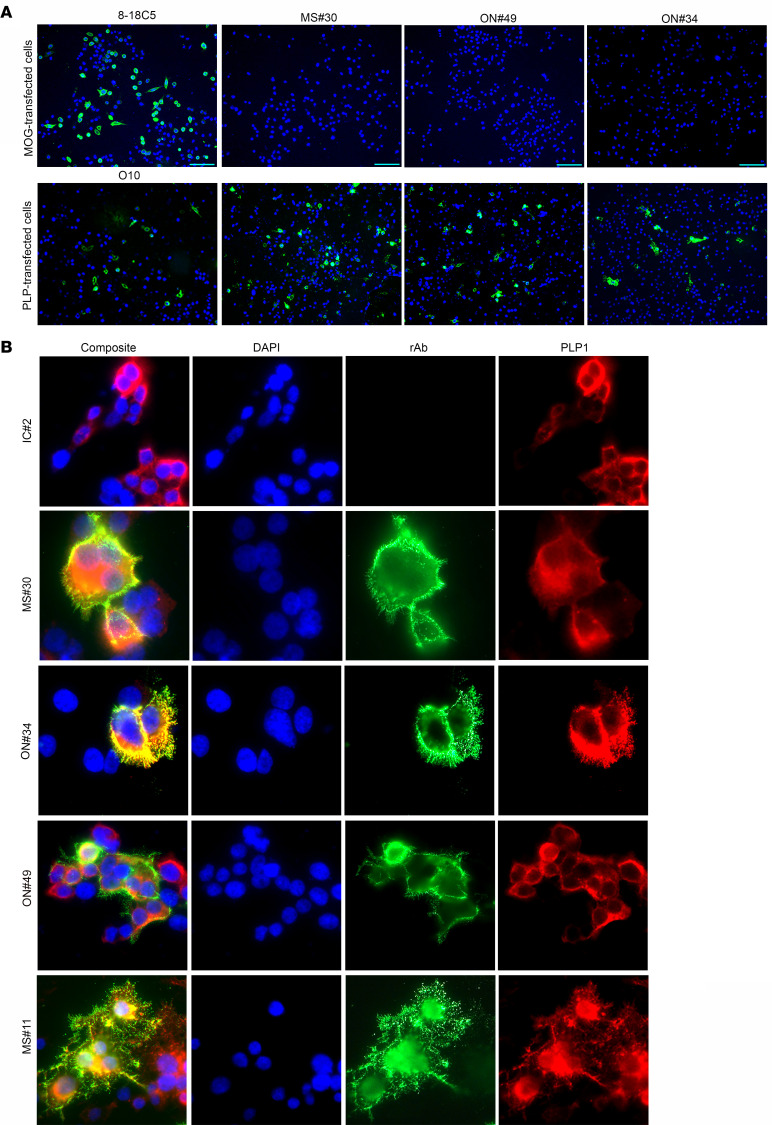
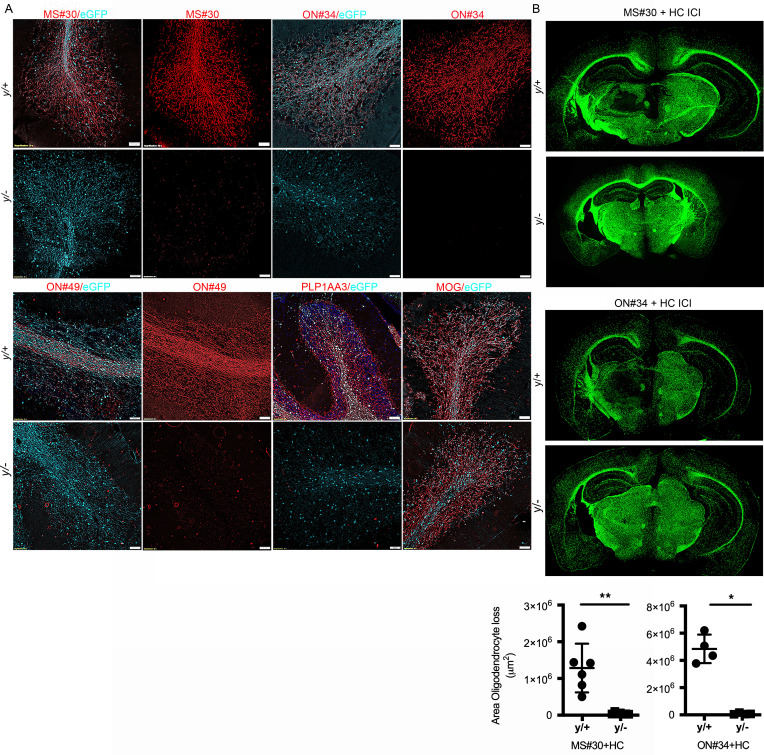
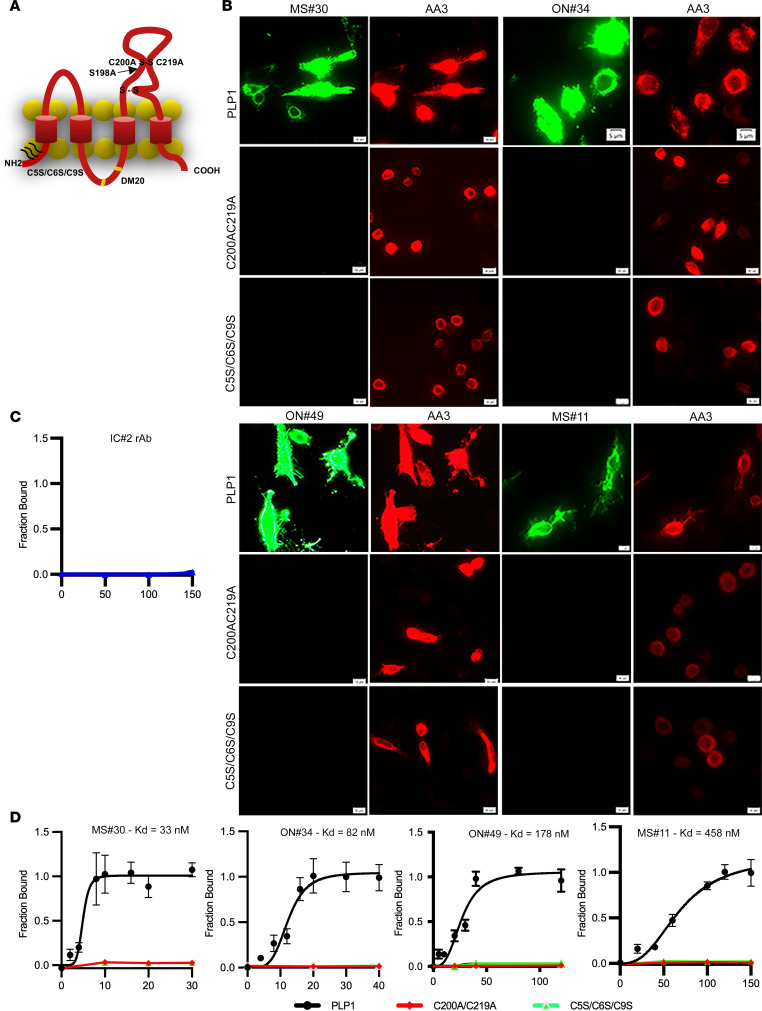
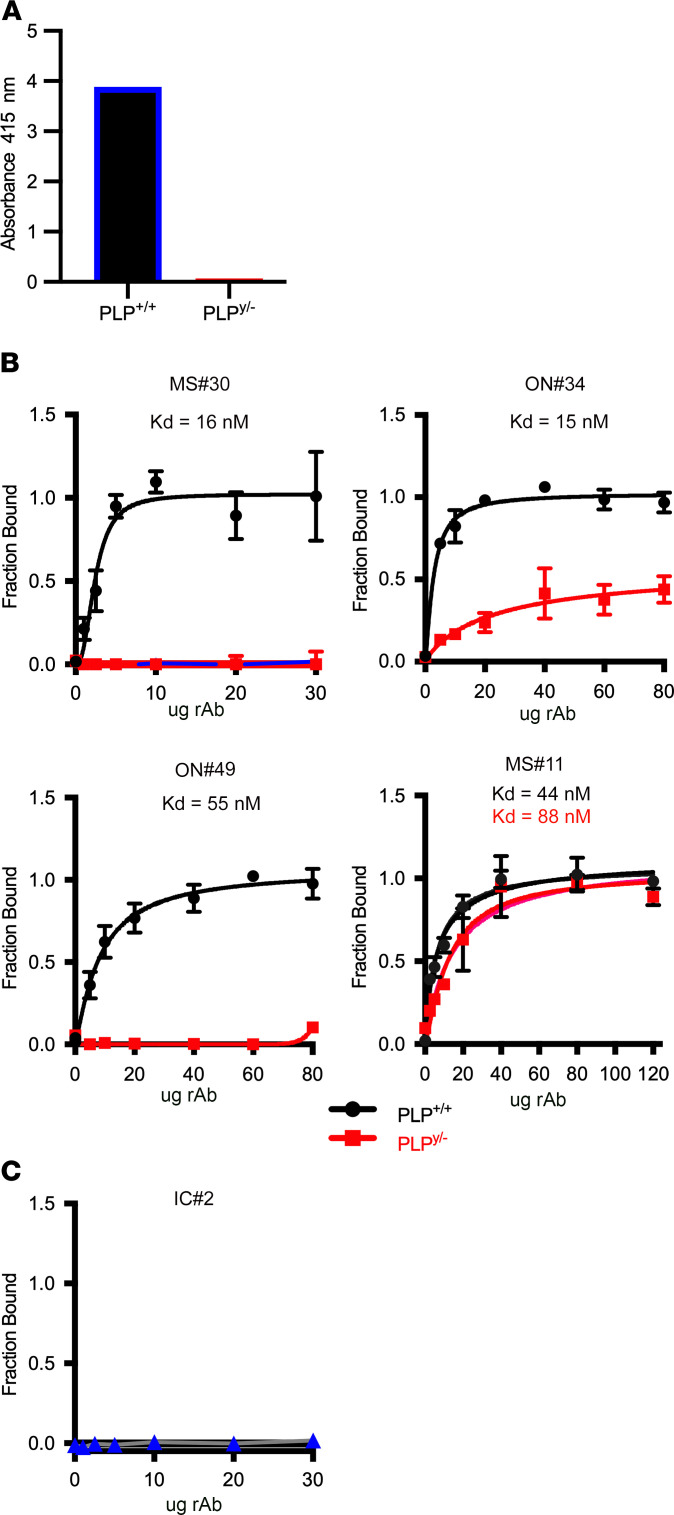
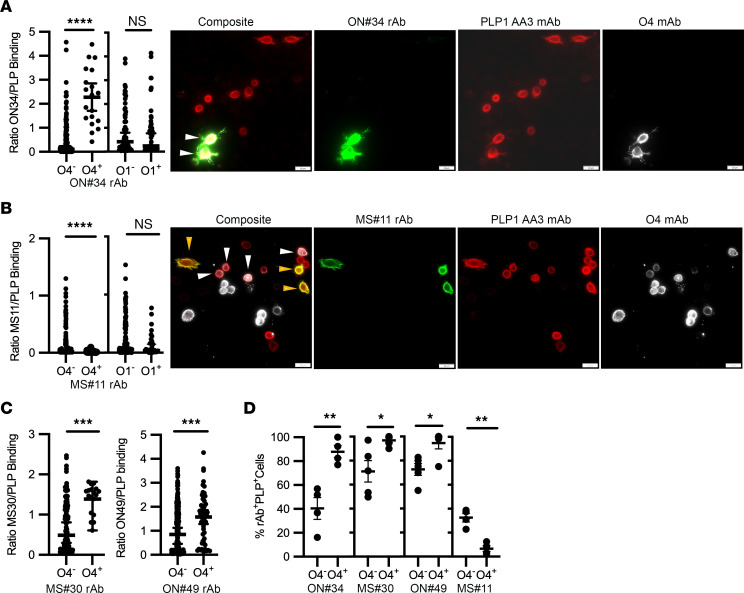
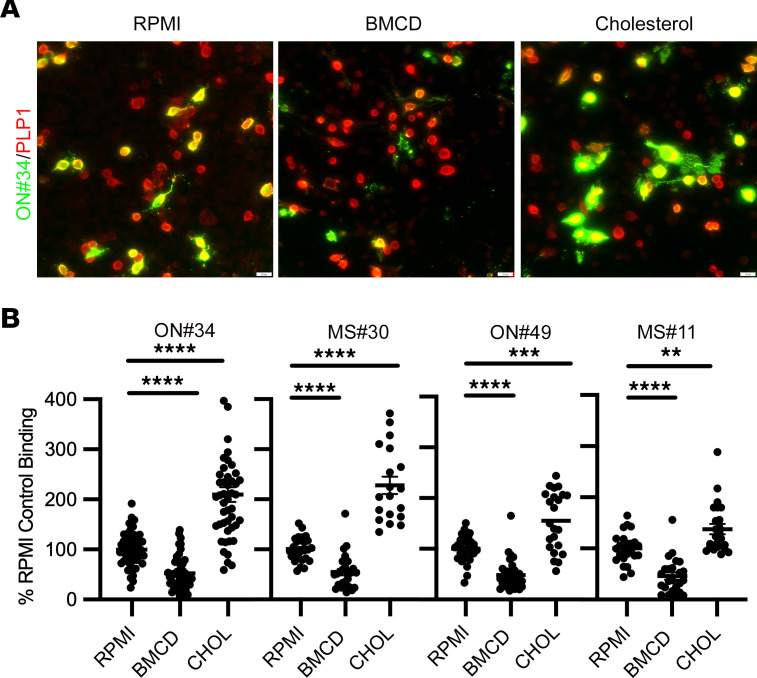
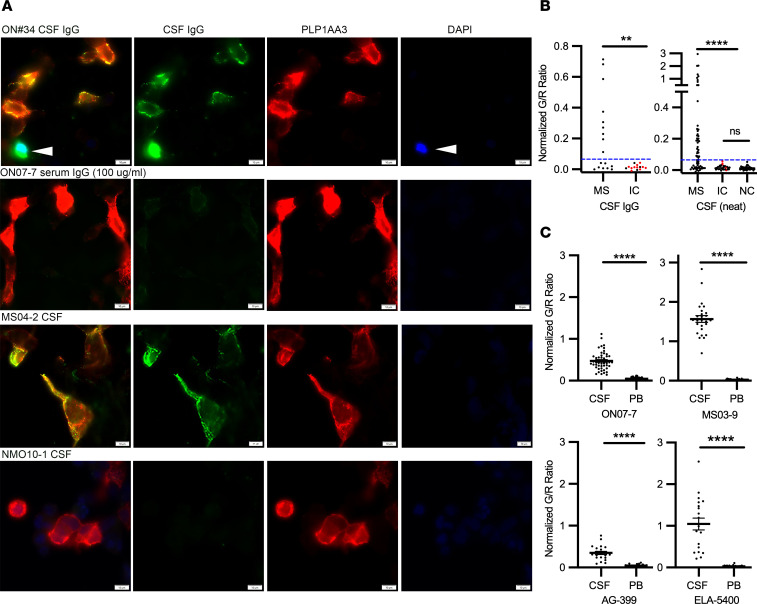
B cell clonal expansion and cerebrospinal fluid (CSF) oligoclonal IgG bands are established features of the immune response in multiple sclerosis (MS). Clone-specific recombinant monoclonal IgG1 Abs (rAbs) derived from MS patient CSF plasmablasts bound to conformational proteolipid protein 1 (PLP1) membrane complexes and, when injected into mouse brain with human complement, recapitulated histologic features of MS pathology: oligodendrocyte cell loss, complement deposition, and CD68+ phagocyte infiltration. Conformational PLP1 membrane epitopes were complex and governed by the local cholesterol and glycolipid microenvironment. Abs against conformational PLP1 membrane complexes targeted multiple surface epitopes, were enriched within the CSF compartment, and were detected in most MS patients, but not in inflammatory and noninflammatory neurologic controls. CSF PLP1 complex Abs provide a pathogenic autoantibody biomarker specific for MS.

Keywords: Antigen; Autoimmunity; Immunoglobulins; Multiple sclerosis; Neuroscience.


Figures

Figure 1
Figure 1. Myelin-specific rAbs initiate complement-dependent oligodendrocyte cell death.
(AC) EGFP immunofluorescence in brain sections of C57BL/6 PLP-EGFP mice following ICI of myelin-specific (MS#30, ON#34) or IC (2B4) rAbs with HC. (Left panels) Amorphous regions of EGFP+ oligodendrocyte loss at 72 hours after injection are demarcated by the dotted lines. Asterisks indicate injection site. (Center panels) Higher magnification images of boxed areas reveal a sharp demarcation between areas of complete oligodendrocyte loss and adjacent normal-appearing tissue. (Right panels) CD68+ microglia/macrophages accumulate within the lesion core. Scale bars: 1 mm (left and right); 50 µm (center). (D) Quantitation of the area of EGFP+ oligodendrocyte cell loss (4–6 animals per injection) for IC (2B4, IC#2) rAbs plus HC, myelin-specific (MS#30, ON#34) rAbs plus HC, and myelin-specific ON#34 rAb minus HC (–HC) (Kruskal-Wallis 1-way ANOVA with Dunn’s correction for multiple comparisons, *P < 0.05; ***P < 0.001; ON#34 +/– HC, Mann-Whitney U test, **P < 0.01). (E) High-magnification image of ON#34 rAb without HC (ON#34 – HC) ICI shows a minor loss of EGFP+ oligodendrocyte cell loss at the injection site. Scale bar: 50 µm. (F) Quantitation of CD68+DAPI+ cell density (per subcortical hemisphere) at 72 hours after injection following ICI of rAbs 2B4, MS#30, or ON#34, plus HC (ANOVA with Dunn’s correction for multiple comparisons, **P < 0.01).
Figure 2
Figure 2. MS rAbs bind to myelinated axons and the surface of live differentiated CG4 oligodendrocytes.
(A) MS (MS#30, ON#49, and ON#34) and IC (2B4) rAb (20 μg/ml) immunofluorescence in murine cerebellum. Original magnification, ×200. (B) MS rAbs MS#30, ON#49, and ON#34 and control IC#2 rAb immunofluorescence on live CG4 rat oligodendrocyte cultures 48 hours after differentiation. Original magnification, ×400. All sections are counterstained with DAPI.
Figure 3
Figure 3. MS rAbs bind to the surface of PLP1-transfected cells.
(A) Live-cell binding of myelin-specific rAbs (MS#30, ON#49, and ON#34) to CHOK1 cells transfected with MOG or PLP1 expression vector plasmid DNA at 24 hours after transfection. Live-cell staining with MOG-specific 8-18C5 mAbs (10 µg/ml) or PLP1-specific O10 mAbs (1:2 dilution of hybridoma supernatant) serve as positive controls. Scale bars: 25 µm. (B) Live-cell immunofluorescence (×600) of IC and myelin-specific MS rAbs (MS#30, ON#49, ON#34, and MS#11) in HEKE cells expressing PLP1. Human rAb binding is shown in green (rAb) and staining with an intracellular epitope-specific PLP1 mAb (plp1c or AA3) is shown in red (PLP1).
Figure 4
Figure 4. Myelin-specific MS rAbs do not bind myelin or mediate oligodendrocyte cell death in PLP1-null animals.
(A) Cerebellar sections from WT (PLPy/+) and null (PLPy/–) male EGFP-PLP knockin mice were stained with myelin-specific MS rAbs (MS#30, ON#49, ON34), anti-PLP1 mAb AA3 (PLP1), and anti-MOG 8-18C5 mAbs. Scale bars: 50 µm. (B) EGFP+ immunofluorescence (×100) in murine brain following ICI of MS#30 or ON#34 rAbs with HC into male WT (PLPy/+) and hemizygous null (PLPy/–) EGFP-PLP knockin mice. Quantitation of the area of oligodendrocyte loss in PLPy/+ and PLPy/– animals injected with MS#30 plus HC (n = 6 PLPy/+ and 7 PLPy/ ICIs) and ON#34 plus HC (n = 4 PLPy/+ and 4 PLPy/– ICIs) (Mann-Whitney U test, *P < 0.05; **P < 0.01).
Figure 5
Figure 5. Myelin-specific MS rAbs recognize complex PLP1 antigens.
(A) Schematic of extracellular and intracellular mutations introduced into PLP1. (B) Immunofluorescence images of MS#30 (20 µg/ml), ON#34 (40 µg/ml), ON#49 (50 µg/ml), and MS#11 (100 µg/ml) rAb binding to live cells expressing WT PLP1 or PLP1 containing mutations in the second extracellular domain (C200A/C219A) or N-terminal cysteines (C5S/C6S/C9S). Scale bars: 5 μm. (C) Quantitative assay shows absence of IC#2 rAb binding (μg/ml) to live cells expressing WT PLP1. (D) Quantitative binding (mean ± SEM) of MS#30, ON#34, ON#49, and MS#11 rAbs (μg/ml) to cells expressing WT or mutated PLP1. Apparent KD are reported for each experimental curve.
Figure 6
Figure 6. Binding of MS rAbs to purified myelin.
(A) ELISA demonstrating differential binding of control PLP1-specific AA3 mAbs to PLP1 WT (+/+) and null (y/–) myelin. (B) MS rAb binding (mean ± SD) to purified myelin from WT and null PLP1 animals was measured by ELISA. (C) IC rAb IC#2 binding curve to WT myelin is shown as a negative control.
Figure 7
Figure 7. Sulfatide and cholesterol levels modify binding of MS rAbs to PLP1-expressing cells.
(A) Quantitation and representative images of ON#34 rAb binding to PLP1+ CHOK1 cells coexpressing sulfatide (O4) or galc (O1). Scale bars: 20 μm. The binding intensity ratio of ON#34 rAb (green, G) to PLP1 mAb (red, R) (G/R ratio) is plotted (median ± 95% CI) for single PLP1+ cells (n = 19 PLP1+O4+ and 131 PLP1+O4 cells; n = 52 PLP1+O1 and 65 PLP1+O1+ cells) and significance established using Welch’s t test. White arrowheads on images identify ON#34+O4+PLP1+ cells. (B) Representative images and quantitation of MS#11 rAb binding to PLP1+ CHOK1 cells coexpressing sulfatide or galc. The ratio of MS#11 (green) to PLP (red) is plotted (median ± 95% CI) for PLP1+ cells binned according to O4 (n = 161 PLP1+O4 and 45 PLP1+O4+ cells) or O1 expression (n = 145 PLP1+O1 and 34 PLP1+O1+ cells) and significance established using Welch’s t test. White arrowheads identify MS#11O4+PLP1+ and gold arrowheads MS#11+O4PLP1+ cells. (C) The binding ratios of MS#30 (green) or ON#49 (green) to PLP (red) are plotted (median ± 95% CI) for PLP1-expressing CHOK1 cells binned for O4 expression (MS#30: n = 127 PLP1+O4 and 18 PLP1+O4+ cells; ON#49: n = 249 PLP1+O4 and 50 PLP1+O4+ cells). Significance was established using Welch’s t test. (D) Quantification (mean ± SEM) of the percentage of PLP1AA3-expressing cells positive for MS rAb staining (determined by G/R ratio) according to the visual presence or absence of coincident O4 mAb staining. Values represent measurements from 4 to 5 independent experiments per MS rAb. *P < 0.05; **P < 0.01; ***P < 0.001; **** P < 0.0001, Welch’s t test.
Figure 8
Figure 8. Cholesterol affects binding of MS rAbs to PLP1-expressing cells.
(A) Representative images of ON#34 rAb binding to PLP1-transfected CHOK1 cells following 30-minute treatment with vehicle (RPMI), 5 mM BMCD, or 5 mM ΒMCD preloaded with cholesterol (CHOL). Scale bars: 20 µm. (B) Quantitation (mean ± SEM) of background-corrected ratios of MS rAb to PLPAA3 signal normalized to RPMI control binding. Data are represented as ratios of replicate images obtained from more than 3 independent transfection experiments. Significance was determined using ANOVA with Dunnett’s correction for multiple comparisons. **P < 0.01; *** P < 0.001; **** P < 0.0001.
Figure 9
Figure 9. Detection of conformational PLP1-specific Abs in MS and control CSF.
(A) PLP1 and human IgG immunofluorescence on live PLP1-transfected HEKPE7 and cholesterol-treated cells 24 hours after transfection using CSF IgG (100 µg/ml), CSF neat, or serum IgG from MS or inflammatory control patients. Following cholesterol treatment, live-cell cultures were treated with DAPI (arrowheads) to identify dead cells. Scale bars: 20 µm. (B) Normalized and background-corrected mean ratios of green/red immunofluorescence signal (G/R) to single or small clusters of PLP1-transfected cells are shown for cohorts of clinically definite MS (n = 79), infectious (red circles) and noninfectious inflammatory neurologic controls (IC, n = 45), and noninflammatory neurologic controls (NC, n = 39) using either purified CSF IgG or CSF neat. Blue dashed lines indicate values 3 SDs above the mean of IC binding and distinguished positive from negative PLP1 binding. No significant differences in the mean G/R ratio were observed in the populations comprising IC CSF IgG (G/R = 0.015 ± 0.015), IC CSF (G/R = 0.016 ± 0.013) and noninflammatory neurologic controls (G/R = 0.013 ± 011). Fisher’s exact test was used to compare distributions between MS and control patients for each cohort; **P < 0.01; ****P < 0.0001. (C) Normalized ratios of green/red immunofluorescence signal (G/R) for PLP1-transfected cells incubated with the same IgG concentrations of serum or CSF from 4 PLP1+ MS patients. The ratio of mean CSF and serum-binding titers were greater than 8.2 for each patient, indicative of intrathecal synthesis of PLP1 complex–specific Abs. Statistical comparisons of replicate measurements from 2 to 3 independent transfections were made using Welch’s t test. ****P < 0.0001. Data are represented as means and SD.

References

    1. Lucchinetti C, et al. Heterogeneity of multiple sclerosis lesions: implications for the pathogenesis of demyelination. Ann Neurol. 2000;47(6):707–717. doi: 10.1002/1531-8249(200006)47:6<707::AID-ANA3>3.0.CO;2-Q. - DOI - PubMed
    1. Popescu BF, Lucchinetti CF. Meningeal and cortical grey matter pathology in multiple sclerosis. BMC Neurol. 2012;12:11. doi: 10.1186/1471-2377-12-11. - DOI - PMC - PubMed
    1. Lucchinetti CF, et al. Inflammatory cortical demyelination in early multiple sclerosis. N Engl J Med. 2011;365(23):2188–2197. doi: 10.1056/NEJMoa1100648. - DOI - PMC - PubMed
    1. Van Sande M, et al. [Further findings in the electrophoretic study of cerebrospinal fluid proteins in multiple sclerosis] Acta Neurol Psychiatr Belg. 1959;59:762–771. - PubMed
    1. Cepok S, et al. Patterns of cerebrospinal fluid pathology correlate with disease progression in multiple sclerosis. Brain. 2001;124(pt 11):2169–2176. doi: 10.1093/brain/124.11.2169. - DOI - PubMed

Publication types