. 2023 Aug 11;72(32):866-870.
doi: 10.15585/mmwr.mm7232a3.

Long COVID and Significant Activity Limitation Among Adults, by Age - United States, June 1-13, 2022, to June 7-19, 2023

Long COVID and Significant Activity Limitation Among Adults, by Age - United States, June 1-13, 2022, to June 7-19, 2023

Nicole D Ford et al. MMWR Morb Mortal Wkly Rep. .

Abstract

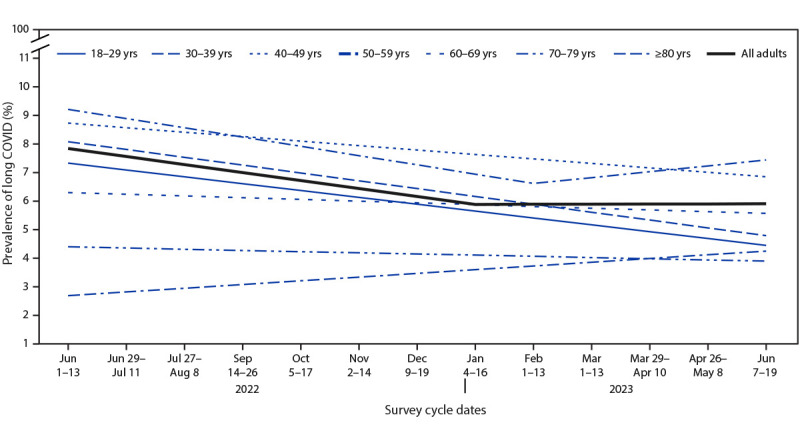
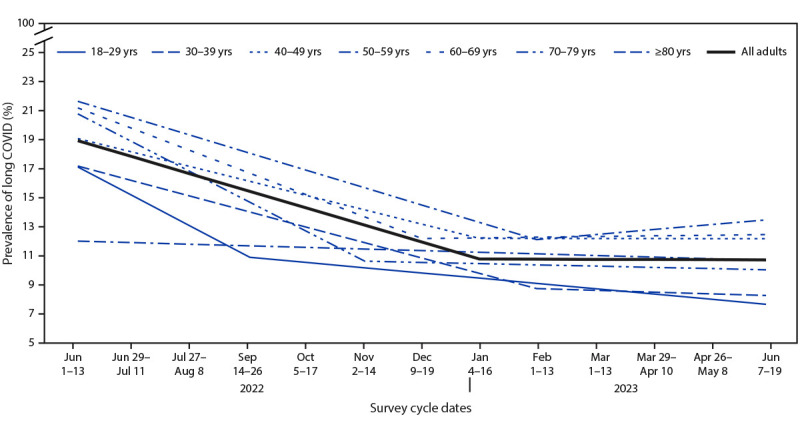
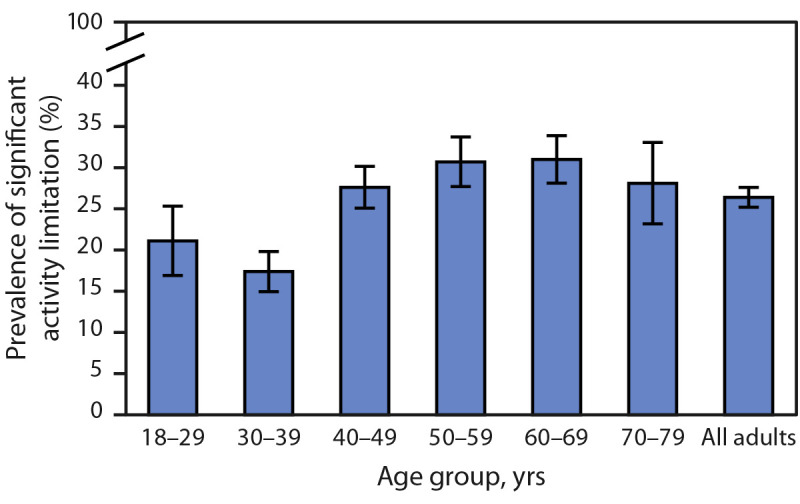
Long COVID is a condition encompassing a wide range of health problems that emerge, persist, or return following COVID-19. CDC analyzed national repeat cross-sectional Household Pulse Survey data to estimate the prevalence of long COVID and significant related activity limitation among U.S. adults aged ≥18 years by age group. Data from surveys completed between June 1-13, 2022, and June 7-19, 2023, indicated that long COVID prevalence decreased from 7.5% (95% CI = 7.1-7.9) to 6.0% (95% CI = 5.7-6.3) among the overall U.S. adult population, irrespective of history of previous COVID-19, and from 18.9% (95% CI = 17.9-19.8) to 11.0% (95% CI = 10.4-11.6) among U.S. adults reporting previous COVID-19. Among both groups, prevalence decreased from June 1-13, 2022, through January 4-16, 2023, before stabilizing. When stratified by age, only adults aged <60 years experienced significant rates of decline (p<0.01). Among adults reporting previous COVID-19, prevalence decreased among those aged 30-79 years through fall or winter and then stabilized. During June 7-19, 2023, 26.4% (95% CI = 24.0-28.9) of adults with long COVID reported significant activity limitation, the prevalence of which did not change over time. These findings help guide the ongoing COVID-19 prevention efforts and planning for long COVID symptom management and future health care service needs.


Conflict of interest statement

All authors have completed and submitted the International Committee of Medical Journal Editors form for disclosure of potential conflicts of interest. Douglas Slaughter reports volunteering with the Hood Medicine Initiative during the COVID-19 pandemic. No other potential conflicts of interest were disclosed.

Figures

FIGURE 1
FIGURE 1
Trend lines for the prevalence of self-reported long COVID among all adults, by age group — Household Pulse Survey, United States, June 1–June 13, 2022 to June 7–June 19, 2023† Abbreviation: HPS = Household Pulse Survey. * Estimate for all adults (slope for June 1–13, 2022 to January 4–16, 2023 = –0.28, p = 0.001; slope for January 4–16, 2023 to June 7–19, 2023 = 0.006, p = 0.95). Estimates of rate of change by age group: 18–29 years (slope for June 1–13, 2022 to June 7–19, 2023 = –0.24, p<0.001); 30–39 years (slope for June 1–13, 2022 to June 7–19, 2023 = –0.27, p<0.001); 40–49 years (slope for June 1–13, 2022 to June 7–19, 2023 = –0.16, p = 0.003); 50–59 years (slope for June 1–13, 2022 to February 1–13, 2023 = –0.32, p = 0.001; slope for February 1–13, 2023 to June 7–19, 2023 = 0.21, p = 0.22); 60–69 years (slope for June 1–13, 2022 to June 7–19, 2023 = –0.06, p = 0.18); 70–79 years (slope for June 1–13, 2022 to June 7–19, 2023 = –0.04, p = 0.40); and ≥80 years (slope for June 1–13, 2022 to June 7–19, 2023 = 0.13, p = 0.13). No HPS data were collected during the 2-week period August 24–September 13, 2022, or during November 30–December 8, 2022.
FIGURE 2
FIGURE 2
Trend lines for the prevalence of self-reported long COVID among adults with reported previous COVID-19, by age group — Household Pulse Survey, United States, June 1–June 13, 2022, to June 7–June 19, 2023 Abbreviation: HPS = Household Pulse Survey. * Estimate for all adults (slope for June 1–13, 2022 to January 4–16, 2023 = –1.16, p<0.001; slope for January 4–16, 2023 to June 7–19, 2023 = –0.01, p = 0.91). Estimates of rate of change by age group: 18–29 years (slope for June 1–13, 2022 to September 14–26, 2022= –2.07, p = 0.07; slope for September 14–26, 2022 to June 7–19, 2023 = –0.36, p = 0.04); 30–39 years (slope for June 1–13, 2022 to February 1–13, 2023 = –1.05, p<0.001; slope for February 1–13, 2023 to June 7–19, 2023 = –0.12, p = 0.76); 40–49 years (slope for June 1–13, 2022 to January 4–16, 2023 = –0.98, p<0.001; slope for January 4–16, 2023 to June 7–19, 2023 = –0.005, p = 0.98); 50–59 years (slope for June 1–13, 2022 to February 1–13, 2023 = –1.19, p<0.001; slope for February 1–13, 2023 to June 7–19, 2023 = 0.34, p = 0.15); 60–69 years (slope for June 1–13, 2022 to December 9–19, 2022 = –1.50, p<0.001; slope for December 9–19, 2022 to June 7–19, 2023 = 0.05, p = 0.8); 70–79 years (slope for June 1–13, 2022 to November 2–14, 2022 = –2.03, p = 0.04; slope for November 2–14, 2022 to June 7–19, 2023 = –0.09, p = 0.75); and ≥80 years (slope for June 1–13, 2022 to June 7–19, 2023 = –0.11, p = 0.73). No HPS data were collected during the 2-week period August 24–September 13, 2022, or during November 30–December 8, 2022.
FIGURE 3
FIGURE 3
Prevalence of significant activity limitation among adults reporting long COVID — Household Pulse Survey, United States, June 7–19, 2023 Abbreviation: NCHS = National Center for Health Statistics. * With 95% CIs represented by error bars. Estimates for the adults aged ≥80 years do not meet NCHS Data Presentation Standards and are not included in the figure as a separate group; however, they are included in the estimate for all adults.

References

    1. Nittas V, Gao M, West EA, et al. Long COVID through a public health lens: an umbrella review. Public Health Rev 2022;43:1604501. 10.3389/phrs.2022.1604501 - DOI - PMC - PubMed
    1. Tartof SY, Malden DE, Liu IA, et al. Health care utilization in the 6 months following SARS-CoV-2 infection. JAMA Netw Open 2022;5:e2225657–2225657. 10.1001/jamanetworkopen.2022.25657 - DOI - PMC - PubMed
    1. Walker S, Goodfellow H, Pookarnjanamorakot P, et al. Impact of fatigue as the primary determinant of functional limitations among patients with post-COVID-19 syndrome: a cross-sectional observational study. BMJ Open 2023;13:e069217. 10.1136/bmjopen-2022-069217 - DOI - PMC - PubMed
    1. Howe S, Szanyi J, Blakely T. The health impact of long COVID during the 2021–2022 Omicron wave in Australia: a quantitative burden of disease study. Int J Epidemiol 2023;52:677–89. 10.1093/ije/dyad033 - DOI - PMC - PubMed
    1. Al-Aly Z. Prevention of long COVID: progress and challenges. Lancet Infect Dis 2023;23:776–7. 10.15585/mmwr.mm7117e3 - DOI - PMC - PubMed