. 2023 Aug 10;18(8):e0289637.
doi: 10.1371/journal.pone.0289637. eCollection 2023.

Space-time POD and the Hankel matrix

Affiliations

Space-time POD and the Hankel matrix

Peter Frame et al. PLoS One. .

Abstract

Time-delay embedding is an increasingly popular starting point for data-driven reduced-order modeling efforts. In particular, the singular value decomposition (SVD) of a block Hankel matrix formed from successive delay embeddings of the state of a dynamical system lies at the heart of several popular reduced-order modeling methods. In this paper, we show that the left singular vectors of this Hankel matrix are a discrete approximation of space-time proper orthogonal decomposition (POD) modes, and the singular values are square roots of the POD energies. Analogous to the connection between the SVD of a data matrix of snapshots and space-only POD, this connection establishes a clear interpretation of the Hankel modes grounded in classical theory, and we gain insights into the Hankel modes by instead analyzing the equivalent discrete space-time POD modes in terms of the correlation matrix formed by multiplying the Hankel matrix by its conjugate transpose. These insights include the distinct meaning of rows and columns, the implied norm in which the modes are optimal, the impact of the time step between snapshots on the modes, and an interpretation of the embedding dimension/height of the Hankel matrix in terms of the time window on which the modes are optimal. Moreover, the connections we establish offer opportunities to improve the convergence and computation time in certain practical cases, and to improve the accuracy of the modes with the same data. Finally, popular variants of POD, namely the standard space-only POD and spectral POD, are recovered in the limits that snapshots used to form each column of the Hankel matrix represent flow evolution over short and long times, respectively.


Conflict of interest statement

The authors have declared that no competing interests exist.

Figures

Fig 1
Fig 1. The height of the Hankel matrix d, along with the time step Δt between snapshots, determines the time window T over which the space-time correlation C of the system is accounted for in the Hankel singular modes.
Shorter Hankel matrices, therefore, severely truncate the correlations, whereas taller Hankel matrices retain more of these correlations.
Fig 2
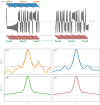
Fig 2. Uncorrelated columns (left) and Hankel (right) approaches to approximating the correlation matrix from short (b,c) and long (d,e) time series.
(a) A time series used to sample temporal realizations with different samplings. (b) Correlations from uncorrelated columns using a short time series. (c) Correlations from the Hankel matrix using the short times series. (d) Correlations from uncorrelated columns using a long time series. (e) Correlations from a Hankel matrix using the long time series. Though both (d) and (e) are accurate, the correlations in (d) come at significantly lower computational cost.
Fig 3
Fig 3. The dimensions of the Hankel matrix can be interpreted in terms of the integral space-time eigenvalue problem (33).
The height of the Hankel matrix corresponds to T, the length on which the space-time POD modes optimally represent the flow. The width, though there is subtlety about independence, informs how accurately the correlation matrix is approximated, and hence the accuracy of the modes.
Fig 4
Fig 4. Schematic of the lid-driven cavity flow.
The lid moves to the right and drives the flow. Contours show a snapshot of the turbulent kinetic energy.
Fig 5
Fig 5. Convergence of the modes with the width m of the matrix: (blue) Hankel matrix; (red) uncorrelated data matrix.
The modes from the uncorrelated data matrix converge faster than those from the Hankel matrix. This improved convergence is observed because the columns of the uncorrelated data matrix represent data from more of the attractor than the columns of the Hankel matrix of the same size.
Fig 6
Fig 6. Similarity between modes from a downsampled Hankel matrix, retaining m/mH columns, and the Hankel modes.
Both the mean (solid) and the median (dashed) are reported for the 200 trials. The first mode (blue) and the second mode (red) are more similar than the third mode (green). For the parameters used, retaining 1/10 and 1/5 of the columns yields modes that capture over 97% and 99.9% of the energy of the Hankel modes, respectively, for both the first and second modes, on average (mean).
Fig 7
Fig 7. Convergence of space-time POD modes ϕT to space-only POD modes ϕ for small T.
The spatial dependence of the first space-time mode at each T is compared to the first space-only mode using the space-only inner product, averaged over the time evolution of the space-time mode.
Fig 8
Fig 8. Convergence of space-time POD to spectral POD, visualized in terms of the power spectral density of the space-time POD modes for various values of T: (blue) T = 50; (red) T = 100; (green) T = 200; (purple) T = 400.
As T is increased, more and more of the energy of the modes is contained to an increasingly narrow band of frequencies, indicating convergence toward a discrete frequency, consistent with the time dependence of SPOD modes.
Fig 9
Fig 9. PDFs of energy captured by the first modes of the Hankel (blue) and Toeplitz (red) methods for various choices of m, d, and N.
Both methods use the same time series of length m + d − 1 to approximate the modes. The PDFs are calculated with 1000 samples and the energies are divided by the maximum possible energy of one mode. These parameter values are, (a): m = 30, d = 30, N = 1. (b): m = 100, d = 30, N = 1. (c): m = 300, d = 30, N = 1. (d): m = 300, d = 30, N = 3. (e) m = 600, d = 30, N = 3. (f) m = 10, d = 10, N = 1.
Fig 10
Fig 10. Mean (circles) and median (squares) accuracy of Hankel modes (blue) vs. Toeplitz modes (red) calculated from 1000 time series of the most energetic N points of the lid-driven cavity flow.
Accuracy is measured as the square inner product against a ‘true mode.’ When the data is severely limited (m is relatively small), the difference is more pronounced.
Fig 11
Fig 11. PDFs of the energy captured by the first four modes of the Toeplitz and Hankel methods, normalized by the maximum possible energy by four modes.
These are calculated for m = 30, d = 30, N = 1. The difference is more severe for the latter modes, which we observed for the majority of the parameter choices that we tested.

References

    1. C. Rowley, T. Colonius, and R. Murray, POD based models of self-sustained oscillations in the flow past an open cavity, AIAA Paper #2000-1969.
    1. Fazel M., Pong T. K., Sun D., and Tseng P., Hankel matrix rank minimization with applications to system identification and realization, SIAM J. Matrix Anal. Appl, 34 (2013), pp. 946–977. doi: 10.1137/110853996 - DOI
    1. Silverman L., Realization of linear dynamical systems, IEEE Trans. Automat. Contr., 16 (1971), pp. 554–567. doi: 10.1109/TAC.1971.1099821 - DOI
    1. Vautard R. and Ghil M., Singular spectrum analysis in nonlinear dynamics, with applications to paleoclimatic time series, Phys. D, 35 (1989), pp. 395–424. doi: 10.1016/0167-2789(89)90077-8 - DOI
    1. Juang J.-N. and Pappa R. S., An eigensystem realization algorithm for modal parameter identification and model reduction, J. Guid. Control Dyn., 8 (1985), pp. 620–627. doi: 10.2514/3.20031 - DOI