. 2023 Aug 11;381(6658):eade6289.
doi: 10.1126/science.ade6289. Epub 2023 Aug 11.

A genome-wide genetic screen uncovers determinants of human pigmentation

Affiliations

A genome-wide genetic screen uncovers determinants of human pigmentation

Vivek K Bajpai et al. Science. .

Abstract

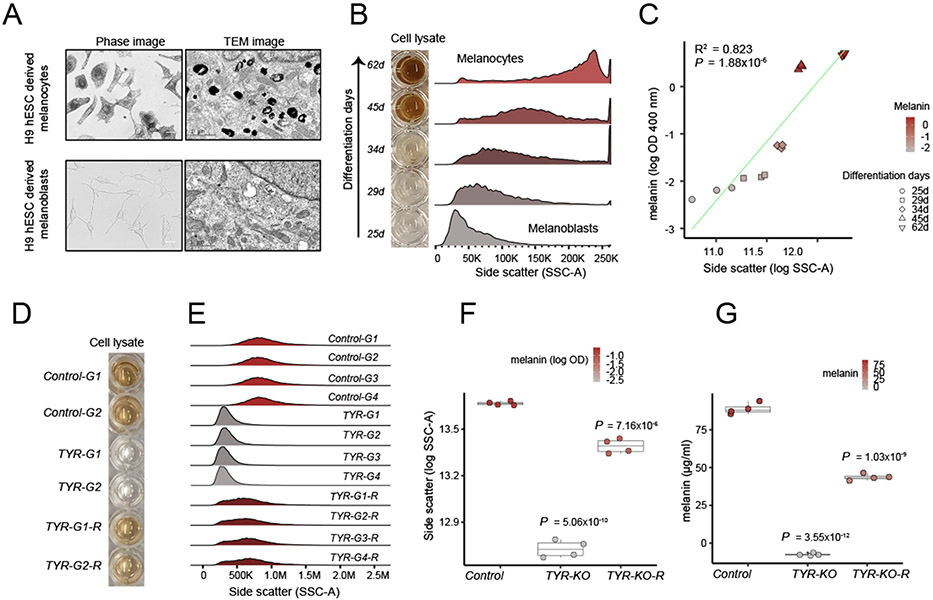
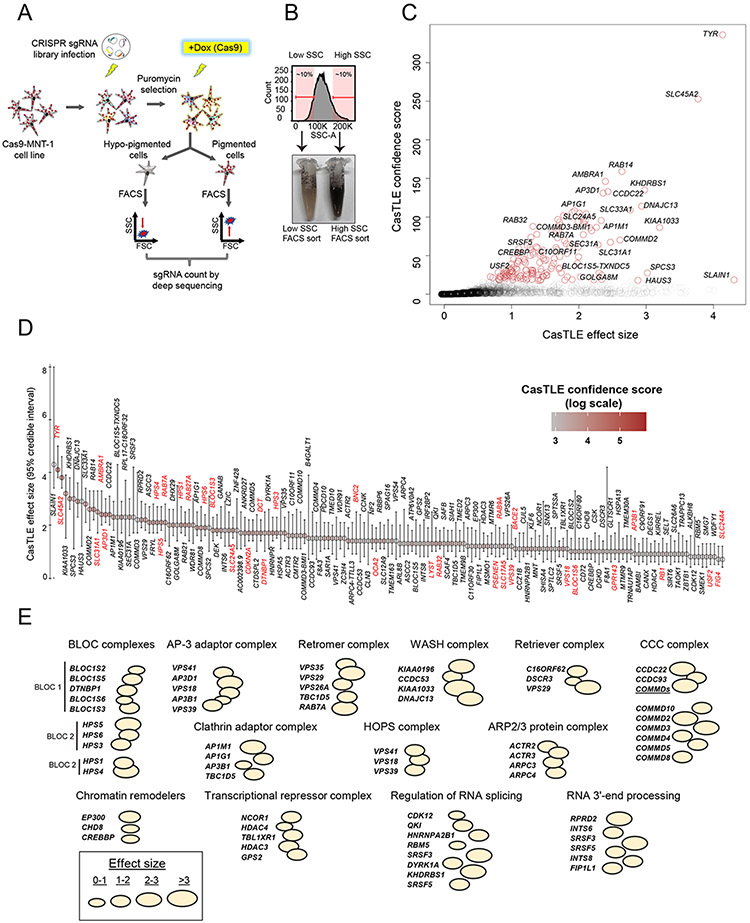
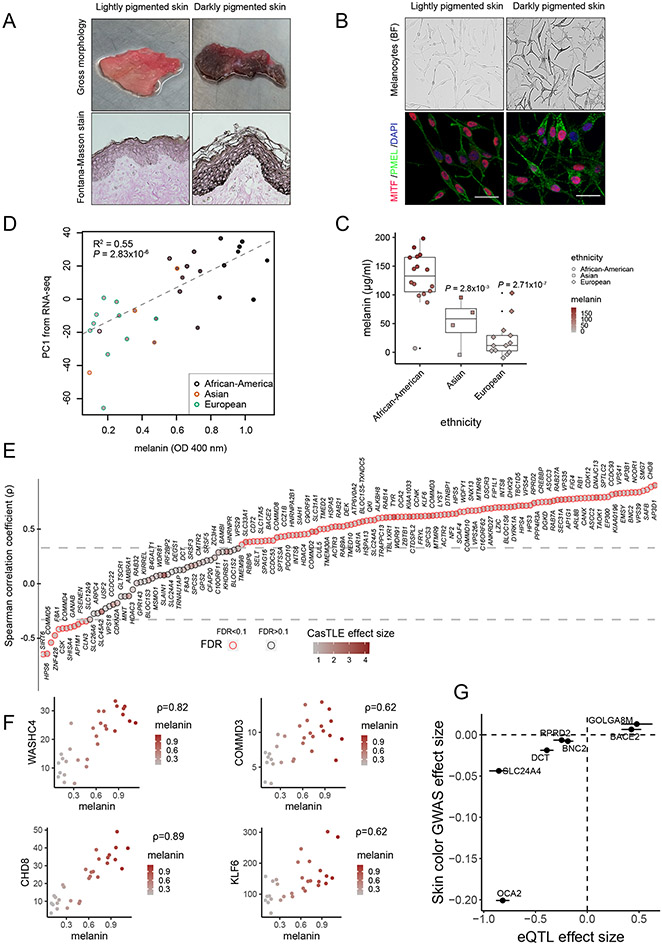
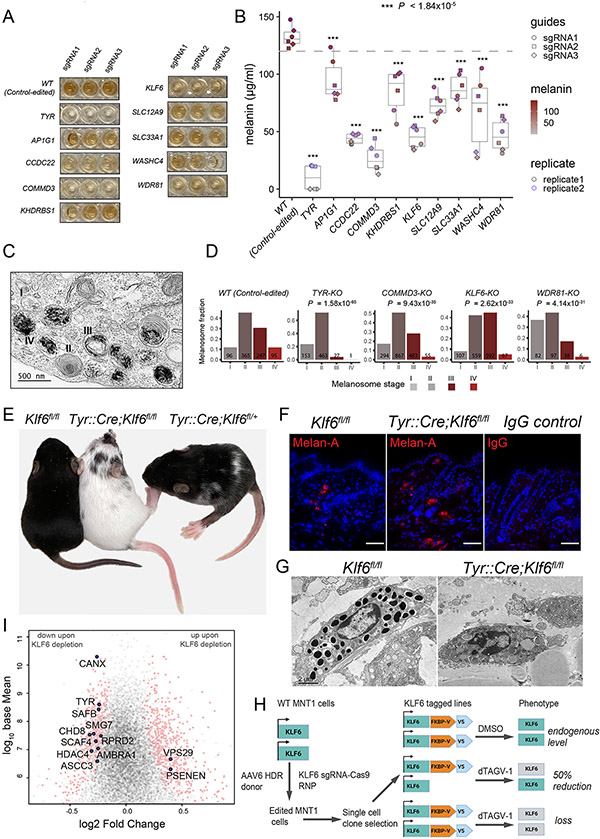
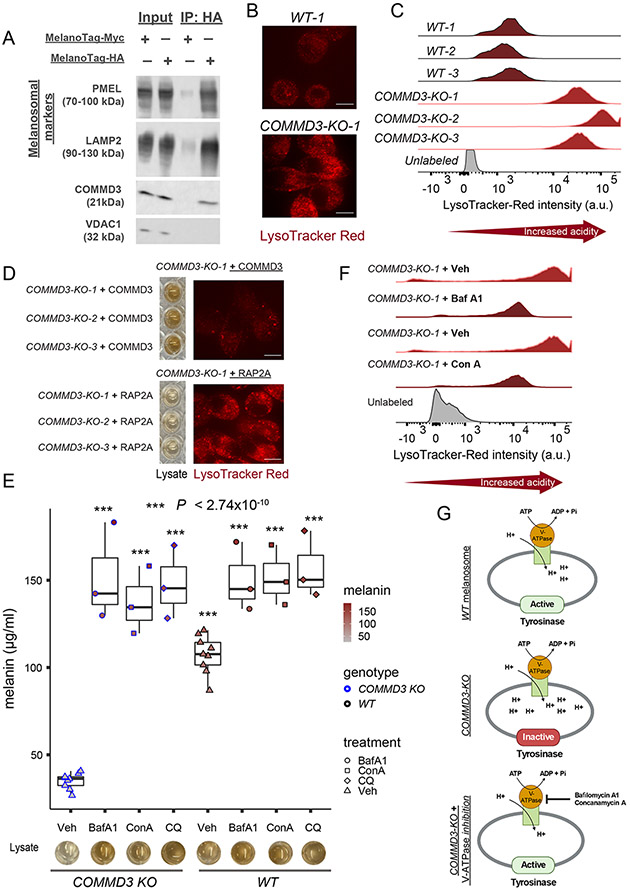
Skin color, one of the most diverse human traits, is determined by the quantity, type, and distribution of melanin. In this study, we leveraged the light-scattering properties of melanin to conduct a genome-wide screen for regulators of melanogenesis. We identified 169 functionally diverse genes that converge on melanosome biogenesis, endosomal transport, and gene regulation, of which 135 represented previously unknown associations with pigmentation. In agreement with their melanin-promoting function, the majority of screen hits were up-regulated in melanocytes from darkly pigmented individuals. We further unraveled functions of KLF6 as a transcription factor that regulates melanosome maturation and pigmentation in vivo, and of the endosomal trafficking protein COMMD3 in modulating melanosomal pH. Our study reveals a plethora of melanin-promoting genes, with broad implications for human variation, cell biology, and medicine.


Figures

Fig.1.
Fig.1.. Melanin concentration determines light scattering property of pigment cells.
(A) Differentiation of H9 human embryonic stem cell (hESC)– derived melanoblasts (bottom) into melanocytes (top) results in increased melanized stage III to IV melanosomes as shown by phase and transmission electron microscopy (n = 3 independent differentiations). Scale bars; phase images, 25 μm; TEM images, 1 μm. (B) Increased melanin concentration during melanocyte differentiation from hESC (days of differentiation are indicated on the left) is accompanied by an increase in light scattering as measured by the SSC parameter of flow cytometer. (C) Relationship between melanin (log OD 400 nm) and SSC as modeled by linear regression. R2 = 0.823, P = 1.88 × 10⁻⁶. (D) CRISPR-Cas9–mediated loss of TYR gene makes pigmented MNT-1 melanoma cells amelanotic and reexpression of TYR transgene recovers the pigmentation (n = 4 sgRNAs treatments). Cell lysates from two representative delete-and- rescue experiments are shown. (E) TYR loss significantly reduces the SSC, and TYR re-expression restores it. Four different sgRNAs against TYR and control sgRNAs are labeled as G1, G2, G3 and G4. (F) Boxplot showing SSC (log SSC) changes in response to TYR loss and rescue in comparison with control-edited cells. The color within the dots corresponds to total melanin (log OD at 400 nm). Box plots show median and IQR; whiskers are 1.5x interquartile range (IQR). Significance was tested for control, TYR-KO, and TYR-KO-R groups with analysis of variance (ANOVA), followed by a two-sided Welch t test with Benjamini and Hochberg (BH) correction. P values shown are relative to control. (G) Total melanin concentration calculated for loss and rescue of TYR (tyrosinase) experiment (n = 4 sgRNAs treatment). Box plots show median melanin concentration (micrograms per milliliter) and IQR; whiskers are 1.5x IQR. Significance was tested for four sgRNA and the TYR rescue treatment with ANOVA, followed by a two-sided Welch t-test with BH correction. P values shown are relative to control.
Fig. 2.
Fig. 2.. Genome-wide CRISPR-Cas9 screen for regulators of human melanogenesis.
(A) Schematic of the screen design. (B) FACS cell sorting on low and high SSC enriches hypopigmented and hyperpigmented cells, respectively. (C) CasTLE likelihood ratio test analysis of two independent genome-wide pigmentation screens. Genes at <10% FDR cutoff are indicated with brown circles. (D) The maximum effect size (center value) estimated with CasTLE from two independent genome-wide pigmentation screens with 10 independent sgRNAs per gene. Bars, 95% confidence interval. Melanogenesis regulators as sorted by CasTLE effect size. The colors indicate CasTLE confidence score (log scale). Previously known pigmentation genes are high- lighted in red. (E) Classification of screen hits on the basis of biological functions and presence in common macromolecular complexes. Bubble size indicates CasTLE effect size for the respective gene in the screen. Bubbles touching each other indicates that the proteins have been reported to make a physical protein complex, with the name of the complex and/or associated molecular function indicated on top.
Fig. 3.
Fig. 3.. Pigmentation screen hits are differentially expressed in melanocytes of distinctly pigmented individuals.
(A) Gross morphology of foreskin tissue obtained from diversely pigmented human donors. Fontana-Masson (FM) staining shows melanin pigment (black) in epidermis. (B) Brightfield (BF) and immuno- fluorescence (IF) images of melanocytes confirm differential pigment levels and presence of melanocyte markers MITF (red) and PMEL (green). DNA, blue. (C) Melanin quantification of melanocytes derived from diversely pigmented individuals. Box plots show median; whiskers are 1.5x IQR. Significance tested with ANOVA followed by two-sided Welch t-test with BH correction. (D) Correlation between RNA-seq gene expression profiles and melanin content of melanocytes. Plotted is melanin concentration (OD 400 nm) versus first principal component of the RNA-seq analysis from the same melanocytes. Ethnicity is indicated by the color of the outline of the plotting symbol. Fill color within each point represents measured melanin content. (E) Spearman’s r comparing relationship between TPM of candidate screen hits with melanin measurements in 30 melanocyte samples of diverse skin color. The intensity of brown color within each point indicates CasTLE effect size. Horizontal lines indicate (–0.33, 0.33) correlation coefficient cutoffs at <10% FDR. (F) Spearman’s ρ for selected CRISPR screen hits, with each point representing measurements from one human donor. Plotted is melanin OD at 400 nm (ordinate) versus RNA-seq expression level (TPM, abscissa). (G) Concordant effects of melanocyte eQTL and skin color GWAS for select melanin-promoting gene hits. For each of the indicated genes, the effect of a SNP’s alternate allele on that gene’s expression (defined as the slope of the eQTL; x axis) is plotted against the same allele’s effect on skin color from GWAS in white British individuals (β value from GWAS, where positive is associated with darker skin). Points and bars represent mean estimate ± standard error. Scale bars, (A) and (B), 25 μm.
Fig. 4.
Fig. 4.. Novel pigmentation genes affect different aspects of melanosome biogenesis and maturation.
(A) CRISPR- Cas9–based validation of select previously unidentified pigmentation screen hits along with negative (safe- targeting sgRNAs; wild type) and positive (TYR) controls. Cas9-MNT-1 cell lysates show gross changes in melanin levels upon deactivation of indicated genes using three different sgRNAs. (B) Boxplots show median melanin measurements for select gene knockouts and controls. P values relative to control-edited cells ranged from smallest 2.46 × 10⁻²⁰ (for TYR-KO cells) to largest 1.84 × 10⁻⁵ (for AP1G1-KO cells). ***P < 1.84 × 10⁻⁵. (C) Representative TEM image showing melanosomes at stages I to IV of maturation. (D) Quantification of melanosomes at different stages of maturation among different indicated gene deactivations. Total counts are shown on each bar. P values from c-squared test are shown. (E) KLF6 regulates melanosome maturation, and its loss leads to severe pigmentation defects in vivo. P15 mice pups with homozygous deletion of Klf6 (TyrCre::Klf6fl/fl) display loss of melanin in hair coat color, toes, and tail. Mice with heterozygous deletion of Klf6 (TyrCre::Klf6fl/+) display diffuse dilution of toe, tail, and hair coat color, and variegated white patches compared with those of control animals with no Tyr::Cre expression (Klf6fl/fl). (F) Immunohistochemistry of mouse skin shows presence of Melan-A–positive melanocytes in Klf6 null (TyrCre::Klf6fl/fl) and control (Klf6fl/fl) animals. (G) TEM images of mouse skin showing black melanosomes within the melanocytes of control (Klf6fl/fl) animals compared with the presence of immature melanosomes in Klf6 null (TyrCre::Klf6fl/fl) mouse skin. (H) Schematic diagram of KLF6 endogenous tagging at C-terminus with FKBP12F36V and V5 epitope. (I) RNA-seq volcano plot showing differentially expressed genes (highlighted in pink circles) in response to 24-hour dTAGv-1 treatment. Labeled genes (blue solid circles) are melanin-promoting genes discovered in CRISPR screen. Scale bars in (F), 25 μm; (C), 500 nm; and (G), 2 μm.
Fig. 5.
Fig. 5.. COMMD3 is enriched in melanosomes and regulates melanosomal pH.
(A) COMMD3 is enriched in purified melanosomes. Immunoblots showing whole-cell lysates (input), con- trol (MNT-1 cells expressing a Myc- MelanoTag), and purified melanosome (MNT-1 cells expressing HA-MelanoTag) immunoprecipitates (IP). Melanosomal markers PMEL and LAMP2 are enriched in purified melanosomes in comparison with mitochondrial marker VDAC1. (B) COMMD3-KO cells display high acidity (low pH) of endosomal organ- elles (e.g., melanosomes) as confirmed with live cell imaging using LysoTracker Red dye (n = 3 clones). (C) Flow cytometry histograms showing increased LysoTracker Red fluorescence intensity in COMMD3-KO clones compared with wild-type (control-edited) clonal cells (n = 3). (D) COMMD3, but not RAP2A (32) (an unrelated and constitutively expressed protein), overexpression in COMMD3-KO cells rescues both melanin production and reduced pH (n = 3). (E) COMMD3-KO phenotype is rescued by neutralizing melanosomal pH. V-ATPase proton pump inhibitors bafilomycin A1 (BafA1, 0.1 mM), concanamycin A (ConA, 0.1 mM), and chloroquine (CQ, 50 mM) raise the pH of melanosomes in comparison with vehicle (Veh, DMSO and H2O) controls and restore melanin production as shown with melanin quantification and cell lysates (n = 3). Significance tested by ANOVA and two-sided Welch t-test. ***, P < 2.74 × 10⁻¹⁰ (for all groups, relative to vehicle group). (F) Flow cytometry histograms showing decreased fluorescence intensity of LysoTracker Red in COMMD3-KO cells treated with BafA1 (0.1 mM) and ConA (0.1 mM) compared with vehicle control (Veh) treated cells (n=3). (G) Schematic diagram of putative COMMD3 function in melanosomes. COMMD3-KO cells fail to neutralize maturing stage III and IV melanosomes, affecting TYR enzymatic activity. Neutralizing (i.e., raising the pH) melanosomes by blocking V-ATPase proton pump restores TYR activity and melanogenesis. Scale bars in (B) and (D), 25 μm.

References

    1. Pavan WJ, Sturm RA, The Genetics of Human Skin and Hair Pigmentation. Annu Rev Genomics Hum Genet 20, 41–72 (2019). - PubMed
    1. Quillen EE et al. , Shades of complexity: New perspectives on the evolution and genetic architecture of human skin. Am J Phys Anthropol 168 Suppl 67, 4–26 (2019). - PubMed
    1. Rocha J, The Evolutionary History of Human Skin Pigmentation. J Mol Evol 88, 77–87 (2020). - PubMed
    1. Raposo G, Marks MS, Melanosomes--dark organelles enlighten endosomal membrane transport. Nature reviews. Molecular cell biology 8, 786–797 (2007). - PMC - PubMed
    1. Le L, Sires-Campos J, Raposo G, Delevoye C, Marks MS, Melanosome Biogenesis in the Pigmentation of Mammalian Skin. Integr Comp Biol 61, 1517–1545 (2021). - PMC - PubMed