. 2023 Aug 11;381(6658):eabq5693.
doi: 10.1126/science.abq5693. Epub 2023 Aug 11.

DNA methylation networks underlying mammalian traits

Amin Haghani #  1   2 Caesar Z Li #  3   4 Todd R Robeck  5 Joshua Zhang  1 Ake T Lu  1   2 Julia Ablaeva  6 Victoria A Acosta-Rodríguez  7 Danielle M Adams  8 Abdulaziz N Alagaili  9 Javier Almunia  10 Ajoy Aloysius  11 Nabil M S Amor  12 Reza Ardehali  13 Adriana Arneson  14   15 C Scott Baker  16 Gareth Banks  17 Katherine Belov  18 Nigel C Bennett  19 Peter Black  20 Daniel T Blumstein  21   22 Eleanor K Bors  16 Charles E Breeze  23 Robert T Brooke  24 Janine L Brown  25 Gerald Carter  26 Alex Caulton  27   28 Julie M Cavin  29 Lisa Chakrabarti  30 Ioulia Chatzistamou  31 Andreas S Chavez  26   32 Hao Chen  33 Kaiyang Cheng  34 Priscila Chiavellini  35 Oi-Wa Choi  36   37 Shannon Clarke  27 Joseph A Cook  38 Lisa N Cooper  39 Marie-Laurence Cossette  40 Joanna Day  41 Joseph DeYoung  36   37 Stacy Dirocco  42 Christopher Dold  5 Jonathan L Dunnum  38 Erin E Ehmke  43 Candice K Emmons  44 Stephan Emmrich  6 Ebru Erbay  45   46   47 Claire Erlacher-Reid  42 Chris G Faulkes  48   49 Zhe Fei  3   50 Steven H Ferguson  51   52 Carrie J Finno  53 Jennifer E Flower  54 Jean-Michel Gaillard  55 Eva Garde  56 Livia Gerber  57   58 Vadim N Gladyshev  59 Rodolfo G Goya  35 Matthew J Grant  60 Carla B Green  7 M Bradley Hanson  44 Daniel W Hart  19 Martin Haulena  61 Kelsey Herrick  62 Andrew N Hogan  63 Carolyn J Hogg  18 Timothy A Hore  64 Taosheng Huang  65 Juan Carlos Izpisua Belmonte  2 Anna J Jasinska  36   66   67 Gareth Jones  68 Eve Jourdain  69 Olga Kashpur  70 Harold Katcher  71 Etsuko Katsumata  72 Vimala Kaza  73 Hippokratis Kiaris  74 Michael S Kobor  75 Pawel Kordowitzki  76 William R Koski  77 Michael Krützen  78 Soo Bin Kwon  14   15 Brenda Larison  21   79 Sang-Goo Lee  59 Marianne Lehmann  35 Jean-François Lemaître  55 Andrew J Levine  80 Xinmin Li  81 Cun Li  82   83 Andrea R Lim  1 David T S Lin  84 Dana M Lindemann  42 Schuyler W Liphardt  85 Thomas J Little  86 Nicholas Macoretta  6 Dewey Maddox  87 Craig O Matkin  88 Julie A Mattison  89 Matthew McClure  90 June Mergl  91 Jennifer J Meudt  92 Gisele A Montano  5 Khyobeni Mozhui  93 Jason Munshi-South  94 William J Murphy  95   96 Asieh Naderi  74 Martina Nagy  97 Pritika Narayan  60 Peter W Nathanielsz  82   83 Ngoc B Nguyen  13 Christof Niehrs  98   99 Batsaikhan Nyamsuren  100 Justine K O'Brien  41 Perrie O'Tierney Ginn  70 Duncan T Odom  101   102 Alexander G Ophir  103 Steve Osborn  104 Elaine A Ostrander  63 Kim M Parsons  44 Kimberly C Paul  80 Amy B Pedersen  86 Matteo Pellegrini  105 Katharina J Peters  78   106 Jessica L Petersen  107 Darren W Pietersen  108 Gabriela M Pinho  21 Jocelyn Plassais  63 Jesse R Poganik  59 Natalia A Prado  109   110 Pradeep Reddy  2   111 Benjamin Rey  55 Beate R Ritz  80   112   113 Jooke Robbins  114 Magdalena Rodriguez  115 Jennifer Russell  104 Elena Rydkina  6 Lindsay L Sailer  103 Adam B Salmon  116 Akshay Sanghavi  71 Kyle M Schachtschneider  117   118   119 Dennis Schmitt  120 Todd Schmitt  62 Lars Schomacher  98 Lawrence B Schook  117   121 Karen E Sears  21 Ashley W Seifert  11 Aaron B A Shafer  122 Anastasia V Shindyapina  59 Melanie Simmons  43 Kavita Singh  123 Ishani Sinha  21 Jesse Slone  65 Russel G Snell  60 Elham Soltanmohammadi  74 Matthew L Spangler  107 Maria Spriggs  20 Lydia Staggs  42 Nancy Stedman  20 Karen J Steinman  124 Donald T Stewart  125 Victoria J Sugrue  64 Balazs Szladovits  126 Joseph S Takahashi  7   127 Masaki Takasugi  6 Emma C Teeling  128 Michael J Thompson  105 Bill Van Bonn  129 Sonja C Vernes  130   131 Diego Villar  132 Harry V Vinters  133 Ha Vu  14   15 Mary C Wallingford  70 Nan Wang  36   37 Gerald S Wilkinson  8 Robert W Williams  134 Qi Yan  2   3 Mingjia Yao  3 Brent G Young  52 Bohan Zhang  59 Zhihui Zhang  6 Yang Zhao  6 Peng Zhao  13   135 Wanding Zhou  136   137 Joseph A Zoller  3 Jason Ernst  14   15 Andrei Seluanov  138 Vera Gorbunova  138 X William Yang  36   37 Ken Raj  139 Steve Horvath  1   2   139
Affiliations

DNA methylation networks underlying mammalian traits

Amin Haghani et al. Science. .

Abstract

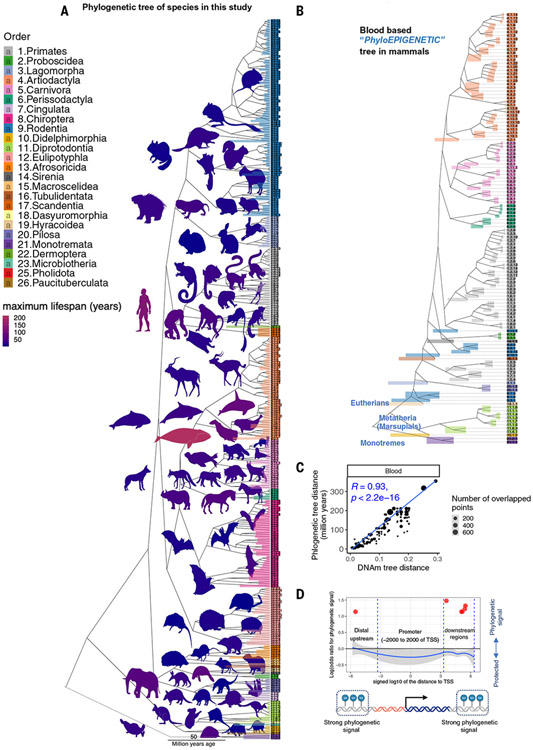
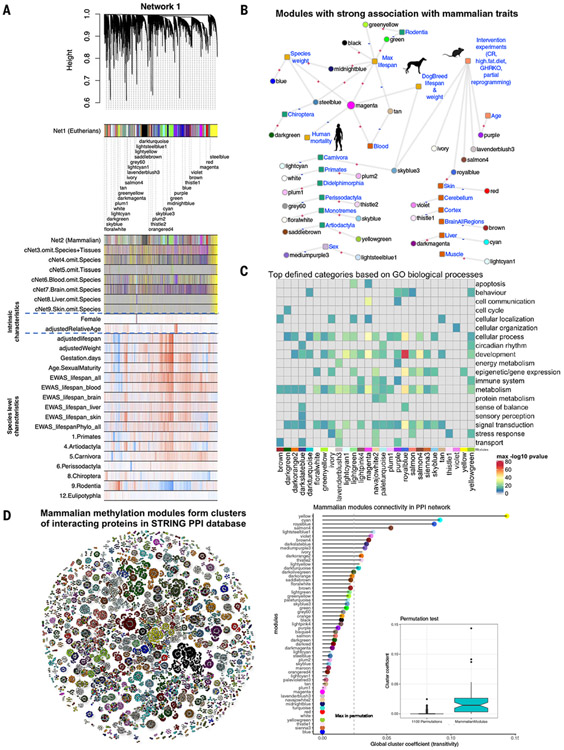
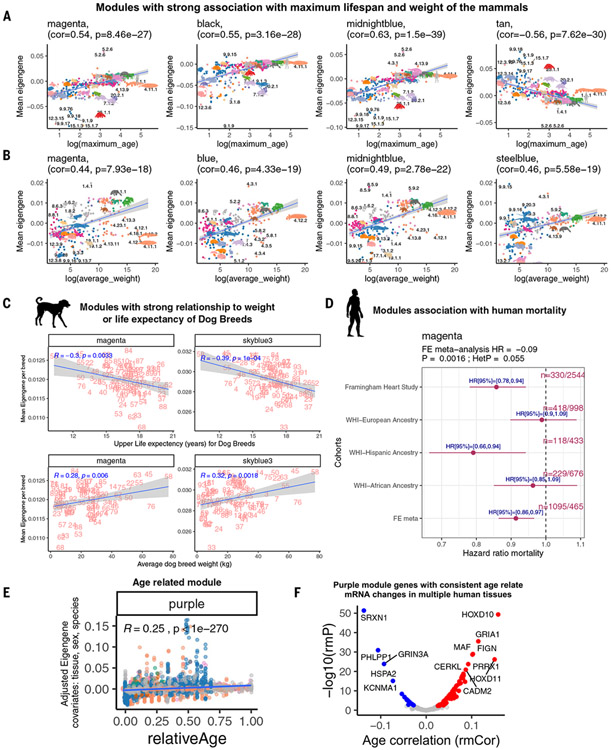
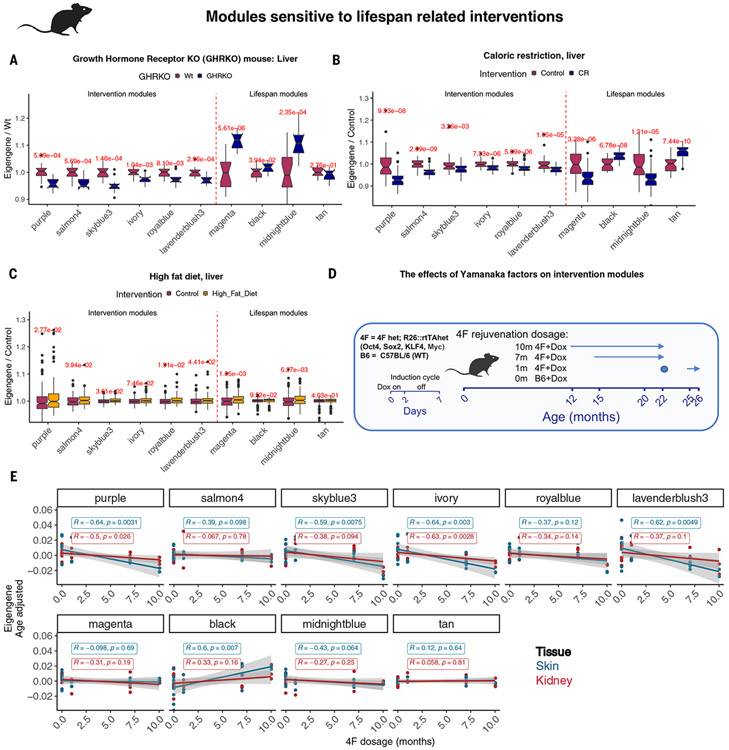
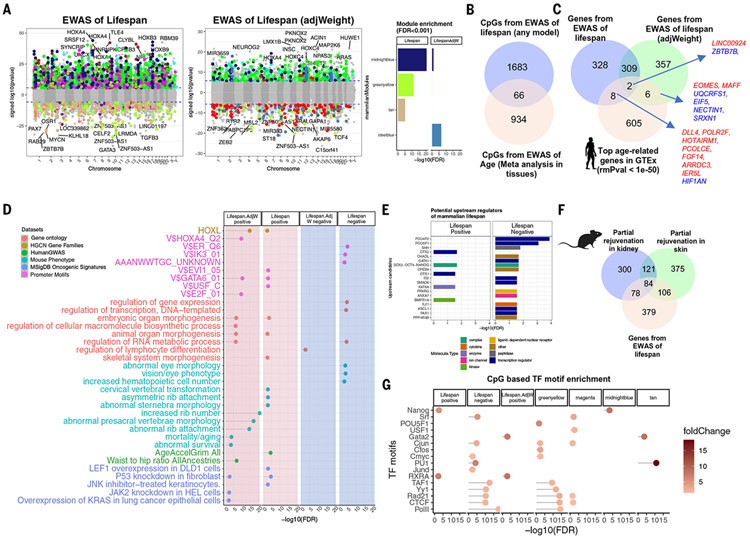
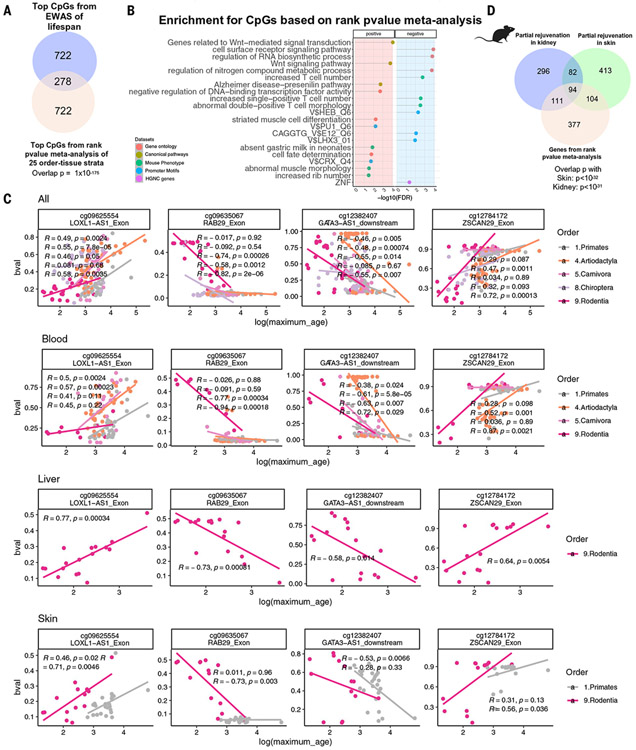
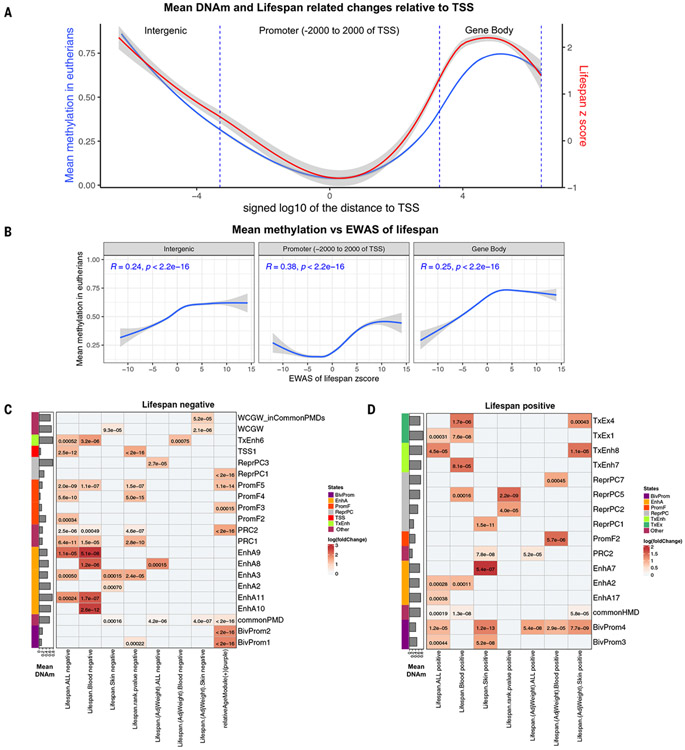
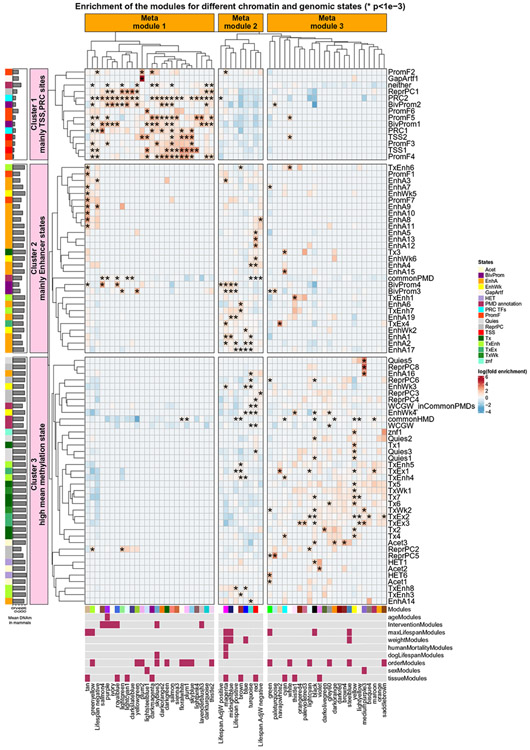
Using DNA methylation profiles (n = 15,456) from 348 mammalian species, we constructed phyloepigenetic trees that bear marked similarities to traditional phylogenetic ones. Using unsupervised clustering across all samples, we identified 55 distinct cytosine modules, of which 30 are related to traits such as maximum life span, adult weight, age, sex, and human mortality risk. Maximum life span is associated with methylation levels in HOXL subclass homeobox genes and developmental processes and is potentially regulated by pluripotency transcription factors. The methylation state of some modules responds to perturbations such as caloric restriction, ablation of growth hormone receptors, consumption of high-fat diets, and expression of Yamanaka factors. This study reveals an intertwined evolution of the genome and epigenome that mediates the biological characteristics and traits of different mammalian species.


Figures

Fig. 1.
Fig. 1.. Phyloepigenetic trees parallel the mammalian evolutionary tree.
(A) The traditional phylogenetic tree from the TimeTree database (44) based on 321 (of 348) species in our study. A full description of the species in our study is reported in table S1. (B) Blood-based phyloepigenetic tree created from hierarchical clustering of DNAm data in this study (for additional analysis, see fig. S3, A and B). We formed the mean value per cytosine across samples for each species. The clustering used 1 minus the Pearson correlation (1-cor) as a pairwise dissimilarity measure and the average linkage method as intergroup dissimilarity. Phyloepigenetic trees for skin and liver can be found in fig. S2. Additional analyses, e.g., involving different choices of CpGs or intergroup dissimilarity measures, are reported in the supplementary materials (fig. S2). The colored bars reflect the branch height. (C) Scatter plot of the distances in blood phyloepigenetic (1-cor) versus the traditional evolutionary tree. (D) Scatter plots displaying the log-odds ratios of regions exhibiting phylogenetic signals relative to the TSS are presented. The phylogenetic signal is determined using Blomberg’s K statistic (32). In this analysis, CpGs were grouped into categories using sliding windows relative to the TSS. To assess enrichment, the Fisher’s exact overlap test was used, focusing on the top 500 CpGs displaying phylogenetic signals within each region. The red dots highlight the regions with the Fisher’s exact P value < 0.05. The results indicate notable enrichment (OR > 3) in certain intergenic and genic regions but not in promoters. For additional analysis, see fig. S4.
Fig. 2.
Fig. 2.. DNAm network relates to species and individual characteristics in mammalian species.
(A) the WGCNA network of 14,705 conserved CpGs in eutherian species (Net1). The identified modules related to species or individual sample characteristics. Net1 modules were compared with eight additional networks (fig. S5). The modules with strong associations with species and sample characteristics are labeled below the dendrogram. Gray color indicates CpGs that are outside of modules. (B) Summary of the modules showing strong associations with species and individual sample characteristics. The plus and minus labels are the direction of association with each trait. (C) Top defined functional biological processes related to Net1 modules (for details, see fig. S9 and table S4). (D) Mammalian comethylation modules form clusters of proteins in the STRING protein-protein interaction (PPI) network. For the sake of visualization, the analysis was limited to the top 50 CpGs with the highest module membership value per module. Colors indicate mammalian Net1. The lollipop plot shows the global cluster coefficient (36) of the proteins within a module (up to 500 top CpGs) in a PPI network. Our permutation analysis matched the distribution of the original module sizes. We evaluated 1100 random permutations, i.e., 20 for each of the 55 modules. The boxplot reports the global clustering coefficient per module (y axis) versus permutation status: module resulting from a random selection of proteins (left) versus original module resulting from WGCNA (right). The modules with cluster coefficients larger than the maximum permutation cluster coefficient were considered as significant at P = 0.001. The dashed vertical line corresponds to the maximum global clustering coefficient observed in the 1100 random permutations.
Fig. 3.
Fig. 3.. Comethylation modules related to mammalian maximum life span, weight, human mortality, and age.
(A and B) Modules associated with log maximum life span (P < 10−20) (A) or log average species weight (P < 10−17) (B) in marginal association (correlation test with the mean module eigengene of the species). The module eigengene is defined as the first principal component of the scaled CpGs underlying a module. The species are randomly labeled by their animal number (table S1). (C) The top modules associated with median life expectancy, upper limit life expectancy, or average adult weight of 93 dog breeds, model (marginal correlation test of the mean module eigengene with target variables; for detailed breed characteristics, see table S8). R, Pearson correlation* coefficient; P, correlation test P value. (D) Forest plots of the top modules associated with mortality risk in the Framingham Heart Study Offspring Cohort (FHS), and Women’s Health Initiative (WHI) study totaling 4651 individuals (1095, 24% death). n denotes the number of deaths per total number of individuals in each study. We report the meta-analysis P value in the title of the forest plot. (E) Module that correlates significantly (P < 1 × 10−300) with relative age (defined as ratio of age/maximum life span) across mammalian species using a multivariate regression model. Covariates were tissue, sex, and species differences. Each dot corresponds to a eutherian tissue sample (n = 14,542). Dots are colored by taxonomic order as in Fig. 1. (F) Volcano plot of the rmCorr of all purple module genes in GTEx data (for additional analysis, see fig. S11).
Fig. 4.
Fig. 4.. The effects of different pro-aging and anti-aging interventions on selected DNAm modules.
Six DNAm modules respond to life span–related intervention experiments and are associated with the life expectancy of the mouse models. By contrast, the mammalian maximum life span modules do not correspond directly to the benefits or stress triggered by the intervention in the murine samples. (A) Changes in the intervention modules in the liver parallel smaller size and longer life expectancy of growth hormone receptor mouse models (GHRKO). Sample size: GHRKO, n = 11 (n = 5 female, n = 6 male); wild type, n = 18 (n = 9 male, n = 9 female). Age range was 6 to 8 months. (B) Caloric restriction (CR) DNAm module signature predicts longer life span in this treated group (age = 18 months; sex = male; CR, n = 59; control, n = 36). (C) High-fat diet accelerates aging in five modules including the purple (RelativeAge+) module. High-fat diet, n = 133 (n = 125 females, n = 8 males); control (ad libitum feeding), n = 212 (n = 10 male, n = 202 female). Age range was 3 to 32 months. (D and E) Examining the effects of in vivo partial reprogramming on intervention modules. (D) Schematic view of the partial programming experiment in 4F mice (39). A systemic Yamanaka factors expression (Oct4, Sox2, Klf4, and Myc) was periodically induced by adding doxycycline to the drinking water for 2 days per week. Partial programming was done at three different durations. Sample size: control (C57BL/6+dox), n = 7; 1 month (1m) 4F, n = 3; 7 months (7m) 4F, n = 5; 10 months (10m) 4F. All tissues except skin, n = 3; skin, n = 2. (E) scatter plots of the linear changes of the intervention modules in the skin and kidney of mice treated with different durations (dosages) of Yamanaka factors. Intervention modules indicate a dose-dependent rejuvenation of skin and kidney by this partial programming regimen.
Fig. 5.
Fig. 5.. EWAS of mammalian log-transformed maximum life span.
(A) CpG-specific association with maximum life span across n = 333 eutherian species. For EWAS, the mean methylation values of each CpG (per species) were regressed on log maximum life span. The right portion of the panel reports EWAS results after adjustment for average adult weight. Genome annotation indicates human hg19. Blue dotted line indicates Bonferroni-corrected two-sided P value < 1.8 × 10⁻⁶. The point colors indicate the corresponding modules. The bar plot indicates the top enriched (hypergeometric test, eutherian probes as background) modules for the top 1000 (500 negative CpGs, nominal P < 1.1 × 10⁻¹¹, FDR = 1 × 10⁻¹⁰; 500 negative and positive CpGs, nominal P < 1.5 × 10⁻²¹, FDR = 7.5 × 10⁻²⁰) significant CpGs for different EWASs. (B) Venn diagram of the overlaps between top hits from EWAS of maximum life span and meta-analysis of age [meta-analysis results are from (7); for additional analysis, see fig. S20]. (C) Venn diagram of the overlaps between the genes adjacent to the EWAS results and top age-related mRNA changes in human tissues (P < 1 × 10−50). (D) Gene set enrichment analysis of the genes proximal to CpGs associated with mammalian maximum life span. We only report enrichment terms that are significant after adjustment for multiple comparisons (hypergeometric FDR < 0.01) and contain at least five significant genes. The top three significant terms per column (EWAS) and enrichment database are shown. (E) Ingenuity potential upstream regulator analysis (40) of the differentially methylated genes related to mammalian maximum life span. Only significant (FDR < 0.05) regulators are represented in the bar plot. (F) Venn diagram of three gene lists. Gene list 1 is the top 646 genes adjacent to 1000 life span–related CpGs (500 positive and 500 negative). Gene lists 2 and 3 are based on CpGs that are differentially methylated (nominal Wald test P < 0.005, up to 500 positive and 500 negatively related CpGs) after OSKM overexpression in murine kidney (583 genes) and skin (686 genes) (39). We observed significant overlap between the gene lists (nominal Fisher’s exact P = 9.9 × 10⁻³⁰ for skin and life span; P = 4.5 × 10⁻²⁵ for kidney and life span). (G) Transcriptional factor motif enrichment analysis of life span modules and life span–related CpGs. The enrichment results for LifespanAdjWeight. negative were not significant. The overlap is assessed by a hypergeometric test for the CpGs within the motifs based on the human hg19 genome.
Fig. 6.
Fig. 6.. CpGs linked to life span in various taxonomic orders and tissues.
Using the nonparametric rankPvalue method (33), we combined 25 EWAS of life span results from various taxonomic order or tissue type strata, calculating the significance of a CpG’s consistently high (or low) rank based on the 25 EWASs of log maximum life span (meta.lifespan and underlying EWAS results can be found in table S24 and data S19). (A) The overlap of top 1000 (500 per direction) meta.lifespan CpGs with EWAS of life span in all eutherians (nominal Fisher’s exact P = 1 × 10−175). (B) Scatter plots illustrating the top meta.lifespan CpGs categorized into different tissue-phylogenetic order strata. Each panel displays only the strata that exhibit significant relationships. Each dot represents a species colored by taxonomic order. Each row corresponds to a different selection of tissue type. “bval” denotes the beta value, measuring DNAm at a CpG site, with 0 indicating no methylation and 1 indicating full methylation. (C) Gene set enrichment analysis of the genes proximal to CpGs associated with mammalian maximum life span. We only report enrichment terms that are significant after adjustment for multiple comparisons (hypergeometric FDR < 0.01) and contain at least five significant genes. The top three significant terms per column (EWAS) and enrichment database are shown. (D) Venn diagram of three gene lists. Gene list 1 (the bottom circle) is the top 407 genes adjacent to 1000 meta.lifespan CpGs (500 positive and 500 negative). Gene lists 2 and 3 (the top circles) are based on CpGs that are differentially methylated (nominal Wald test P < 0.005, up to 500 positive and 500 negatively related CpGs) after OSKM overexpression in murine kidney (583 genes) and skin (686 genes) (39).
Fig. 7.
Fig. 7.. Chromatin state analysis and distance to the TSS for the life span–related CpGs.
(A) Illustrated plot presenting mean methylation across species (displayed on the left y axis) and EWAS of maximum life span Z statistics (shown on the right y axis), all plotted against the distances to the closest TSS (represented on the x axis). (B) Mean methylation across species (y axis) plotted against EWAS Z statistics for log maximum life span in different genomic regions (intergenic, promoter, and gene body). Additional EWAS results after adjustment for phylogenetic relationships can be found in figs. S17 to S20, and corresponding enrichment results can be found in figs. S22 to S24. Pearson correlation coefficients and P values are reported in different panels. (C and D) Chromatin annotation enrichment analysis of the top 500 negatively life span–related CpGs (C) and the top 500 positively life span–related CpGs (D). The columns in each panel correspond to EWAS results for log-transformed maximum life span across (i) all tissues combined (Lifespan.All), (ii) blood samples only (Lifespan.Blood), and (iii) skin samples only (Lifespan.Skin), (iv) meta analysis of lifespan in different tissues (meta.lifespan), and the corresponding results after adjustment for average adult weight (LifespanAdjWeight). The last column reports enrichment with respect to the RelativeAge+ module (purple). We used the same significance thresholds as in Fig. 5. Cell shading corresponds to fold enrichment between comethylation modules and each chromatin state. Numeric values correspond to the P value of such enrichments based on the hypergeometric test, and only cell values with significant P < 0.001 (equivalent to FDR < 0.02) are shown. The chromatin states are learned based on epigenetic datasets profiling chromatin mark signals in different human cell and tissue types resulting in a genome annotation shared across cell types (41). The common partially methylated domains (commonPMD), solo CpGs (WCGW), and highly methylated domain (HMD) annotations are from (42). PRC1 and PRC2 binding site: are obtained from the ChIP-seq datasets of PCR1 and PCR2 from ENCODE (45).
Fig. 8.
Fig. 8.. Mammalian methylation meta-modules based on chromatin states and external genome annotations.
The heatmap shows the enrichments between (1) mammalian comethylation modules and significant life span–related EWAS CpG groups (x axis) and (2) chromatin states or other genomic annotation (y axis). Cell shading corresponds to log-transformed fold enrichment values (observed CpG count divided by expected count). Hypergeometric tests were used to evaluate the enrichment significance in each cell. *Nominal P < 0.001 (FDR < 0.10). Only chromatin states and external genome annotations with at least one significant enrichment (FDR < 0.10) are shown. The chromatin states are based on a human-based universal chromatin annotation of human cell and tissue types (41). Other genomic annotations include the commonPMD, solo CpGs (WCGW), HMD annotations, and neither (CpGs outside these annotations) which are from (42). In addition, PRC1 and PRC2 binding sites are defined from the ChIP-seq data of PRC1 and PRC2 from ENCODE (45). The row and column hierarchical clustering trees (average linkage) are based on a dissimilarity measure (1 minus the pairwise Pearson correlation between log-transformed fold enrichment values). The left barplot indicates the mean methylation levels of the CpGs in each state for all eutherian samples in our data. We used the 14,705 eutherian CpGs as the background for enrichment of the comethylation modules. By contrast, 28,318 CpGs (high-quality probes in humans and mice) were used as a background for enrichment of significant life span–related EWAS CpG groups with chromatin states and genome annotations. Each EWAS CpG group includes up to 500 most significant CpGs per direction (positively or negatively related with life span), as detailed in the caption of Fig. 5.

References

    1. Xiao S. et al., Comparative epigenomic annotation of regulatory DNA. Cell 149, 1381–1392 (2012). doi: 10.1016/j.cell.2012.04.029 - DOI - PMC - PubMed
    1. Villar D. et al., Enhancer evolution across 20 mammalian species. Cell 160, 554–566 (2015). doi: 10.1016/j.cell.2015.01.006 - DOI - PMC - PubMed
    1. Qu J. et al., Evolutionary expansion of DNA hypomethylation in the mammalian germline genome. Genome Res. 28, 145–158 (2018). doi: 10.1101/gr.225896.117 - DOI - PMC - PubMed
    1. Klughammer J. et al., Comparative analysis of genome-scale, base-resolution DNA methylation profiles across 580 animal species. Nat. Commun 14, 232 (2023). doi: 10.1038/s41467-022-34828-y - DOI - PMC - PubMed
    1. Arneson A. et al., A mammalian methylation array for profiling methylation levels at conserved sequences. Nat. Commun 13, 783 (2022). doi: 10.1038/s41467-022-28355-z - DOI - PMC - PubMed