. 2023 Aug 17;186(17):3706-3725.e29.
doi: 10.1016/j.cell.2023.07.009. Epub 2023 Aug 9.

Distinct molecular profiles of skull bone marrow in health and neurological disorders

Zeynep Ilgin Kolabas  1 Louis B Kuemmerle  2 Robert Perneczky  3 Benjamin Förstera  4 Selin Ulukaya  5 Mayar Ali  6 Saketh Kapoor  5 Laura M Bartos  7 Maren Büttner  8 Ozum Sehnaz Caliskan  9 Zhouyi Rong  10 Hongcheng Mai  10 Luciano Höher  5 Denise Jeridi  5 Muge Molbay  5 Igor Khalin  11 Ioannis K Deligiannis  12 Moritz Negwer  5 Kenny Roberts  13 Alba Simats  11 Olga Carofiglio  11 Mihail I Todorov  4 Izabela Horvath  14 Furkan Ozturk  5 Selina Hummel  15 Gloria Biechele  7 Artem Zatcepin  15 Marcus Unterrainer  16 Johannes Gnörich  7 Jay Roodselaar  17 Joshua Shrouder  11 Pardis Khosravani  18 Benjamin Tast  18 Lisa Richter  18 Laura Díaz-Marugán  11 Doris Kaltenecker  19 Laurin Lux  5 Ying Chen  11 Shan Zhao  4 Boris-Stephan Rauchmann  20 Michael Sterr  21 Ines Kunze  21 Karen Stanic  4 Vanessa W Y Kan  22 Simon Besson-Girard  23 Sabrina Katzdobler  24 Carla Palleis  24 Julia Schädler  25 Johannes C Paetzold  26 Sabine Liebscher  27 Anja E Hauser  17 Ozgun Gokce  28 Heiko Lickert  29 Hanno Steinke  30 Corinne Benakis  11 Christian Braun  31 Celia P Martinez-Jimenez  32 Katharina Buerger  33 Nathalie L Albert  7 Günter Höglinger  24 Johannes Levin  34 Christian Haass  35 Anna Kopczak  11 Martin Dichgans  36 Joachim Havla  37 Tania Kümpfel  37 Martin Kerschensteiner  27 Martina Schifferer  38 Mikael Simons  38 Arthur Liesz  39 Natalie Krahmer  9 Omer A Bayraktar  13 Nicolai Franzmeier  11 Nikolaus Plesnila  28 Suheda Erener  5 Victor G Puelles  40 Claire Delbridge  41 Harsharan Singh Bhatia  4 Farida Hellal  42 Markus Elsner  5 Ingo Bechmann  30 Benjamin Ondruschka  25 Matthias Brendel  43 Fabian J Theis  44 Ali Erturk  45
Affiliations

Distinct molecular profiles of skull bone marrow in health and neurological disorders

Zeynep Ilgin Kolabas et al. Cell. .

Abstract

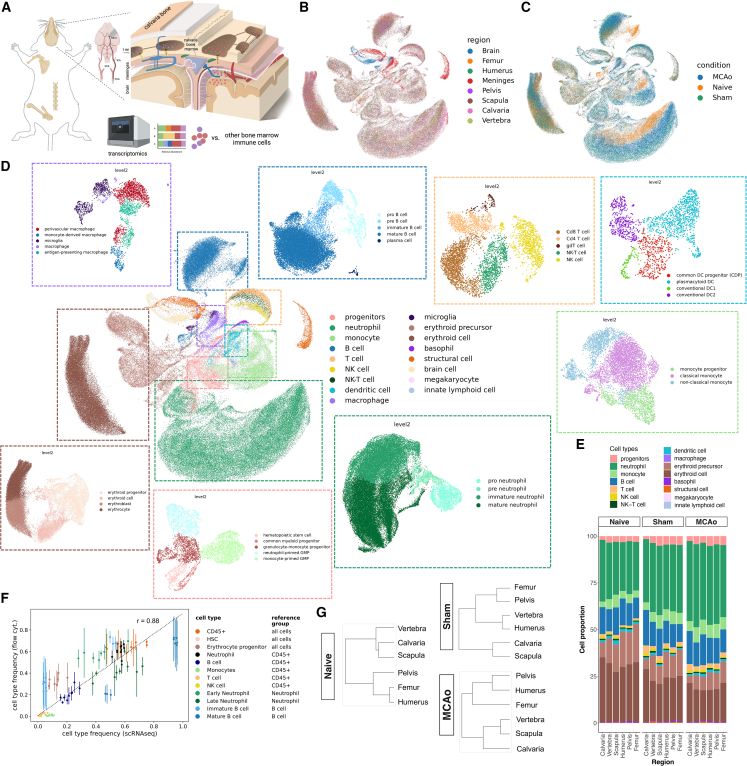
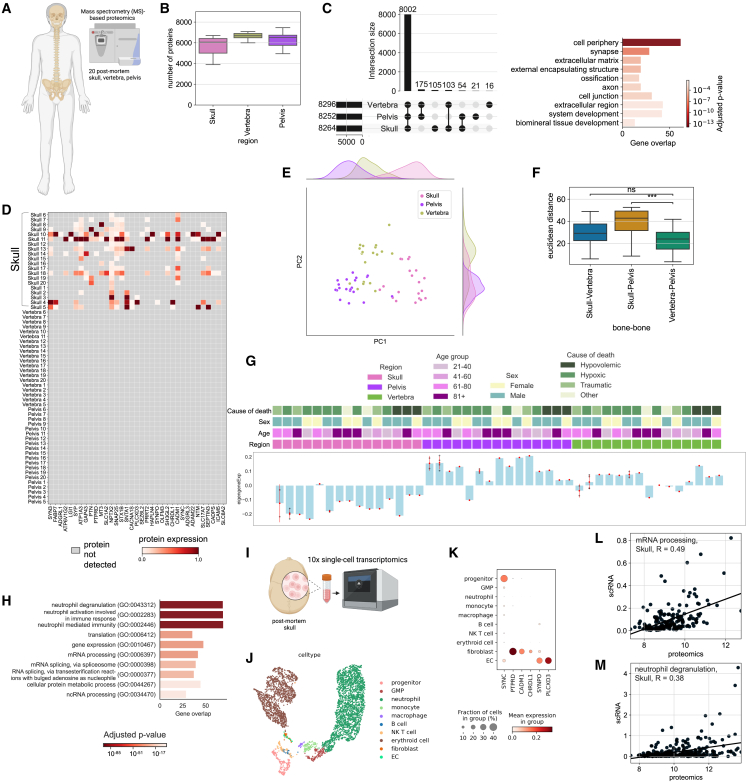
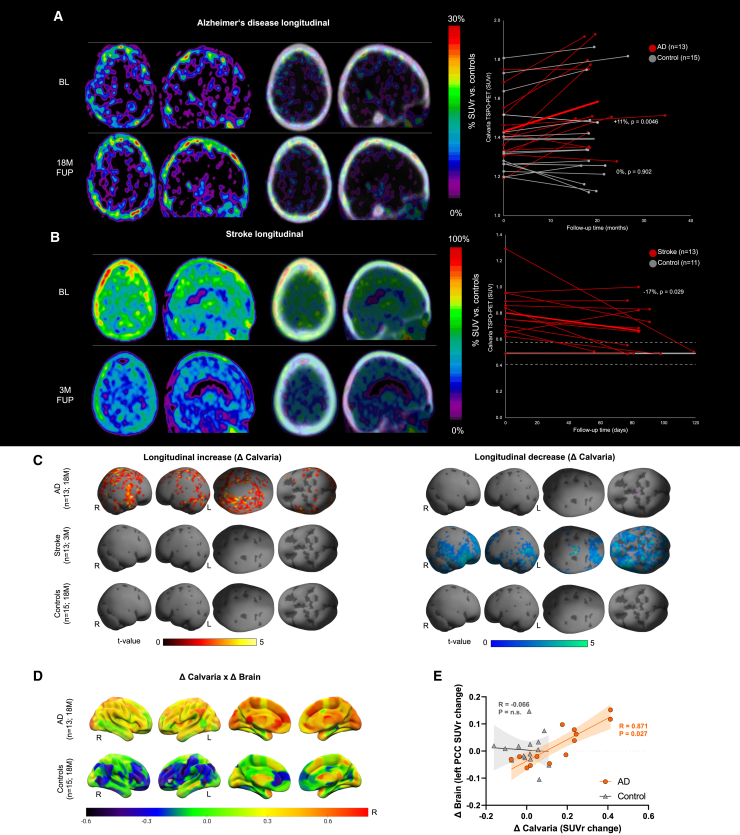
The bone marrow in the skull is important for shaping immune responses in the brain and meninges, but its molecular makeup among bones and relevance in human diseases remain unclear. Here, we show that the mouse skull has the most distinct transcriptomic profile compared with other bones in states of health and injury, characterized by a late-stage neutrophil phenotype. In humans, proteome analysis reveals that the skull marrow is the most distinct, with differentially expressed neutrophil-related pathways and a unique synaptic protein signature. 3D imaging demonstrates the structural and cellular details of human skull-meninges connections (SMCs) compared with veins. Last, using translocator protein positron emission tomography (TSPO-PET) imaging, we show that the skull bone marrow reflects inflammatory brain responses with a disease-specific spatial distribution in patients with various neurological disorders. The unique molecular profile and anatomical and functional connections of the skull show its potential as a site for diagnosing, monitoring, and treating brain diseases.

Keywords: 3D-imaging; DISCO clearing; PET imaging; immune cell trafficking; neuroinflammation; neurological disorders; non-invasive monitoring; proteomics; scRNA-seq; skull-brain connection.


Conflict of interest statement

Declaration of interests M. Brendel received speaker honoraria from GE healthcare, Roche, and Life Molecular Imaging and is an advisor of Life Molecular Imaging. J.H. reports personal fees, research grants, and non-financial support from Merck, Bayer, Novartis, Roche, Biogen, and Celgene and non-financial support of the Guthy-Jackson Charitable Foundation—none in relation to this study. C.P. is inventor in a patent “Oral Phenylbutyrate for Treatment of Human 4-Repeat Tauopathies” (EP 23 156 122.6) filed by LMU Munich. T.K. has received speaker honoraria and/or personal fees for advisory boards from Bayer Healthcare, Teva Pharma, Merck, Novartis, Sanofi/Genzyme, Roche, and Biogen as well as grant support from Novartis and Chugai Pharma—none in relation to this study. M.K. has been on advisory boards for Biogen, medDay Pharmaceuticals, Novartis, and Sanofi; has received grant support from Sanofi and Biogen; and has received speaker fees from Abbvie, Almirall, Biogen, medDay Pharmaceuticals, Merck Serono, Novartis, Roche, Sanofi, and Teva—none in relation to this study. R.P. has received speaker honoraria, research support, and consultancy fees from Janssen, Eli Lilly, Biogen, Wilmar Schwabe, Takeda, Novo Nordisk, and Bayer Healthcare. N.K. has received speaker honoraria from Novartis and Regeneron and research grants from Regeneron—none in relationship to this study. M.I.T., H.S.B., M.N., and A.E. received speaker honoraria from Miltenyi Biotec—none in relation to this study. A.E. is co-founder of Deep Piction and 1X1 Biotech.

Figures

None
Graphical abstract
Figure 1
Figure 1
Bones diverge based on transcriptional signature of cell types (A) Experimental design of single-cell RNA sequencing of bones, dura, and brain, and a schematic of the middle cerebral artery occlusion (MCAo) model of stroke. (B–D) Uniform manifold approximation and projection (UMAP) distribution of scRNA-seq colored by (B) region, (C) condition: naive, sham-operated, and MCAo, and (D) cell type with fine annotated cell types in the surrounding with matching color. (E) Relative proportions of the coarse cell types. (F) Correlation between relative proportions of the cell types in scRNA-seq and independent animals measured by flow cytometry using 15 color panel. Mean Pearson correlation over conditions and bones is 0.875. (G) Dendrograms for naive, sham, and MCAo conditions. (n = 3 pooled animals for sham and n = 6 pooled animals for MCAo.). See also Figures S1 and S2.
Figure S1
Figure S1
Assessment of skull cell dynamics and details of cell-type annotations, related to Figure 1 (A) Overview of the two-photon experiment and representative images from sham and MCAo groups. 2, 24, and 72 h after surgeries same ROIs were imaged. Per each imaging session, animals were given dextran for vessel labeling (n = 3 for naive and sham and n = 5 animals for MCAo). Scale bars, 50 μm. (B) Quantification of changes in area between sham and MCAo conditions. LysM was quantified based on maximum intensity projected time series of 3 frames per batch. Average area of LysM cells in MCAo is less than sham in 24 h (p = 0.04) and both conditions have significant decrease of LysM cells over time (p = 0.004 for sham and p <0.0001 in MCAo)Data represented as ±SEM.(see STAR Methods for details). (C) Photoconversion in KikGR mouse model to track cell trafficking from skull to brain 3 days after stroke. B cell (1 h, ipsi vs. contra skull, p = 0.06, brain, p = 0.09. 6 h ipsi vs. contra skull, p = 0.02, brain, p = 0.06), T cells (1 h, ipsi vs. contra brain, p = 0.027. 6 h ipsi vs. contra skull, p = 0.001, brain, p = 0.013), and myeloid cells (1 h, ipsi vs. contra skull, p = 0.03. 6 h ipsi vs. contra skull, p = 0.02, brain, p = 0.004) were analyzed within the skull and brain compartment at indicated time points. Data represented as ±SEM. (D and E) Gating strategy for B cells, T cells, myeloid cells in bone marrow and spleen (D) and in brain (E). (F) Coarse and fine annotated cell types and their marker genes. (G–I) Deconvolved pooled data using SNPs showing (G) coarse annotations, (H) B cell fine cell annotation, and (I) neutrophils fine cell annotations. (J) Gating strategy for proportions: B cells, T cells, monocytes, neutrophils, eosinophils, erythroid cells, progenitors, NK cells, late neutrophils, B cell progenitors for flow cytometry experiment demonstrating proportions.
Figure S2
Figure S2
Proportions and UMAP of fine cell types over all conditions, related to Figure 1 Coarse cell types are shown separately with their fine cell-type proportion over three conditions, and their UMAP distribution for the cell-type, condition and region: (A) neutrophils, (B) monocytes, (C) B cells, (D) progenitors, (E) dendritic cells, (F) macrophages, (G) T and NK cells, (H) basophils, (I) erythroid cells, and (J) structural cells.
Figure S3
Figure S3
Analysis of skull cell numbers, neutrophil development, and inflammatory responses in different bones and the meninges, related to Figure 2 (A) Whole head clearing of LysM mice in naive, sham, and MCAo (stroke on left side) condition. (B) Quantification of PI signal in the frontal and parietal bones show a strong trend (F(2,6) = 5.027, p = 0.522) for increased PI signal in MCAo condition compared to sham (p = 0.124) and naive conditions (p = 0.053). (C) Quantification of PI signal in the contralateral parietal skull bone of show increase (F(2,6) = 8.323, p = 0.019) in PI signal in MCAo condition compared to sham (p = 0.040) and naive (p = 0.022) conditions (n = 3 per group); dpi, days post injury. (D) Expression of DAMP relevant genes in three conditions with their relative hierarchical clustering. (E) Comparison of naive vs. injury response of specific DAMP genes. Color code indicates significance (p < 0.05). (F) The unique LR pairs in the skull and vertebra in three different conditions. LR pairs that occur in at least 5 different cell-type pairs in a given bone group are shown. (permutation test, 1000 permutations, p = 0) (G) Pseudo-time analysis of naive, sham, and MCAo with normalized cell density in each condition for each region. (H) Phase portrait showing unspliced and spliced counts in neutrophils of gene S100a6 for naive, sham and MCAo respectively. (I–K) Mean expressions of upregulated genes in meninges and in a single other group in (I) naive, (J) sham, and (K) MCAo. (L and M) Mean and standard deviation of (L) anti-inflammatory and (M) pro-inflammatory score over cells of all cell types, B cells, neutrophils, and monocytes in naive, sham, and MCAo (significance and LFC in Table S1, tabs 29 and 30). Inflammatory score is based on the expression of Il6, Il1a, Il1b, Ifng, Il11, Il7d, Il7f, Il18 and Tnf (pro-inflammatory) and Il1rn, Tgfb1, Il4, Il10, Il12a, and Il13 (anti-inflammatory).
Figure 2
Figure 2
Different cell types show unique differentially expressed genes and ligand-receptor pairs between bones (A) PC regression plot shows how strongly each bone’s cell population diverges from the pooled population of other bones by variance explained for each coarse cell type. Only significant differences are shown for level 1 annotations. (permutation test, p < 0.0001) (B) Differentially expressed genes in naive, sham, and MCAo conditions (p < 0.05, LFC > 1 threshold). Each bar represents the fine cell-type color the genes are upregulated in. Fine cell annotations are used. (C) Calvaria-unique upregulated genes in the three conditions. (p < 0.05, LF change > 1) (D) Representative images of Nr4a1 labeling after clearing and light-sheet fluorescent microscopy, n = 3. (E) Threshold based quantification of 12× scans of Nr4a1 (p = 0.0040). Nr4a1+ voxels as % of total volume. Data represented as ±SEM. (F) Nr4a1 transcript is shown to colocalize with Lyz2 and Mpo, myeloid cell marker and progenitor marker, respectively, using RNAscope. (G) Ligand-receptor interactions in three conditions on coarse cell-type annotations. (permutation test, 1000 permutations, p = 0) (H) Left: in the neutrophil subpopulation, calvaria, and dura neutrophils are highlighted in region-based UMAP. Right: projected developmental trajectory of MCAo neutrophils subset using scVelo. (I) PAGA analysis on the neutrophils subpopulation demonstrates separation of samples based on condition. (J) DE genes (DEGs) among dura, calvaria, and other bones, in three conditions (n = 3 pooled animals for sham and n = 6 pooled animals for MCAo). (p < 0.05, LF change > 0.5) See also Figures S3 and S4.
Figure S4
Figure S4
Analysis of bulk RNA-seq data of bone marrow cells, related to Figure 2 (A) PCA of calvaria, scapula, humerus, vertebra, pelvis, and femur from 5 naive, 5 sham, 6 MCAo animals. Color represents region and shape represents condition. (B) Correlation between bulk RNA gene expression and scRNA-seq pseudobulked dataset. r = 0.81. (C) Representative genes that show the same trend with scRNA-seq data for each condition. p values and log-fold changes are given on top of each violin plot (p < 0.001 for Ptgs2, p = 0.066 for Nr4a2, and p = 0.061 for Dusp5 in naive, p = 0.001 for Cxcl2, p = 0.015 for Plk3 and p = 0.019 for Dapl1 in sham, p < 0.001 for Ptgs2, p < 0.001 for Adra2a, and p = 0.002 for Cxcl2 in MCAo). Single-cell expression of these genes are given with “expected,” positive means scRNA-seq data showed an increased trend of the given gene. (D) PCA of femur and calvaria in 5xFAD model of Alzheimer’s disease. 5xFAD animals are compared with their littermate controls. Colors represent different bones whereas shapes represent condition. (E) Calvaria upregulated and downregulated genes in control case. There are no differentially expressed genes in AD case. The expression of the differentially expressed genes are shown in all groups for comparison. (p < 0.05) (F) Selected upregulated genes that show the same trend in 5xFAD dataset. p values and log-fold change are given on top of each violin plot (p < 0.339 for Cxcl2, p = 0.461 for Il1b, and p = 0.461 for Ptgs2 . Single-cell expression of these genes are given with expected, positive means scRNA-seq data showed an increased trend of the given gene.
Figure 3
Figure 3
Proteomics identifies protein modules that characterize inter-bone expression differences (A) Illustration of the experimental pipeline is shown: mouse calvaria, humerus, vertebra, pelvis, and femur from three animals were collected to perform mass spectrometry in three different conditions, that is, naive, sham-operated, and MCAo. (B and C) Principal component analysis (PCA) of (B) six bones, dura, and brain and (C) six bones in naive, sham, and MCAo conditions. (D) Dendrogram demonstrates the relation among bones and conditions. (E–J) Protein expression modules identified by WGCNA among bones, brain, and meninges. Module distributions are shown in the left-hand panels the corresponding GO terms in the right-hand panels (n = 3 independent samples each for bones and brain for all conditions, n = 3 for meninges MCAo and sham conditions). See also Figure S5.
Figure S5
Figure S5
Details of the analysis of mouse proteome data and human skull-meninges channels, related to Figures 3 and 4 (A) Number of proteins detected from each bone. (B) Number of common proteins and unique proteins detected from different bones for different conditions. Top: naive, middle: sham, and bottom: MCAo. (C) 10 top upregulated proteins for each region in each condition (LFC > 1, p < 0.05). (D) Dendrogram for each sample and condition is shown. (E) Volcano plot shows the difference between calvaria MCAo vs. sham. (LFC > 1, p < 0.05) Related GO terms are shown below. (F–K) Volcano plots are showing (F) naive calvaria vs. other bones, (H) sham calvaria vs. other bones and (J) MCAo calvaria vs. other bones, respectively. (LFC > 1, p < 0.05) (G–K) GO terms of upregulated calvaria proteins in (G) naive, (I) sham, and (K) MCAo conditions are provided below each volcano plot. (L) Correlation plot of module 2 of WGCNA neutrophil degranulation GO term proteins with scRNA-seq expression levels. Spearman correlation, R = +0.42, p < 0.0001. (M) Details for post-mortem tissue clearing and light-sheet fluorescent imaging experiments. (N) Channels connecting calvaria’s bone marrow to the meninges with Iba1+ cells. Scale bars, 150 μm. (O) Human bone marrow labeled for cell nuclei (PI, in green), macrophage (Iba1, in magenta) is shown with calvaria bone (autofluorescence). (P) Skull channel diameter distribution based on each ROI quantified. (Q) Channel number per 1 cm3 distribution over all ROIs and samples. (R) Annotated skull + dura ROI, bottom part shows dura with brown annotation, skull channels are annotated in green and bone marrow is annotated in gray. Annotated dura, skull and bone marrow mask. Graph extraction of human skull architecture, total length, and radius of the shortest path from skull marrow to the dural meninges in μm, respectively. Scale bars, 500 μm. (S–W) 200 nm thick scanning electron microscopy images of a SMC with zoom-ins. (S) shows different axial depths of the same channel.
Figure 4
Figure 4
Tissue clearing enables a comprehensive characterization of human skull-meninges connections (A) Frontal, parietal, and temporal regions of the skull and coronal view depicting the meningeal layers and the brain. (B) Representative light-sheet microscopy image of cleared tissue corresponding to the red box in (A). The right panels show skull-meninges channels connecting the skull bone marrow to the sub-dural space and to the dura mater. (C) Representative skull piece cleared and imaged for SMC quantification in different regions of the human skull. Diploic vein and an exemplary SMC are shown. (D) Representative skull-meninges-channels in different sizes: ∼33, ∼73, ∼96, and ∼154 μm. Autofluorescence in gray, lectin in magenta. Left panels are labeled with PI (cyan) and right panels with LYZ2 (cyan). Dura mater in some panels is not preserved in (D). (E) Human SMC example from 1 μm thick FFPE embedded skull-dura section. (F) Quantification for % of channel size in frontal, parietal, and temporal regions. Data represented as ± SEM. (G) Quantification for annotated channel numbers, normalized to 1 cm3 (22 region of interests (ROIs) in total, >500 channels, from seven post-mortem samples, frontal vs. parietal p = 0.09, parietal vs. temporal p = 0.08, and frontal vs. temporal p = 0.48). Data represented as ±SEM. (H) Human SMC example with an artery passing to the skull from 8 μm thick fixed-frozen skull-dura section labeled with DAPI (blue), aSMA (green), PDGFR-B (red), and CollagenIV (gray). See also Figure S5.
Figure 5
Figure 5
Human bones differentially express distinct protein modules (A) Illustration of the experimental pipeline, 60 bones in total were collected to perform mass spectrometry-based proteomics on 20 skull, 20 vertebra, and 20 pelvis. (B) The number of proteins detected from each bone is shown with a boxplot. (C) The number of common proteins and unique proteins detected from different bones are shown with an upset plot. GO terms associated with unique skull proteins are shown at the bottom. (D) Expression levels of a selection of proteins belonging to GO terms related to synapse term that were detected in more than half of the skull samples uniquely. (E) Principal component analysis of the three bones analyzed. (F) Boxplot depicts the Euclidean distances between pairs of bones using the first 2 principal components. (p = 2.862e-04 for skull-pelvis vs. vertebra-pelvis, p value =2.862e-04 for skull-pelvis vs. vertebra-pelvis) (G) WGCNA among bones reveal one significant module where calvaria genes are downregulated compared with two other bones with some exceptions. Biggest source of variance is the bone type. (H) GO terms from the module of skull downregulated proteins. (I) Single-cell sequencing of post-mortem skull sample illustration. (J) UMAP of single-cell sequencing of post-mortem skull sample (n = 1). (K) Expression of unique skull detected proteins in the scRNA-seq data. (L) Correlation plot of the module from (G), mRNA processing GO term. Protein expression vs. scRNA-seq. Spearman correlation, R = 0.49, p < 0.0001. (M) Correlation plot of the module from (G), neutrophil degranulation GO term protein expression. Protein expression vs. scRNA-seq. Spearman correlation, R = 0.38, p < 0.0001. See also Figure S6.
Figure S6
Figure S6
Details of the analysis of the human proteome data, related to Figure 5 (A) Post-mortem sample information, category of death is based on how death affects the brain. (B) Two proteins found uniquely in the human skull that show a similar trend in the mouse dataset. Snap25 and Syp expression in calvaria MCAo is higher than in sham (p = 5.786e-08 and p = 2.000e-05, respectively). (C) PCA of bones based on age, cause of death group, PMI, and sex, respectively; PMI, post-mortem interval. (D–I) Volcano plots among different bones: calvaria vs. others (D), vertebra vs. others (F), and pelvis vs. others (H) suggest there is a global downregulation in the skull compared to pelvis. (LFC > 1, p < 0.05) with GO terms for upregulated and downregulated for each bone (E), (G), and (I). (J) Cell-type annotation marker genes for scRNA-seq of human skull.
Figure S7
Figure S7
Influence of imaging method, and various covariates on TSPO-PET data, related to Figure 6 (A) TSPO RNA levels in naive vs. injury (MCAo + sham) (p < 0.0001) conditions in the skull from the scRNA-seq data. TSPO RNA levels in 5xFAD vs. wild type in the calvaria (p = 0.0065). (B) In vivo TSPO-PET imaging of three wild-type mice, followed by a second scan after immediate removal of the brain, blood, and all tissue surrounding the skull bone. Signal attributable to the skull in the in vivo TSPO-PET images was compared to the signal in the respective skull-only TSPO-PET to delineate skull signal in mice (three replicates, R² = 0.534, 0.761, 0.283, p < 0.0001). (C) Coronal slice upon a CT template shows %-TSPO-PET differences between 5xFAD and wild-type mice at the group level. Images indicate increased TSPO labeling in the fronto-parietal and temporal skull of 5xFAD mice in contrast against age-matched wild-type mice. White arrows indicate spots with higher increases of skull TSPO labeling when compared to adjacent increases of brain TSPO labeling in 5xFAD. Axial slices upon an MRI template show TSPO-PET in an individual 5xFAD and an individual wild-type mouse. Elevated TSPO labeling in fronto-parietal and temporal skull is present (white arrows) in the 5xFAD mouse when compared to the wild-type mouse. H = hypophysis with known strong TSPO-PET signal. (D) Fronto-patietal skull, p = 0.0017, temporal skull, p < 0.0001 (two-tailed t test). Data represented as ±SEM. (E) Quantification of relevant skull signal sex differences for AD (p < 0.0001; controlled for age and TSPO-binding single nucleotide polymorphism), stroke (p = 0.2), PPMS (p = 0.2), RRMS (p = 0.02), 4RT (p = 0.5) patients and controls (p = 0.1). Data represented as ±SEM. (F) Quantification of fronto-parietal skull signal age associated patterns (p = 0.019, two-tailed t test, controlled for gender and TSPO-binding single nucleotide polymorphism) among 50 AD continuum patients. Data are means ± SD. SUVr, standardized uptake value ratio. (G) Fronto-parietal skull TSPO signal from patients with AD show no significant correlation with clinical severity in MMSE (p = 0.681), CERAD (p = 0.063), and CDR (p = 0.453) scorings. (H) Fronto-parietal skull TSPO signal in Alzheimer’s disease compared to control patients (prodromal vs. dementia: p = 0.63, data represented as ±SEM.). (I) Fronto-parietal skull TSPO signal shows a positive association only with brain TSPO signal in the Braak VI stage region (p = 0.115 for Braak I, p = 0.248 for Braak II, p = 0.458 for Braak III, p = 0.450 for Braak IV, p = 0.855 for Braak V, and p = 0.012 for Braak VI). (J) Fronto-parietal skull TSPO signal is not significantly associated with brain TSPO signal in any β-amyloid related regions: frontal (p = 0.782), temporal (p = 0.458), parietal (p = 0.748), and posterior cingulate cortex/precuneus (p = 0.447). (K) Fronto-parietal skull TSPO signal is correlated with β-amyloid42 (p = 0.044) but not β-amyloid40 (p = 0.741) in cerebrospinal fluid, also reflected by the significant negative correlation of the β-amyloid ratio (p = 0.033). (L) TSPO-PET signal quantifications in C2 bone of vertebra. One-way ANOVA with Bonferroni post hoc correction. See STAR Methods for details of normalization and statistical analysis. Significant differences of disease vs. controls are indicated (p = 1.0 for control vs. stroke, PPMS, RRMS, and 4RT, p = 0.154 for control vs. AD). Data represented as ±SEM. Pairwise comparison of all groups can be found in Table S3.
Figure 6
Figure 6
Distinct TSPO uptake patterns are observed in the skull of patients with inflammatory, ischemic, and degenerative CNS diseases (A) 3D surface projection (triple fusion with CT and MRI templates; quadrant cut [top]; transparent CT [bottom] displaying increased activity within skull) shows %-TSPO-PET differences between patients with AD and healthy controls at the group level. (B) Average TSPO-PET signal in Alzheimer’s disease (AD), stroke, primary progressive multiple sclerosis (PPMS), relapsing-remitting multiple sclerosis (RRMS), and 4-repeat tauopathy (4RT) patients. (C–F) TSPO-PET signal quantifications in skull regions adjacent to different brain regions: (C) fronto-parietal area (p = 0.007 for control vs. AD, and p = 0.03 for control vs. 4RT), (D) motor area (p = 0.006 for control vs. AD and stroke, and p = 0.002 for control vs. 4RT), (E) temporopolar area (p < 0.001 for control vs. stroke, PPMS, and RRMS), and (F) skull base (p < 0.001 for control vs. PPMS and RRMS). Data represented as ±SEM. One-way ANOVA with Bonferroni post hoc correction (see STAR Methods for details). Data were normalized as described in the STAR Methods. Significant differences of disease vs. controls are indicated. Pairwise comparisons of all groups can be found in Table S3. See also Figure S7.
Figure 7
Figure 7
Serial calvaria TSPO-PET imaging of patients with Alzheimer’s disease and stroke (A and B) Axial and sagittal slices show %PET difference images of patients with Alzheimer’s disease (AD, n = 13, A, +11%, p = 0.0046 in AD vs. 0%, p = 0.902 in controls) and stroke (n = 13, B, -17%, p = 0.029 in stroke) against age-matched healthy controls (normalized as described in the STAR Methods). Controls in (A) (n = 15) were imaged serially and controls in (B) (n = 11) were imaged at a single time point. %PET difference images are depicted with and without CT overlay. Right panels show individual time courses of calvaria TSPO-PET signals of (A) patients with Alzheimer’s disease and healthy controls at a median follow-up interval of 18 months and (B) patients with stroke at a median follow-up interval of 84 days. Mean (thick line) and standard deviation (dashed lines) of calvaria TSPO-PET. (C) Surface projections show statistical parametric mapping (SPM) of longitudinal TSPO-PET changes (left: increases, hot/right: decreases, cold) of patients with AD, patients with stroke, and healthy controls. Voxels with p < 0.05 (t value threshold 1.78, uncorrected for multiple comparisons) are projected on the SPM12 skull surface template. (D) Brain surface projections show regional correlations (Pearson’s correlation coefficient, R) of longitudinal TSPO-PET changes in calvaria with longitudinal TSPO-PET changes in brain of patients with AD and healthy controls. (E) Correlation between calvaria and brain TSPO-PET changes in the left posterior cingulate cortex that survived false discovery rate correction for multiple comparison of 246 brain regions (R = 0.871, p = 0.027 in AD vs. R = -0.066, p = n.s. in controls).

Comment in

References

    1. Rustenhoven J., Kipnis J. Brain borders at the central stage of neuroimmunology. Nature. 2022;612:417–429. doi: 10.1038/s41586-022-05474-7. - DOI - PMC - PubMed
    1. Cai R., Pan C., Ghasemigharagoz A., Todorov M.I., Förstera B., Zhao S., Bhatia H.S., Parra-Damas A., Mrowka L., Theodorou D., et al. Panoptic imaging of transparent mice reveals whole-body neuronal projections and skull–meninges connections. Nat. Neurosci. 2019;22:317–327. doi: 10.1038/s41593-018-0301-3. - DOI - PMC - PubMed
    1. Cai R., Pan C., Ghasemigharagoz A., Todorov M.I., Förstera B., Zhao S., Bhatia H.S., Mrowka L., Theodorou D., Rempfler M., et al. Panoptic vDISCO imaging reveals neuronal connectivity, remote trauma effects and meningeal vessels in intact transparent mice. Preprint at bioRxiv. 2019 doi: 10.1101/374785v1. - DOI
    1. Herisson F., Frodermann V., Courties G., Rohde D., Sun Y., Vandoorne K., Wojtkiewicz G.R., Masson G.S., Vinegoni C., Kim J., et al. Direct vascular channels connect skull bone marrow and the brain surface enabling myeloid cell migration. Nat. Neurosci. 2018;21:1209–1217. doi: 10.1038/s41593-018-0213-2. - DOI - PMC - PubMed
    1. Cugurra A., Mamuladze T., Rustenhoven J., Dykstra T., Beroshvili G., Greenberg Z.J., Baker W., Papadopoulos Z., Drieu A., Blackburn S., et al. Skull and vertebral bone marrow are myeloid cell reservoirs for the meninges and CNS parenchyma. Science. 2021;373 doi: 10.1126/science.abf7844. - DOI - PMC - PubMed

Publication types