. 2023 Aug 10;6(11):e202301955.
doi: 10.26508/lsa.202301955. Print 2023 Nov.

SF3B1 mutation-mediated sensitization to H3B-8800 splicing inhibitor in chronic lymphocytic leukemia

Affiliations

SF3B1 mutation-mediated sensitization to H3B-8800 splicing inhibitor in chronic lymphocytic leukemia

Irene López-Oreja et al. Life Sci Alliance. .

Abstract

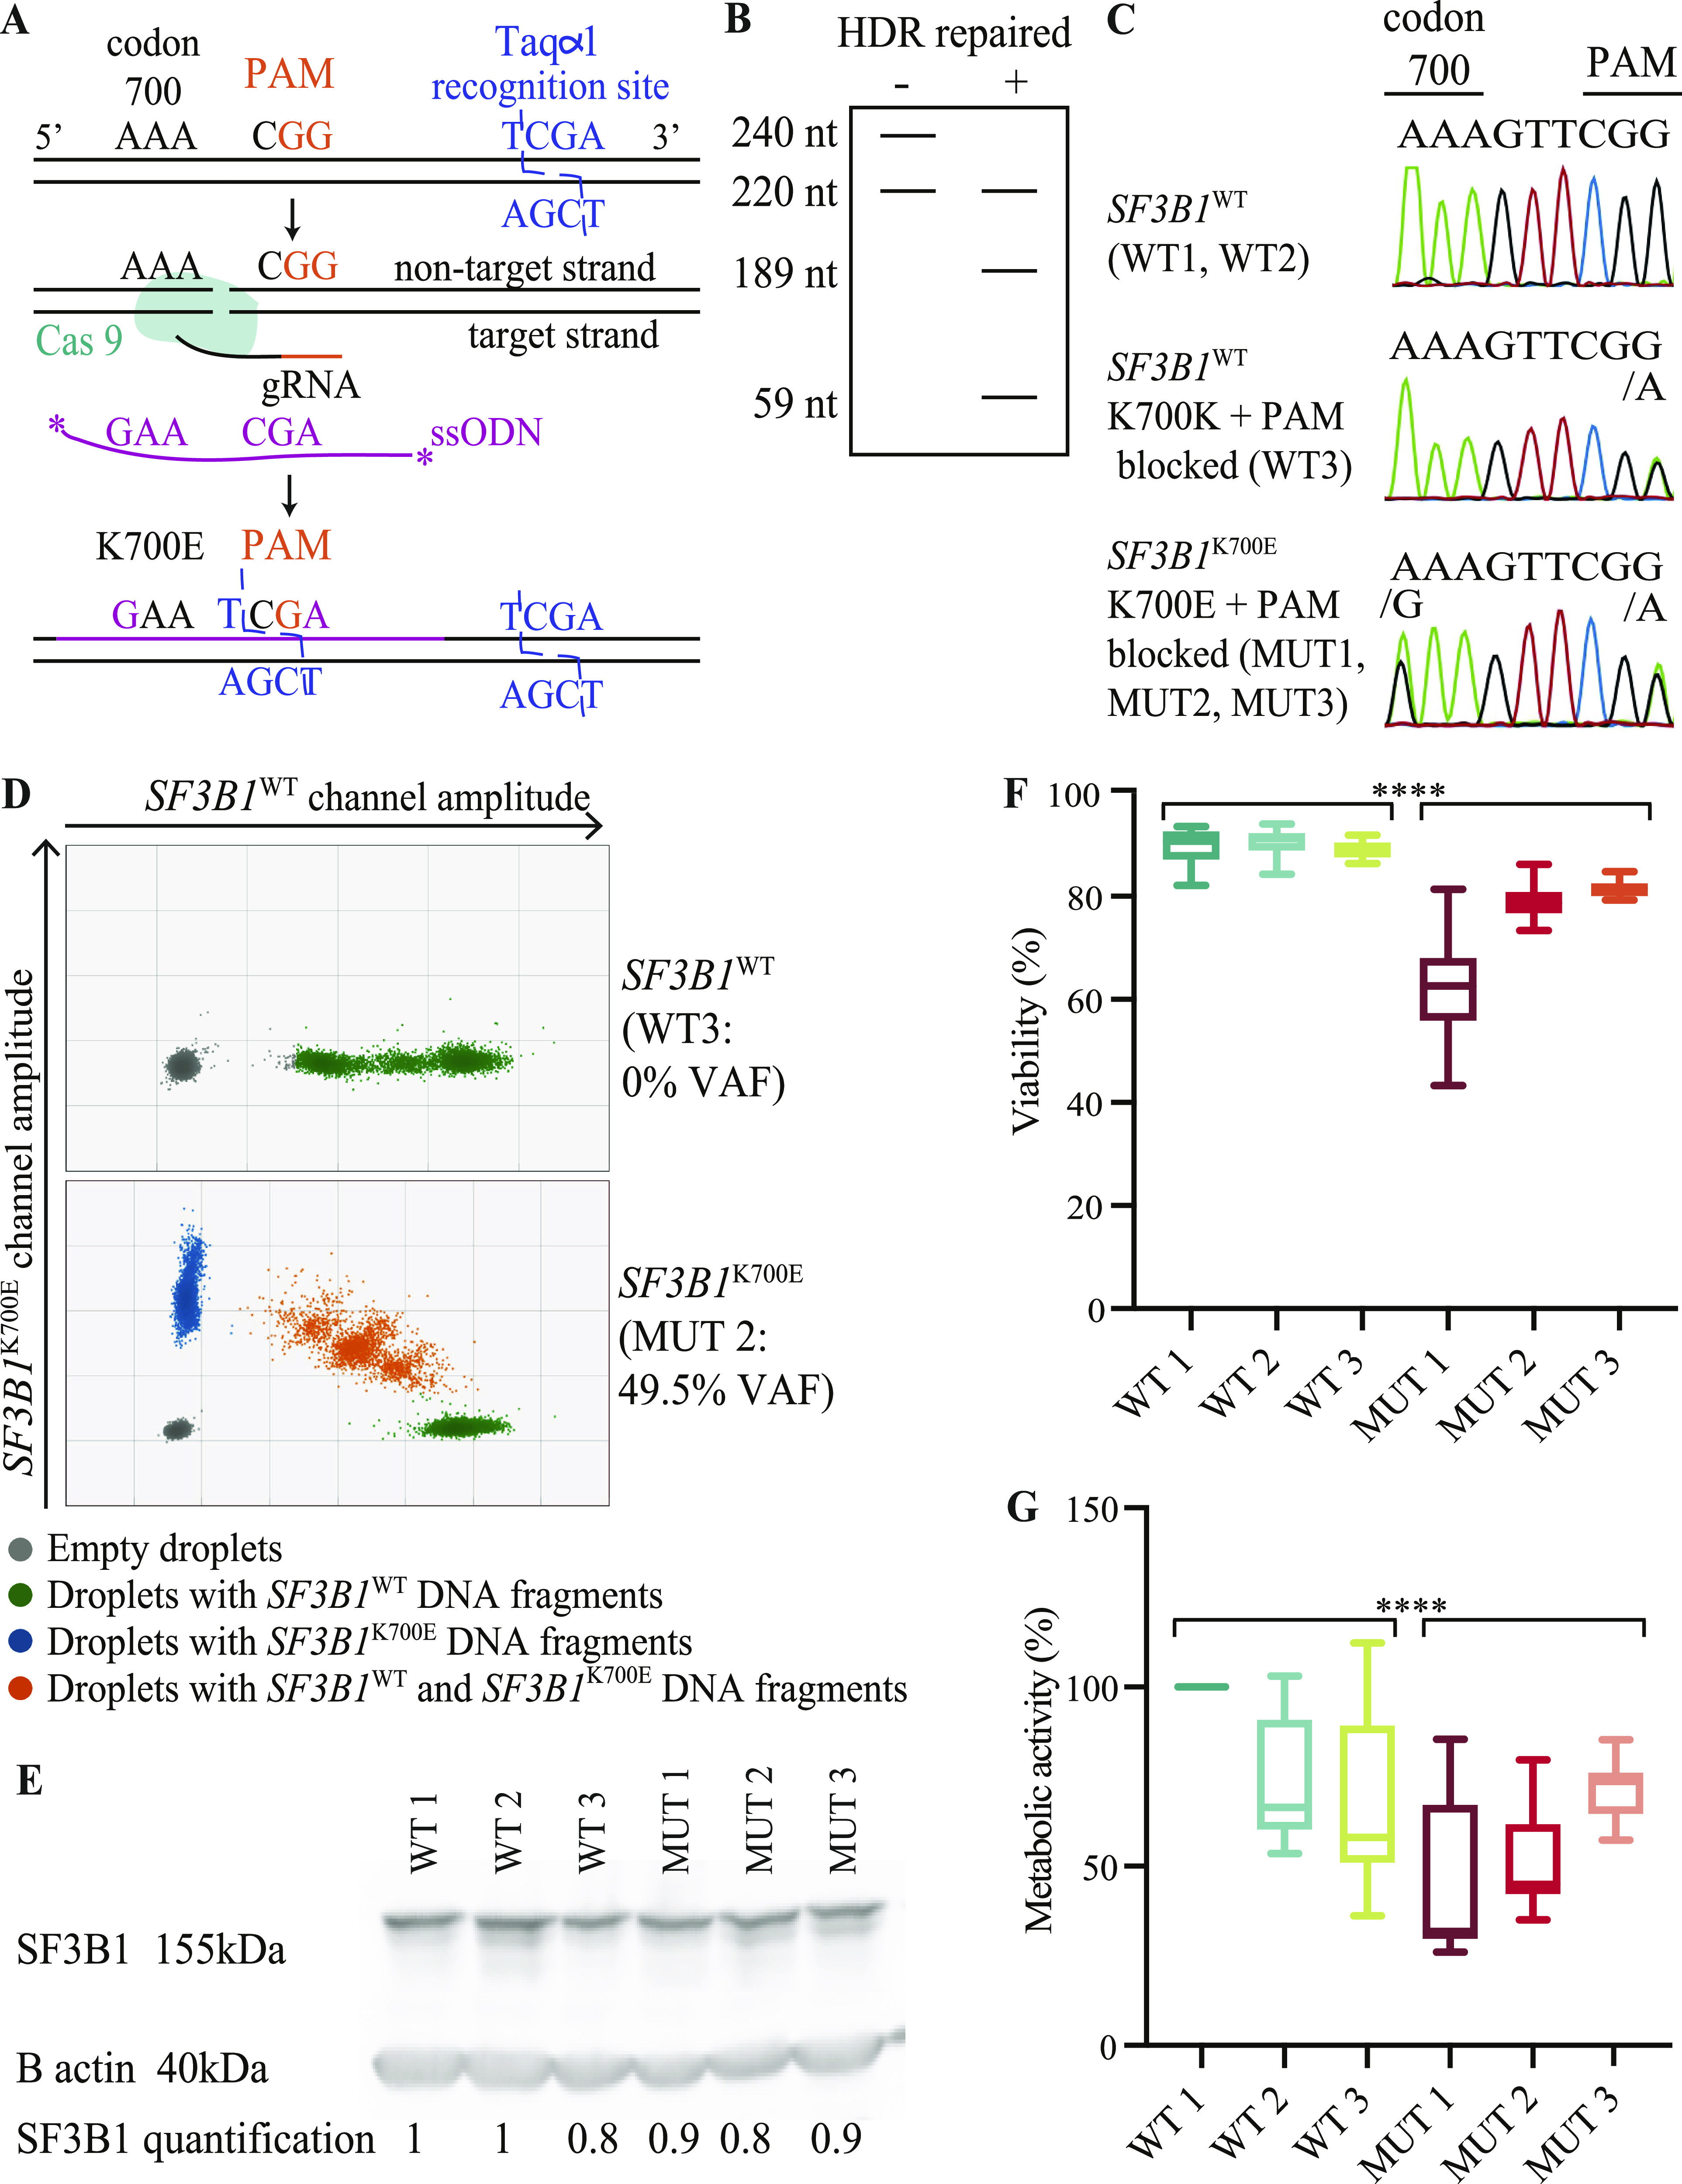
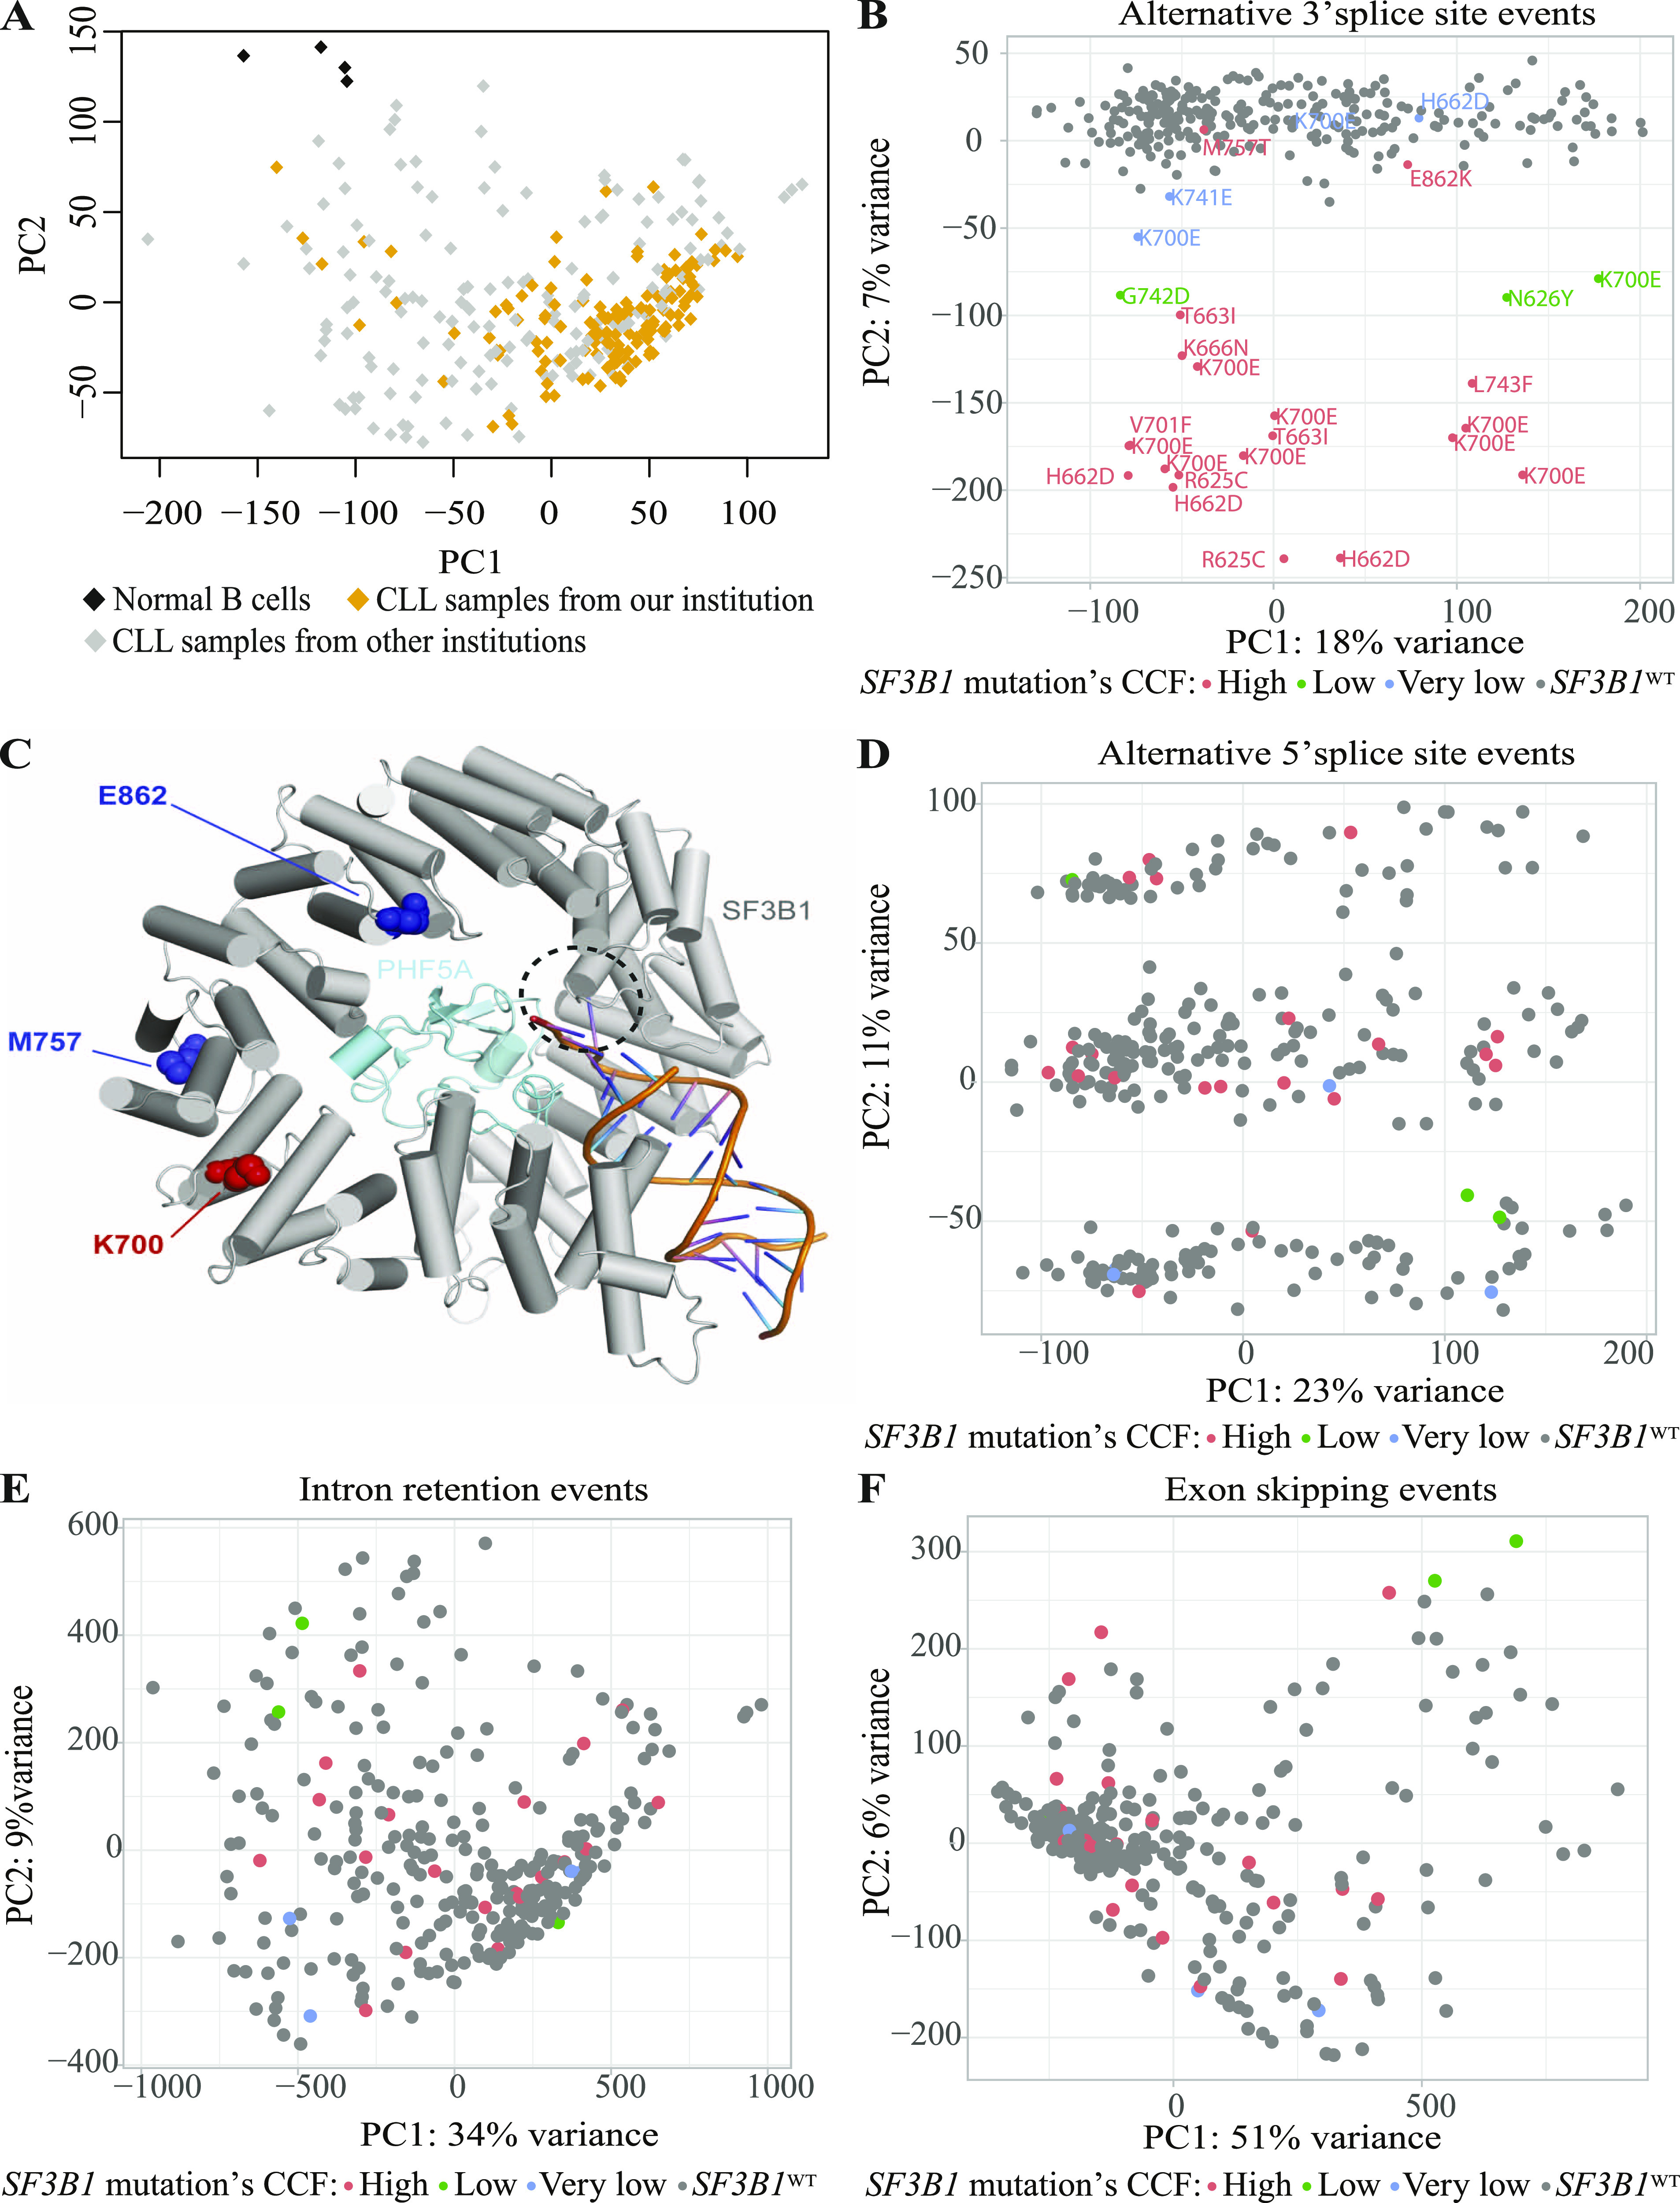
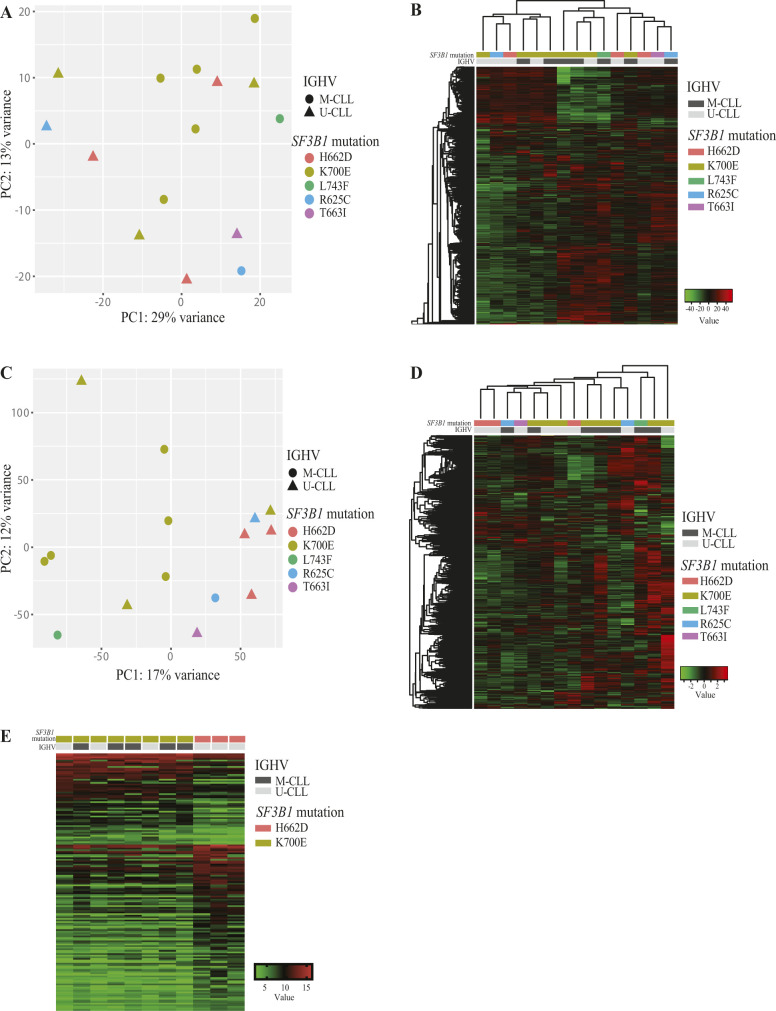
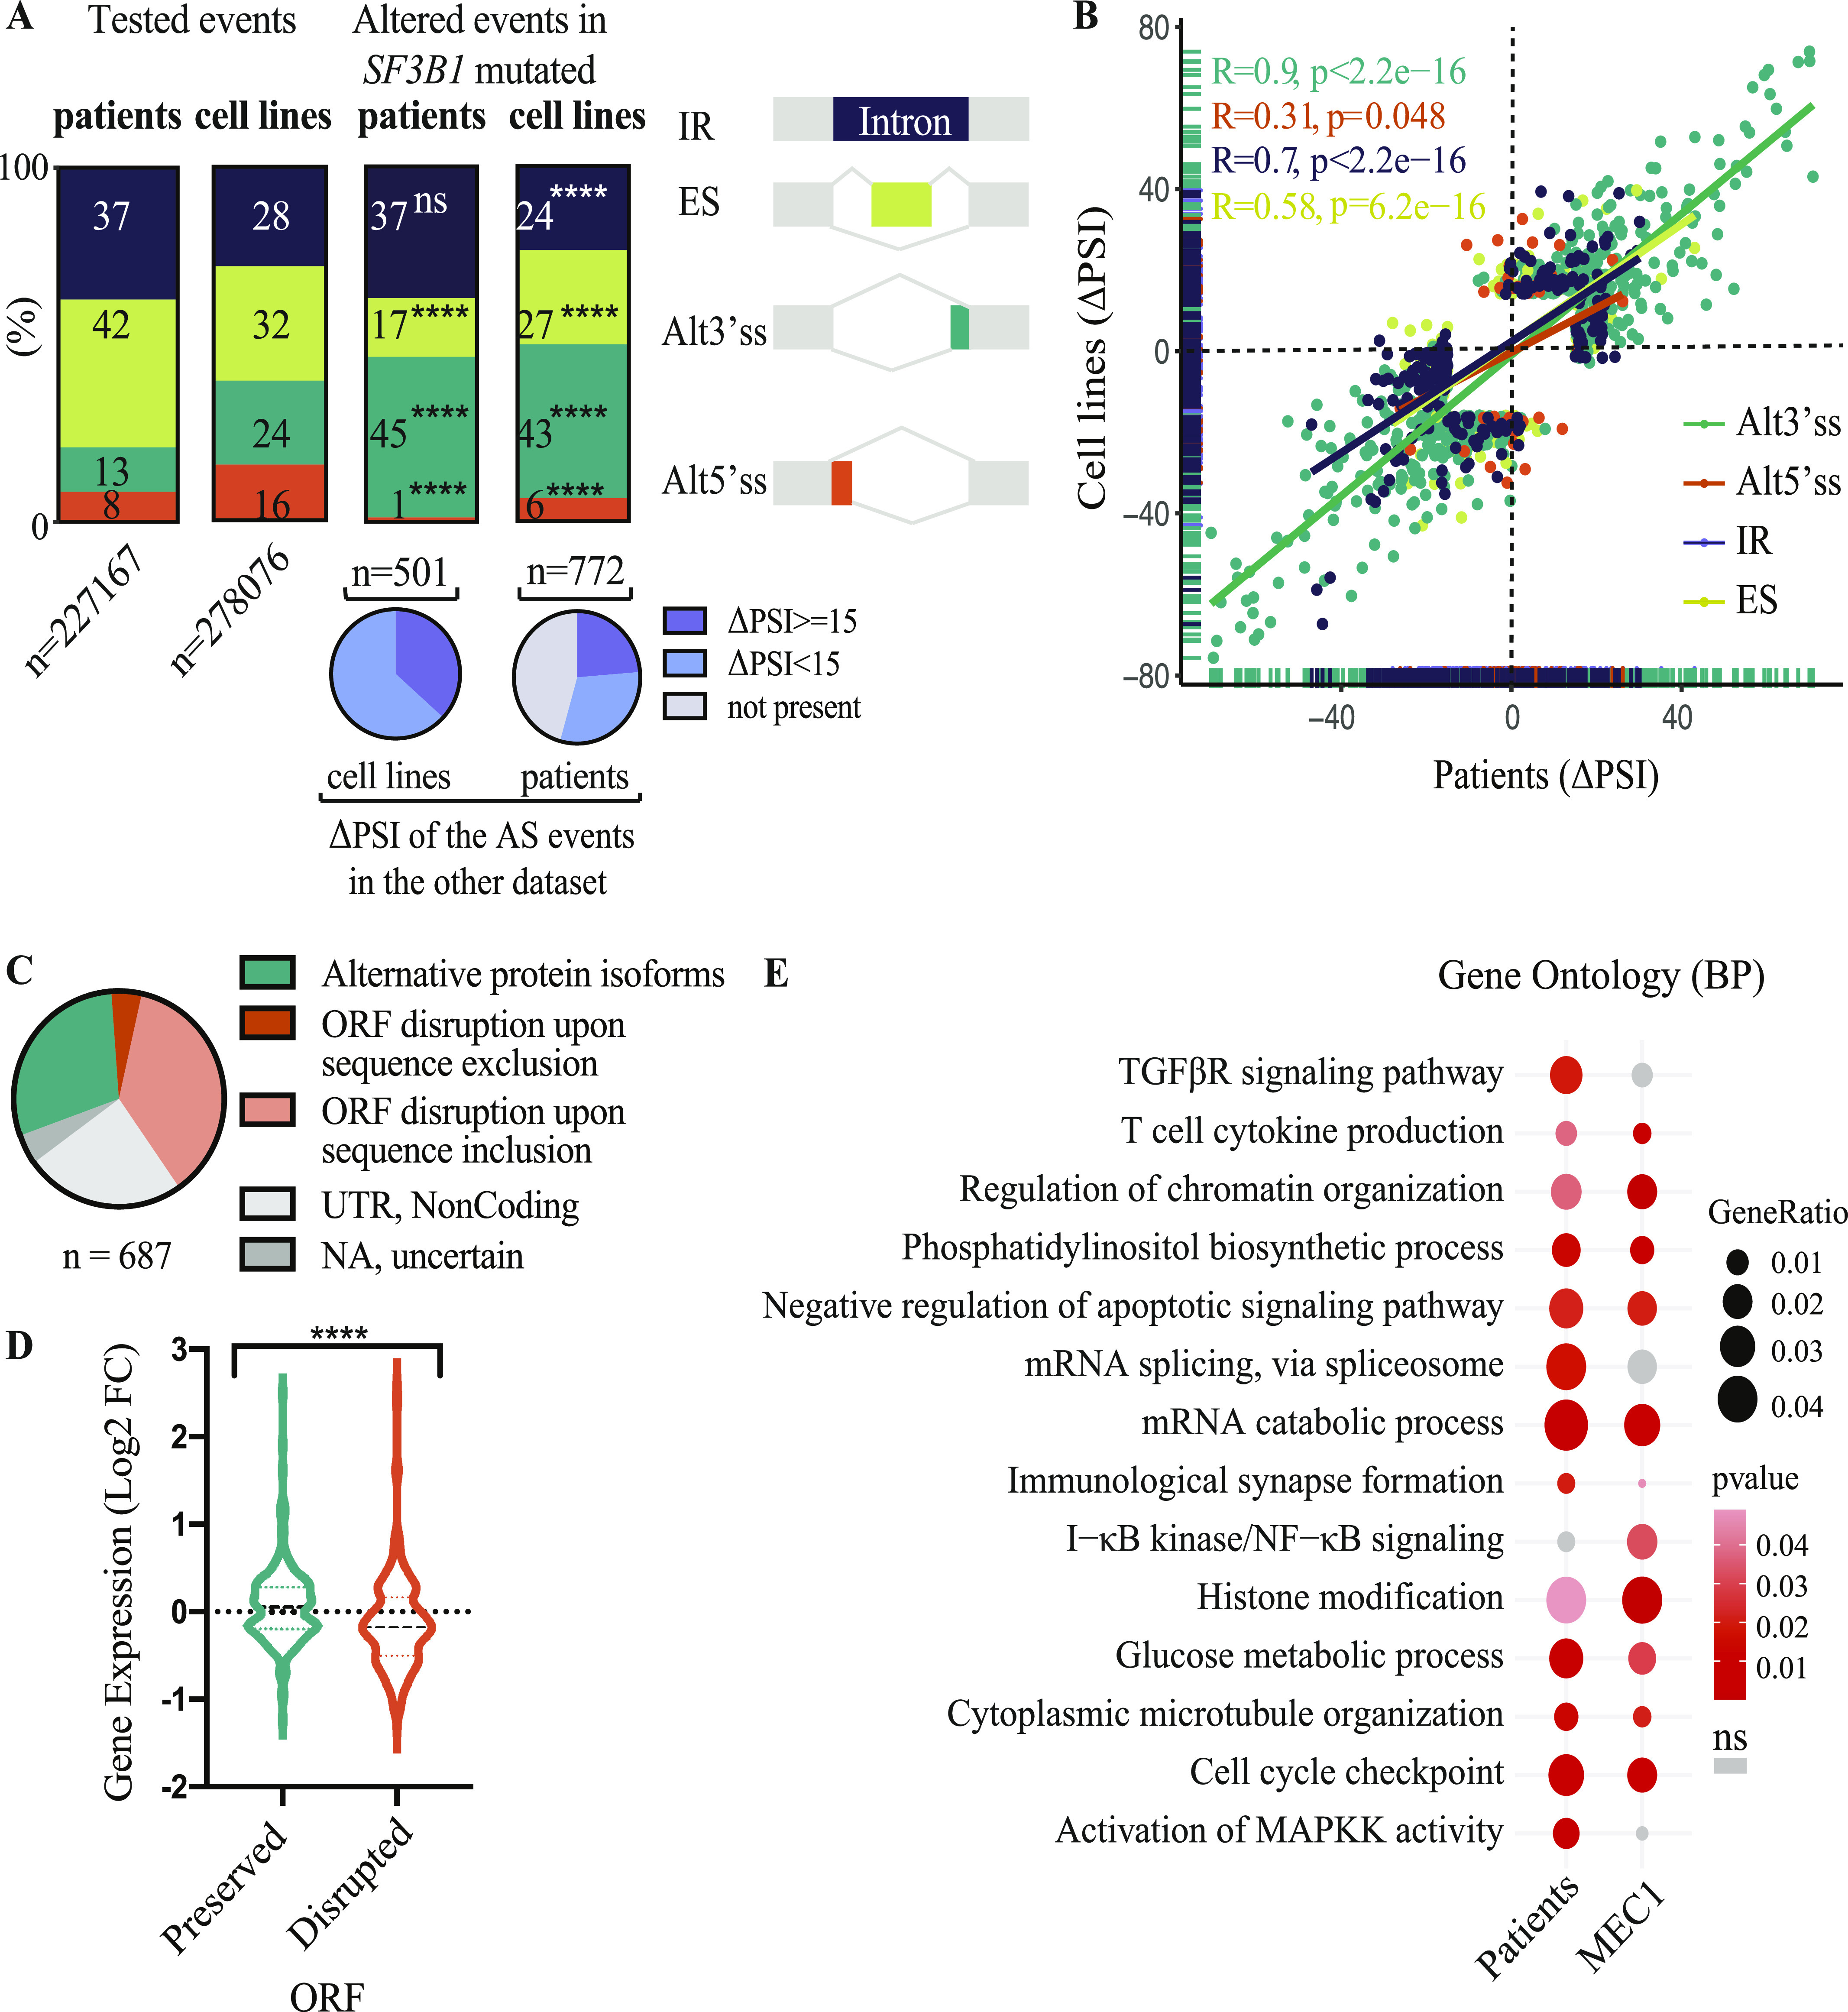
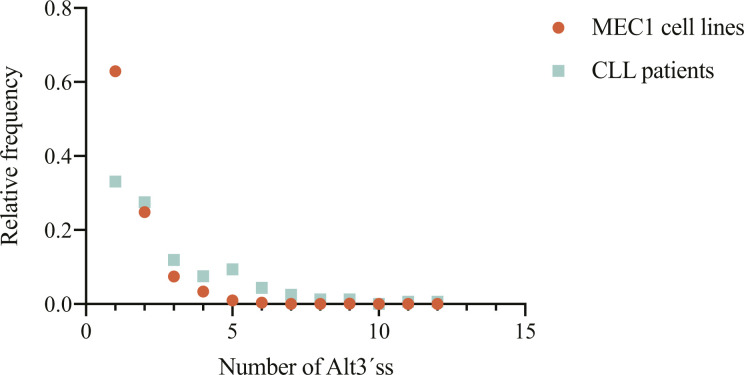
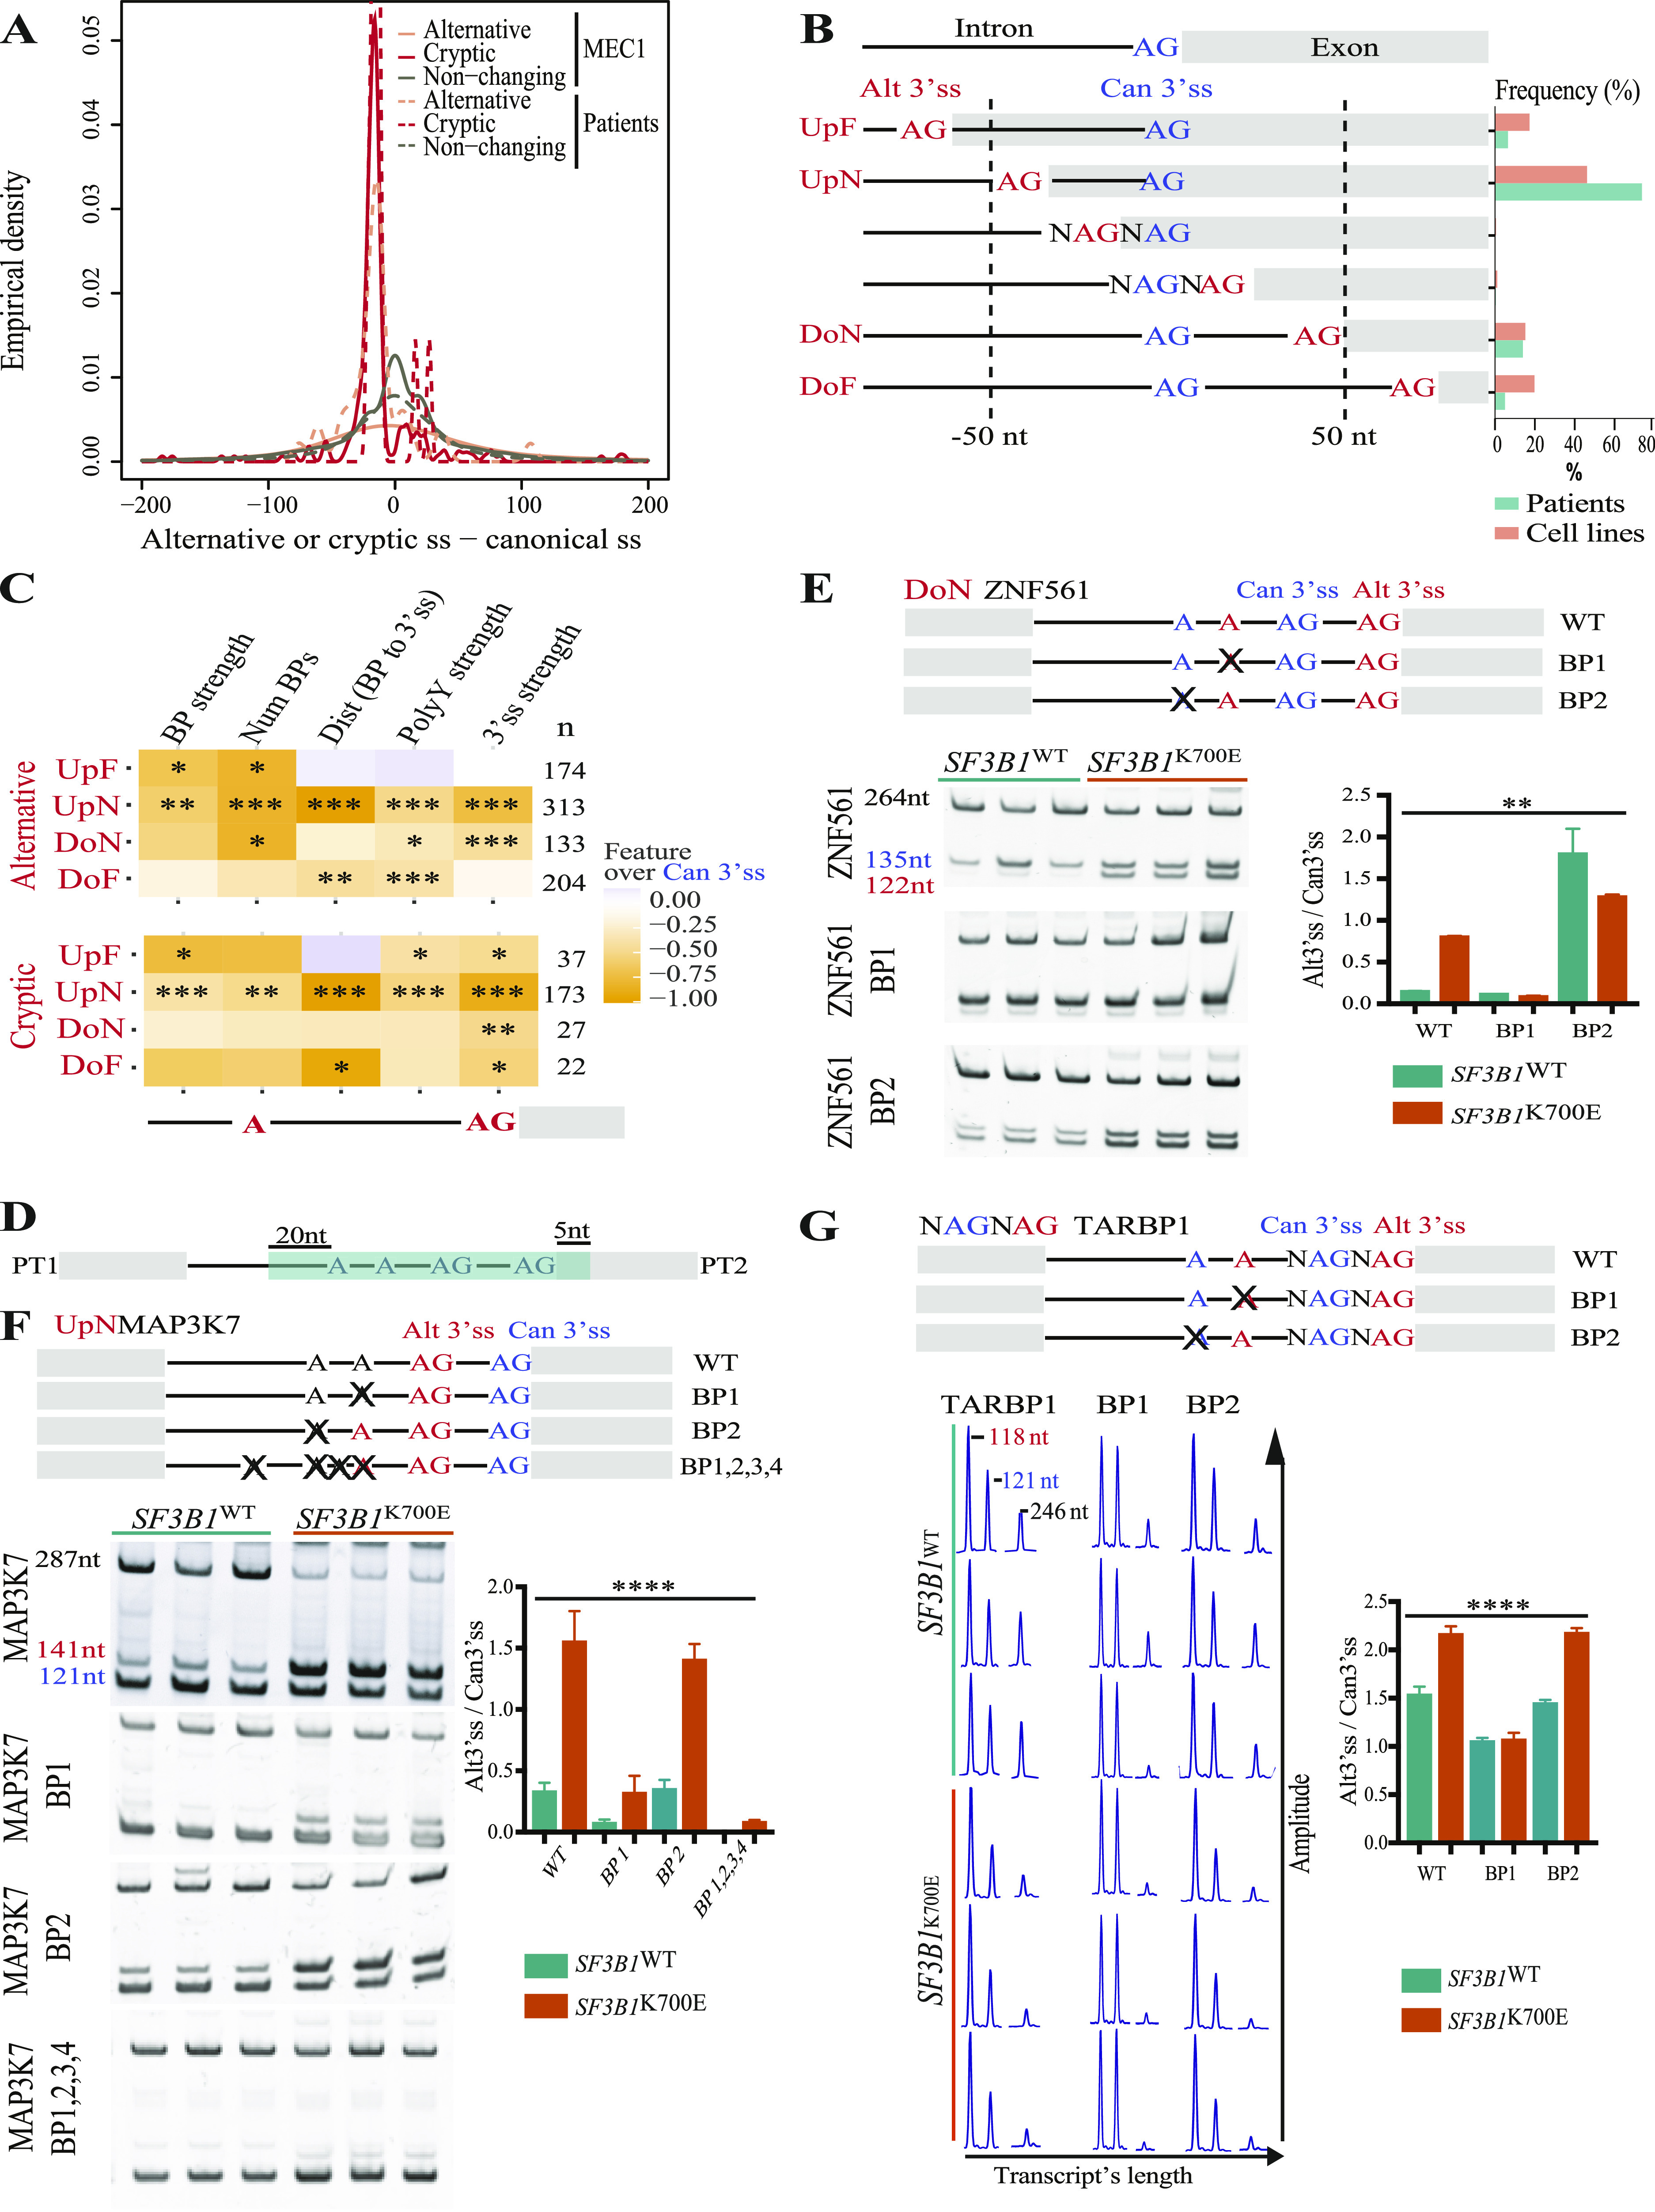
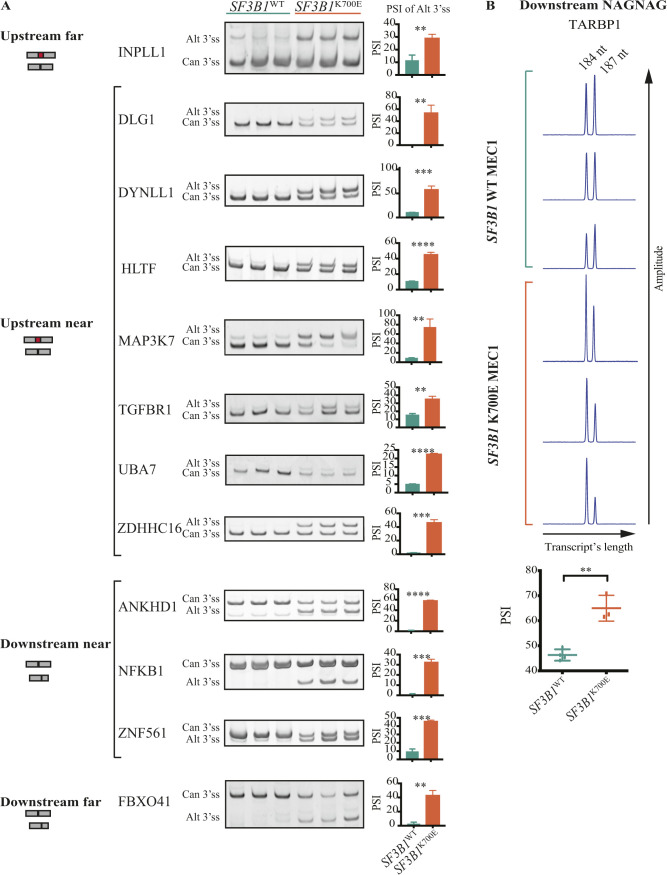
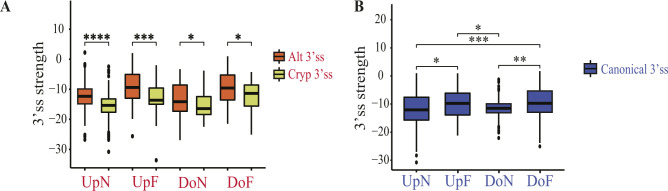
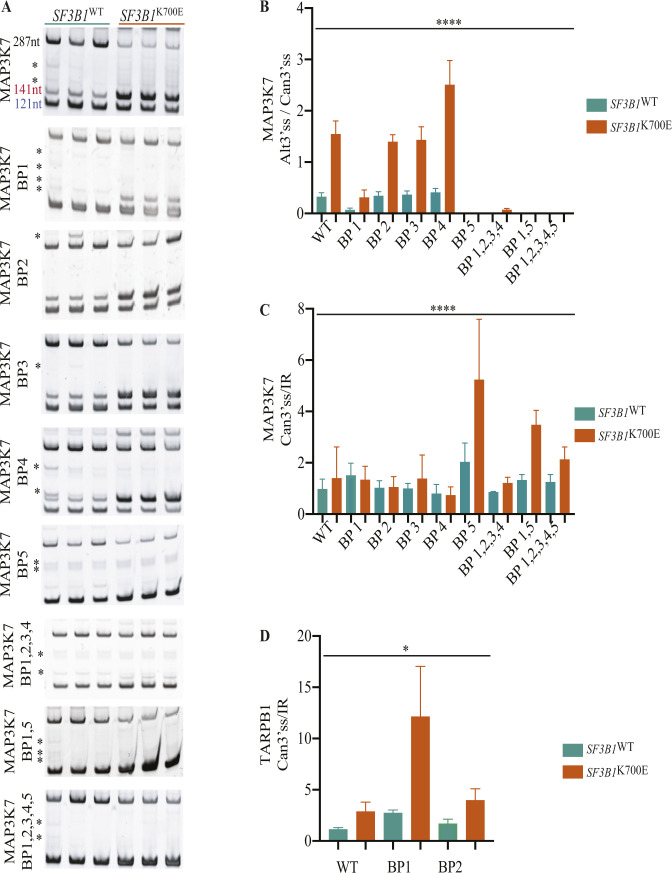
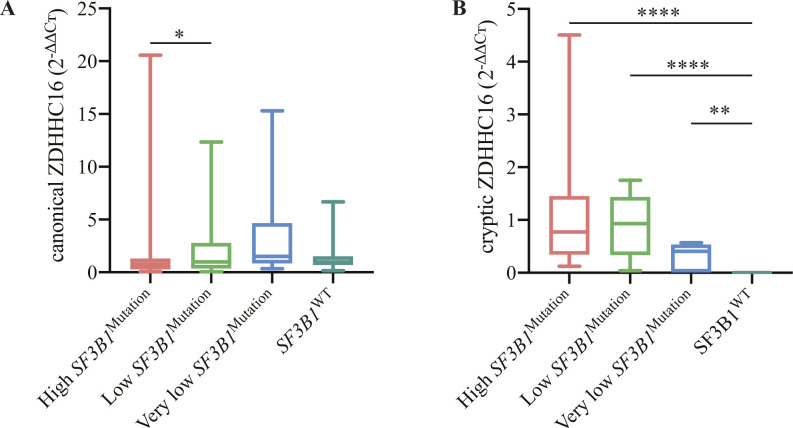
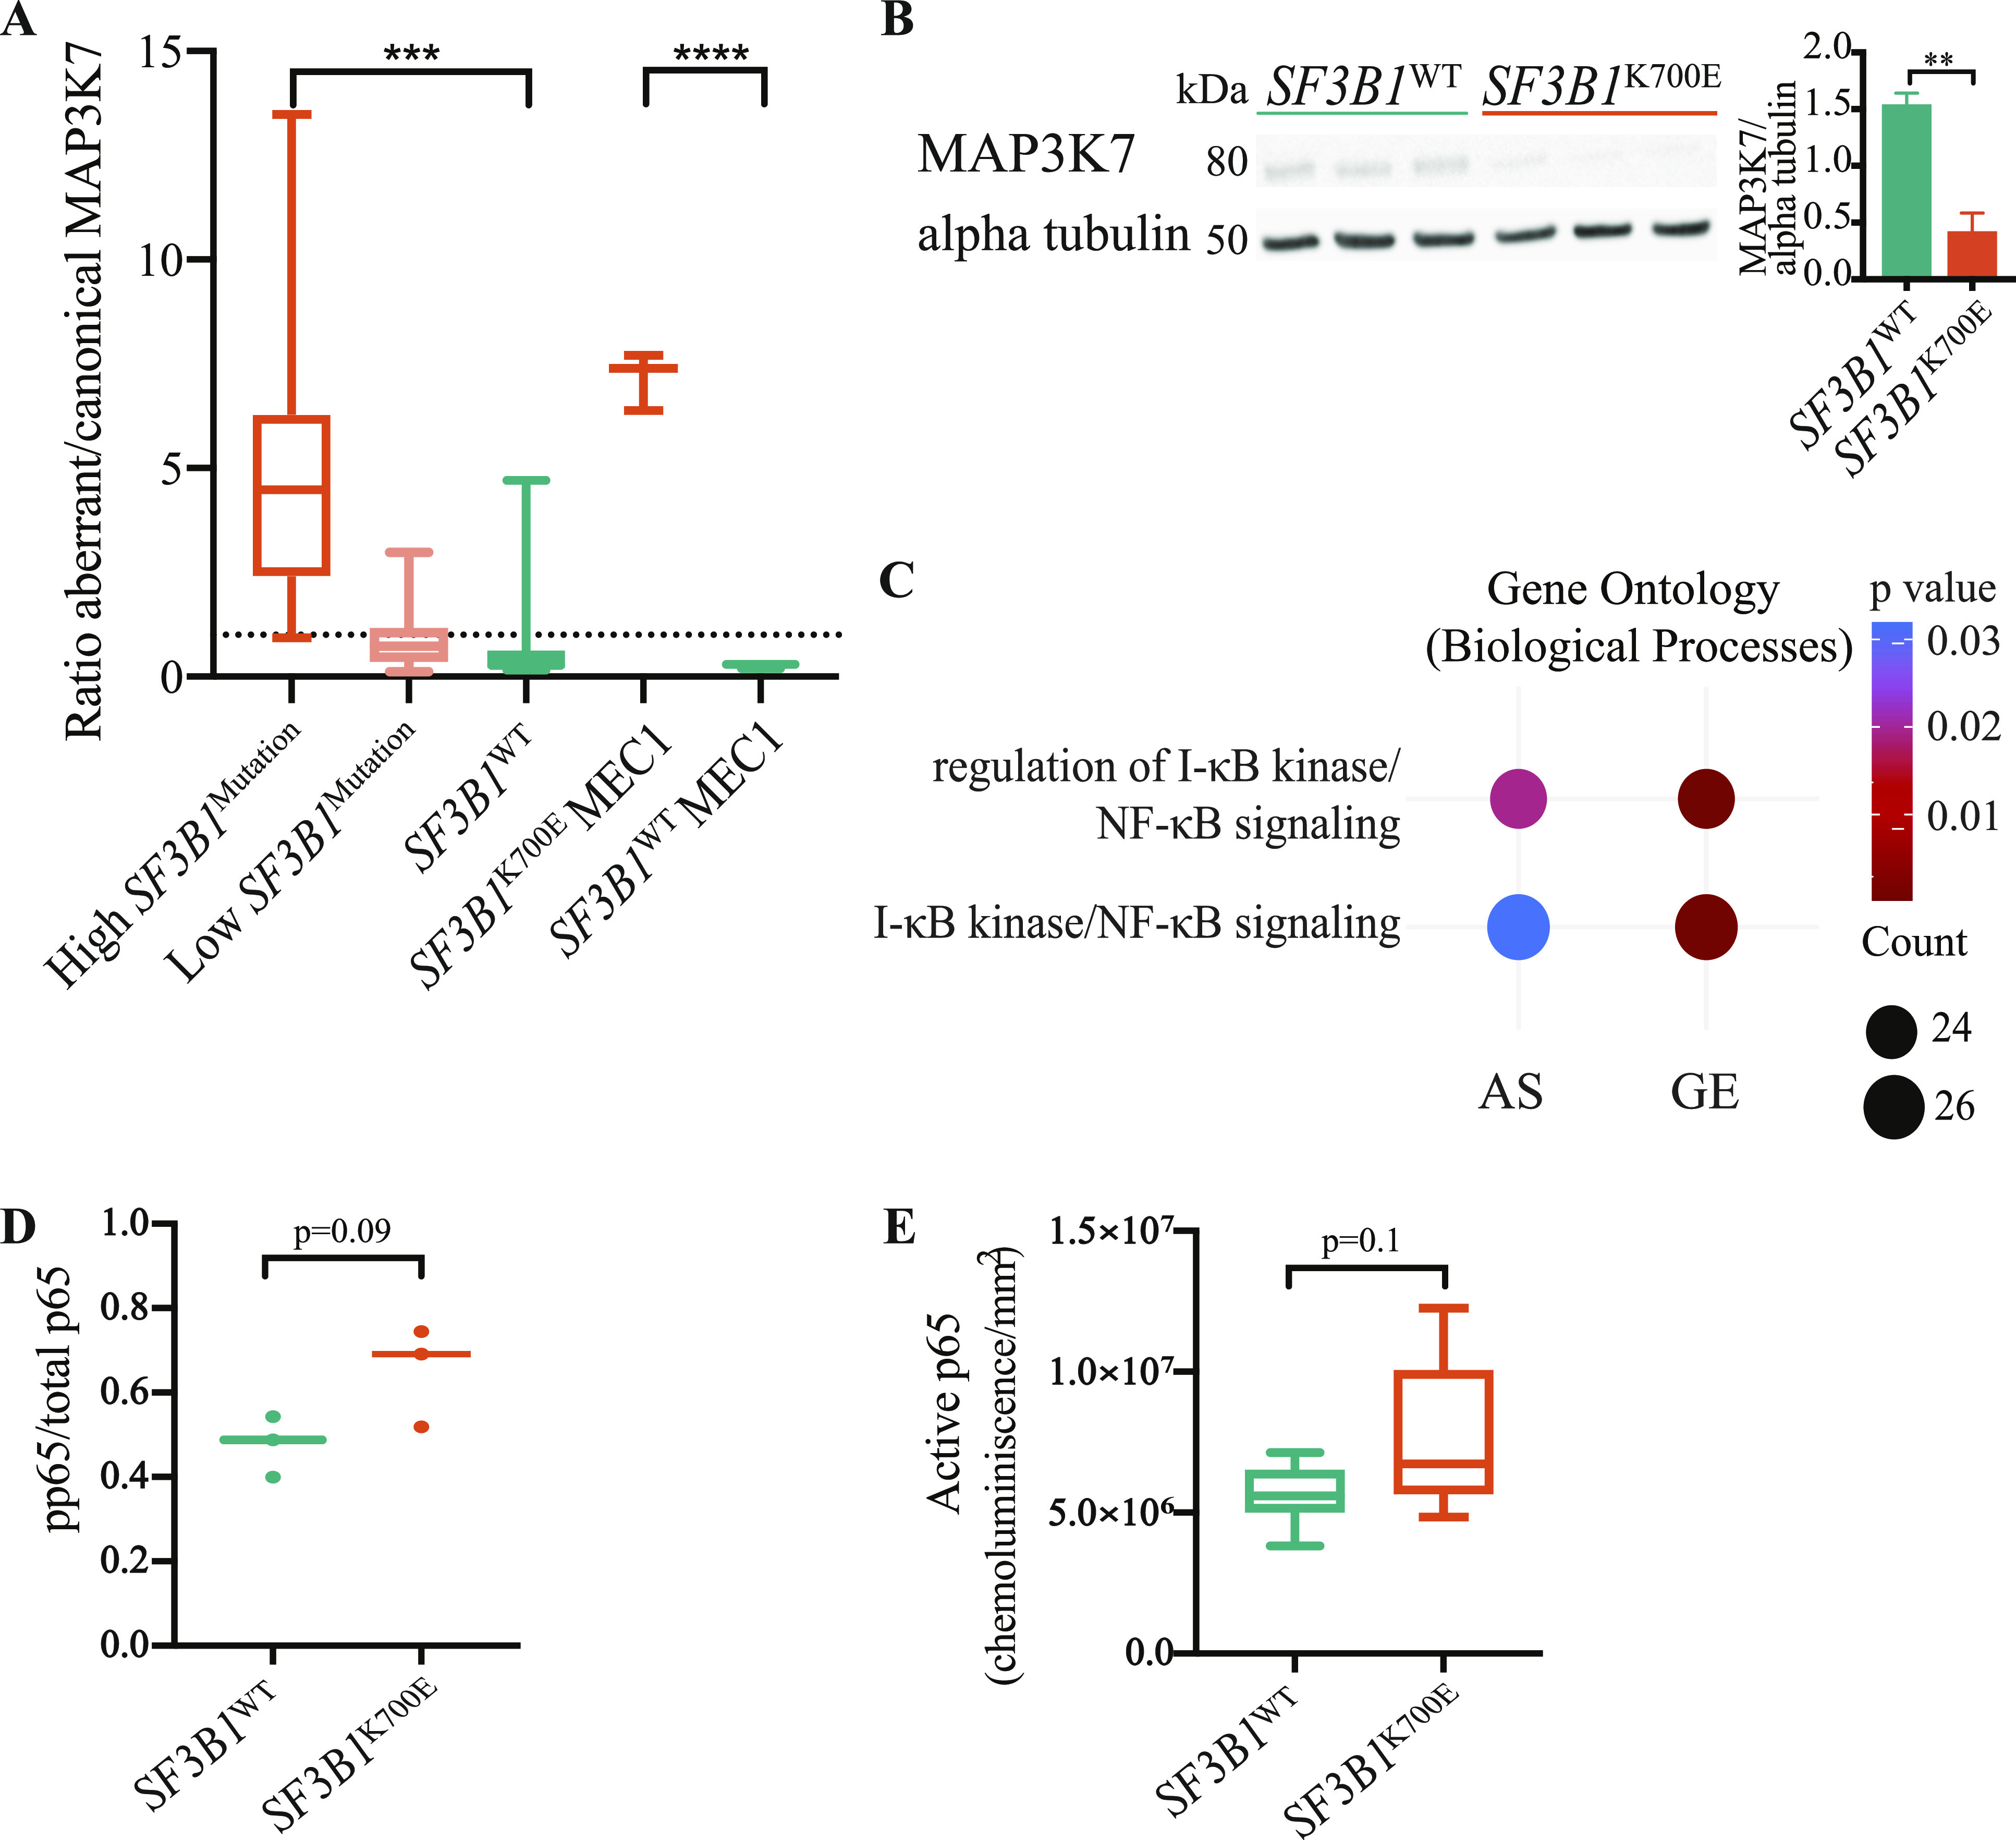
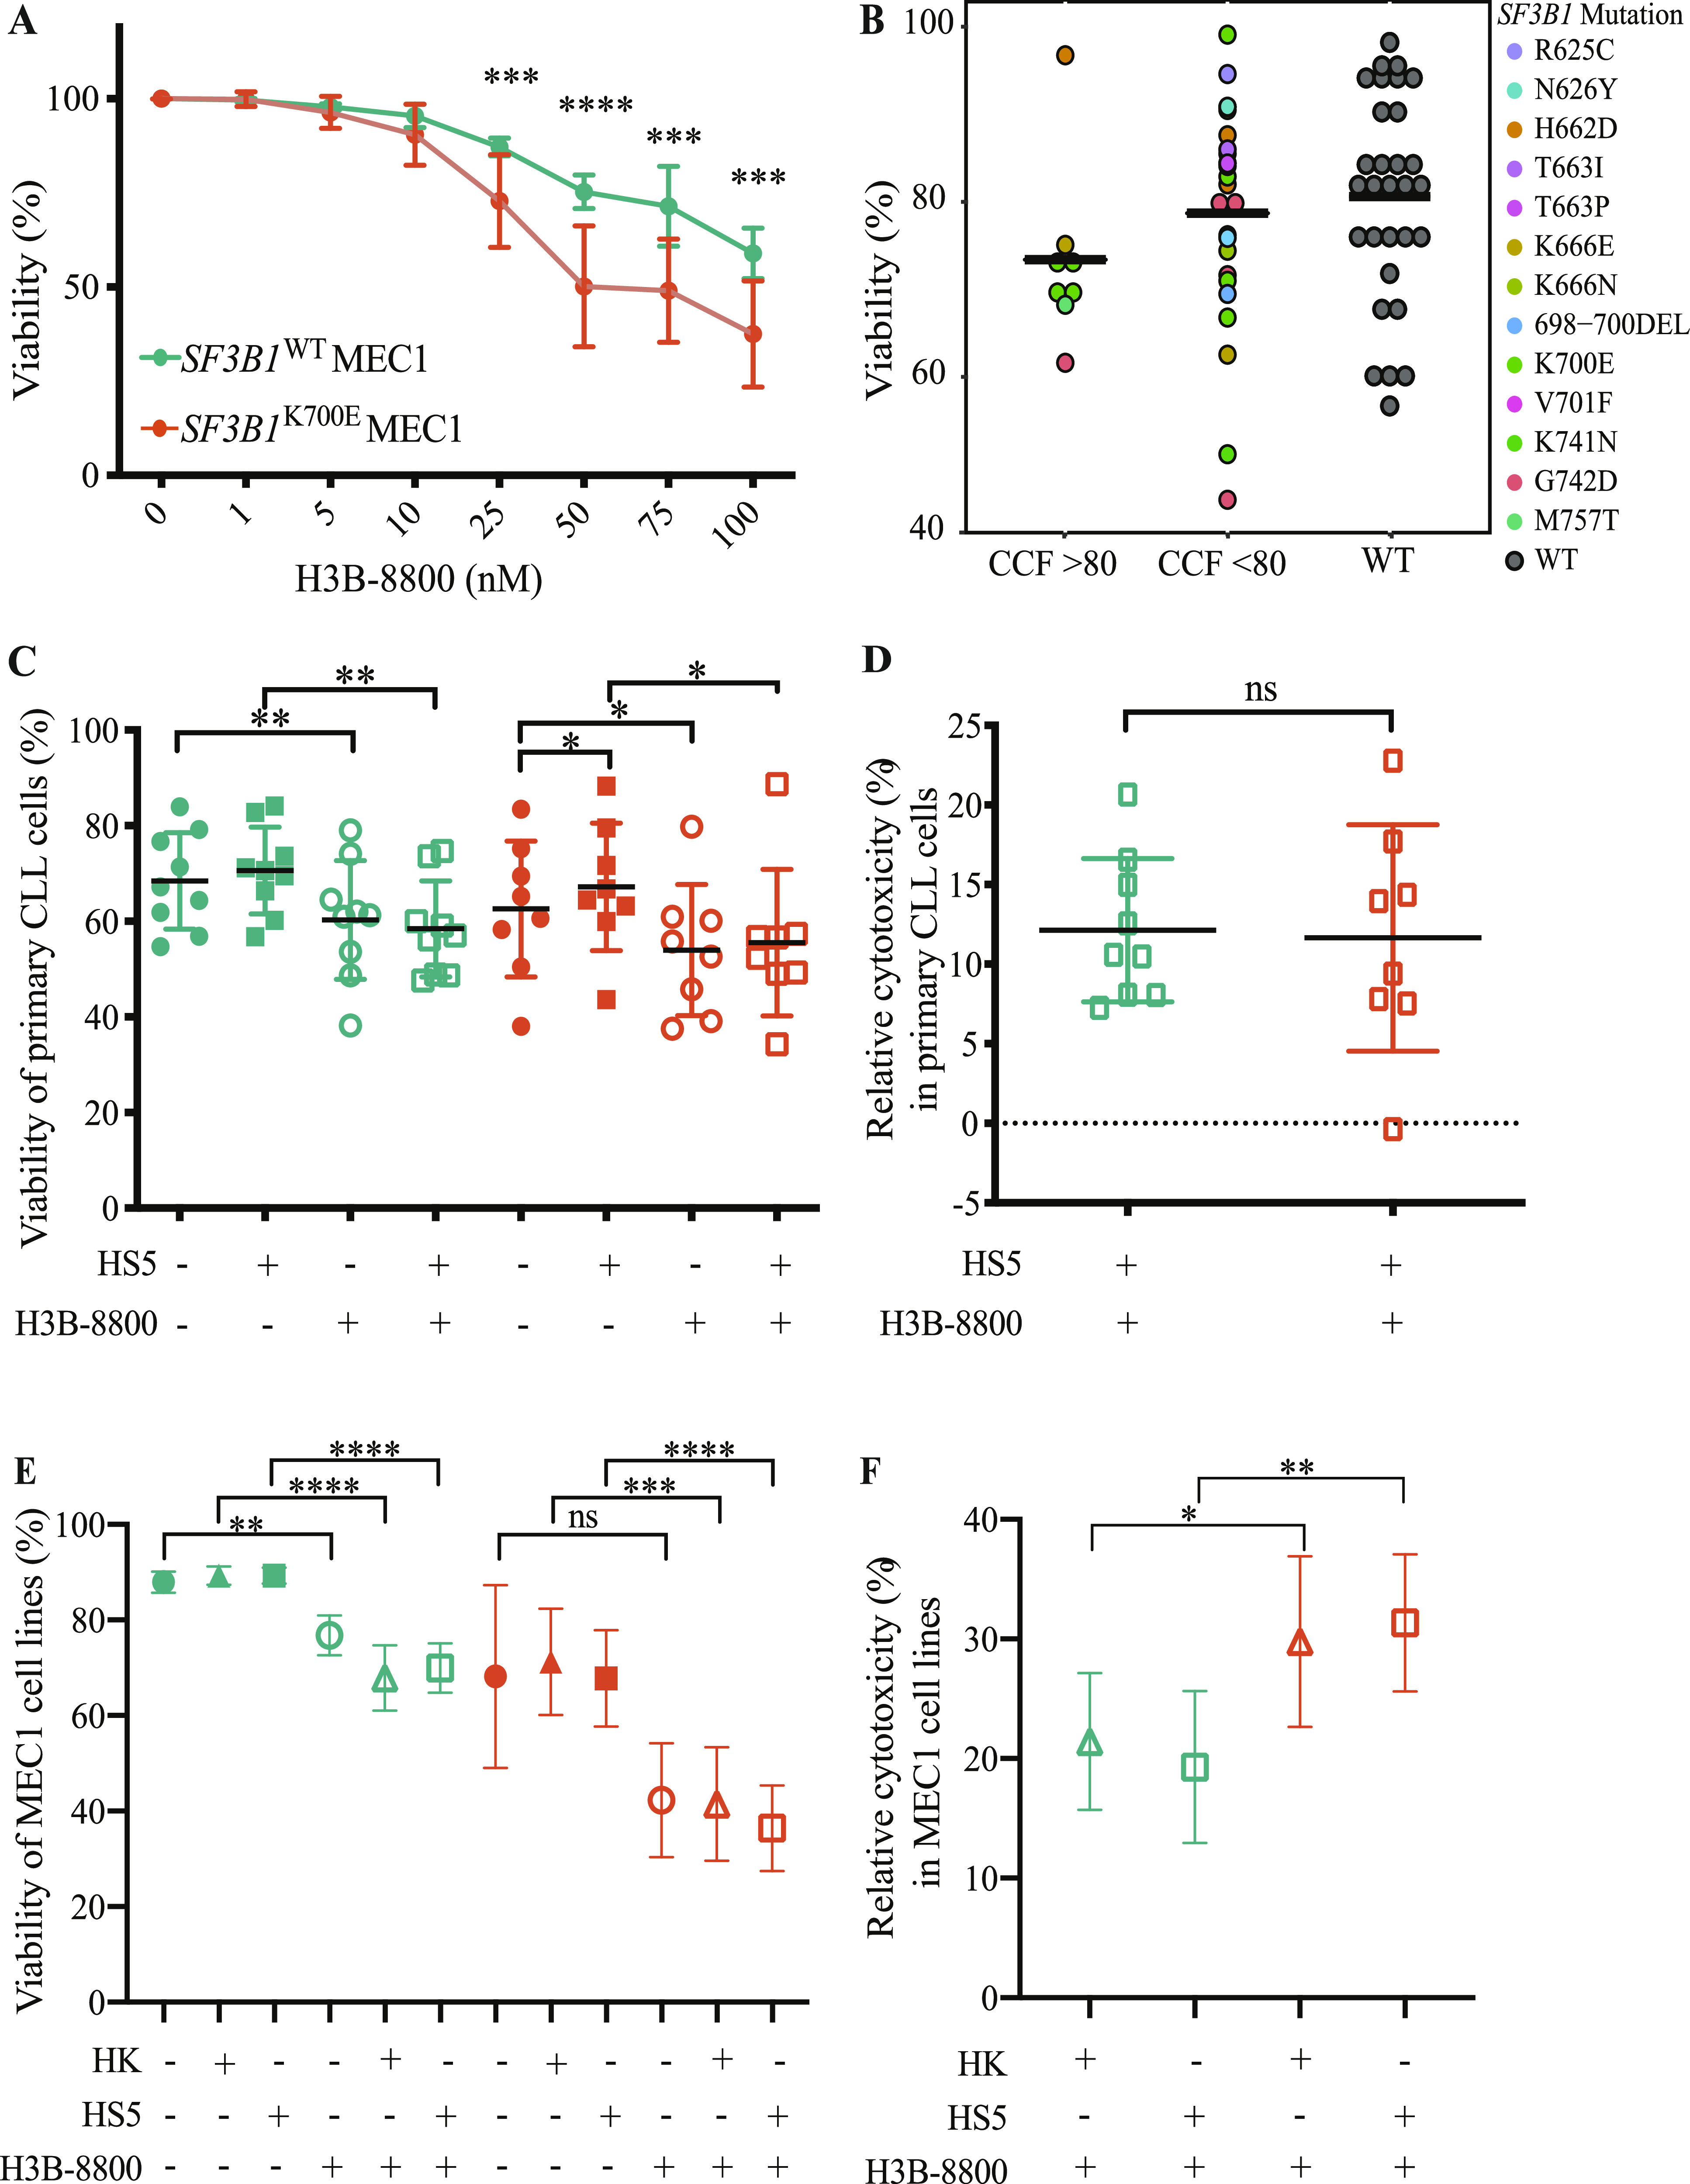
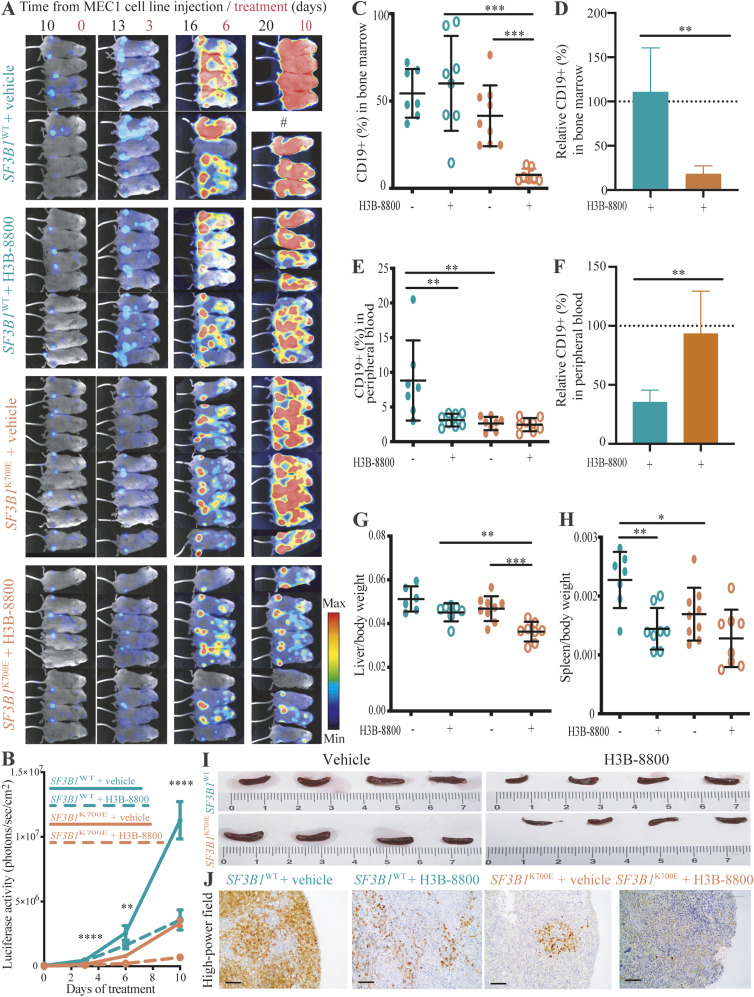
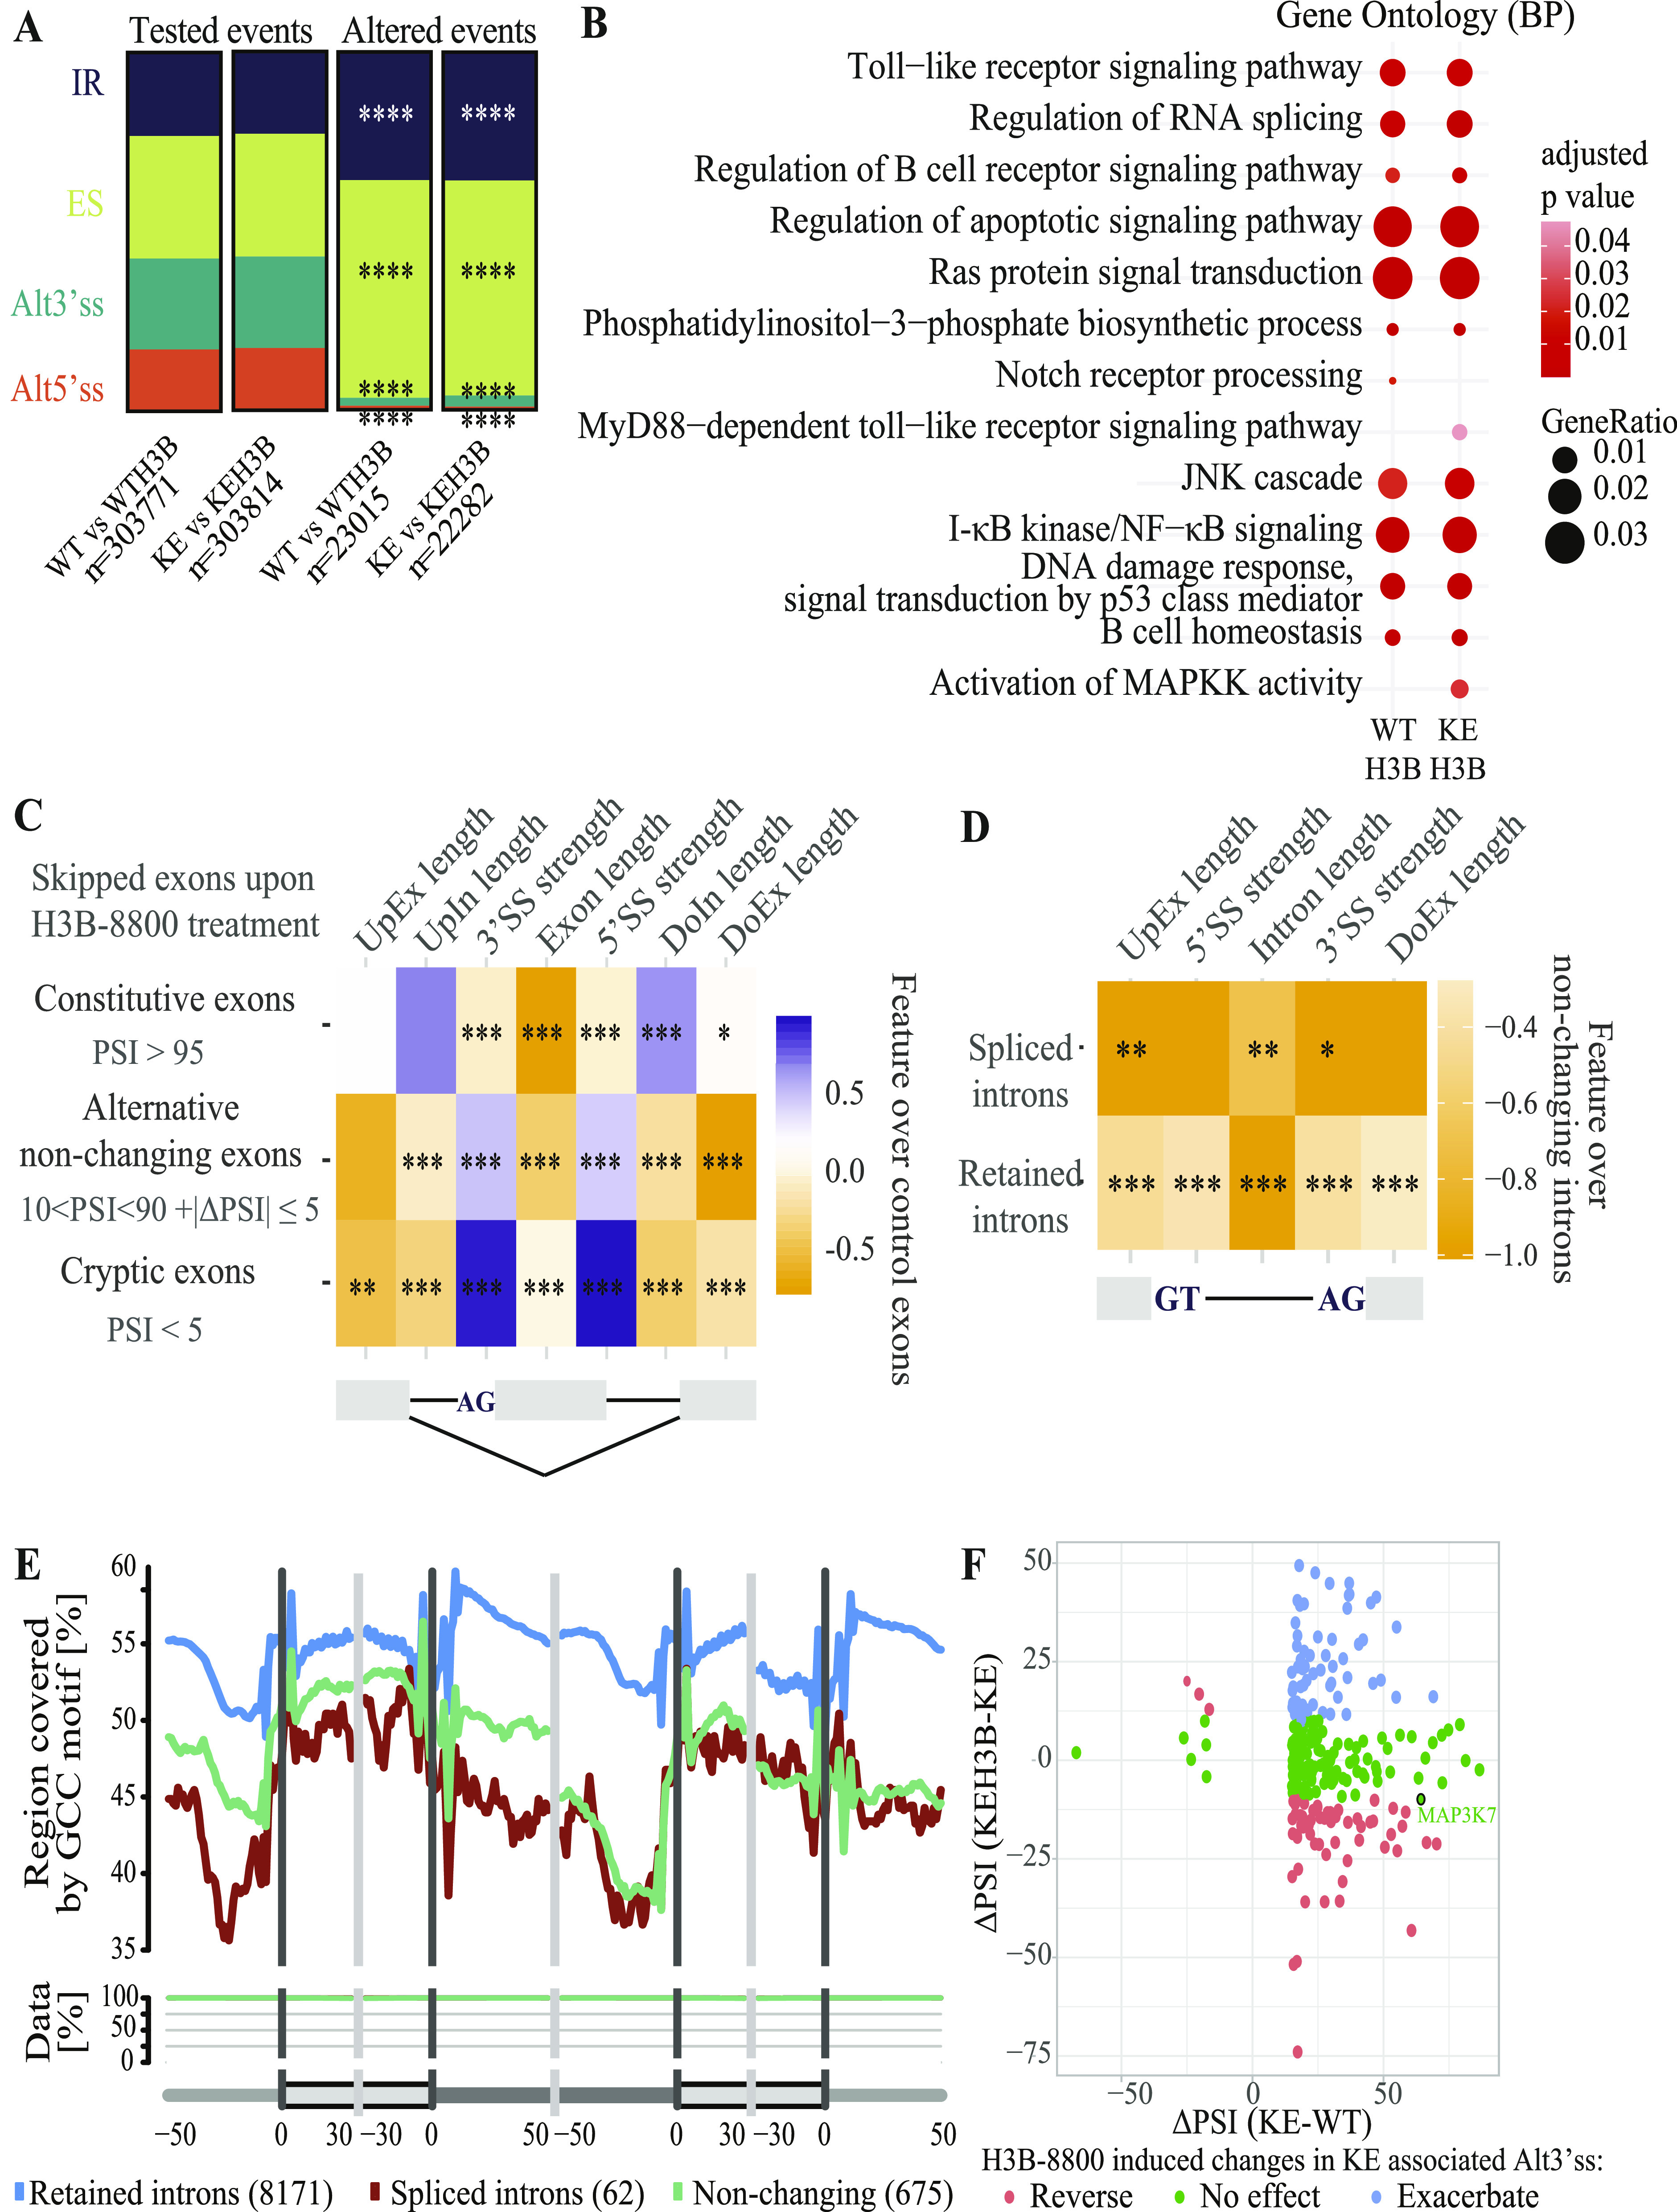
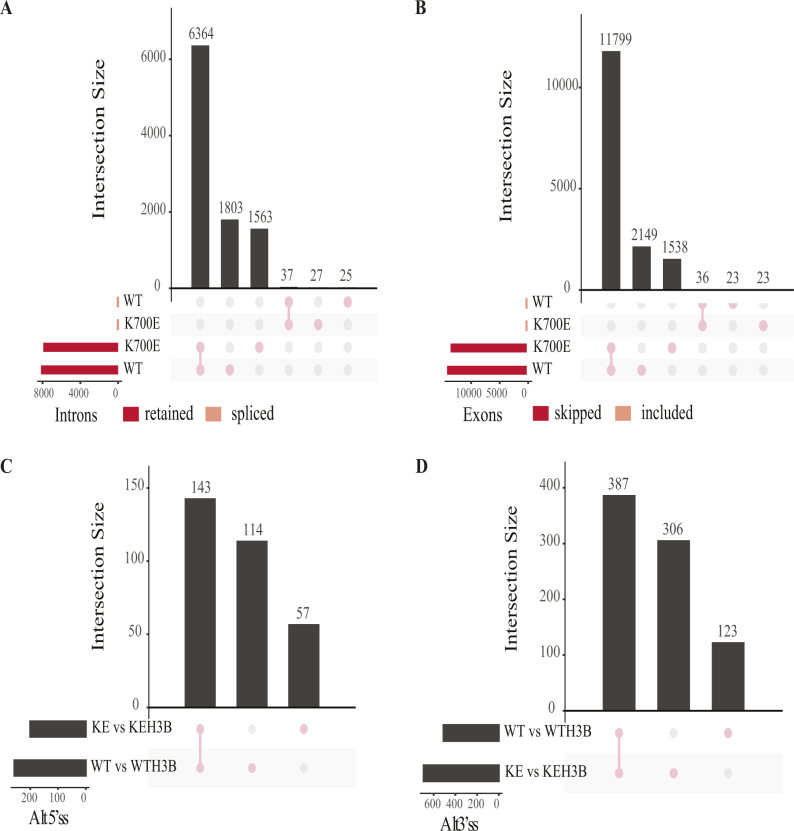
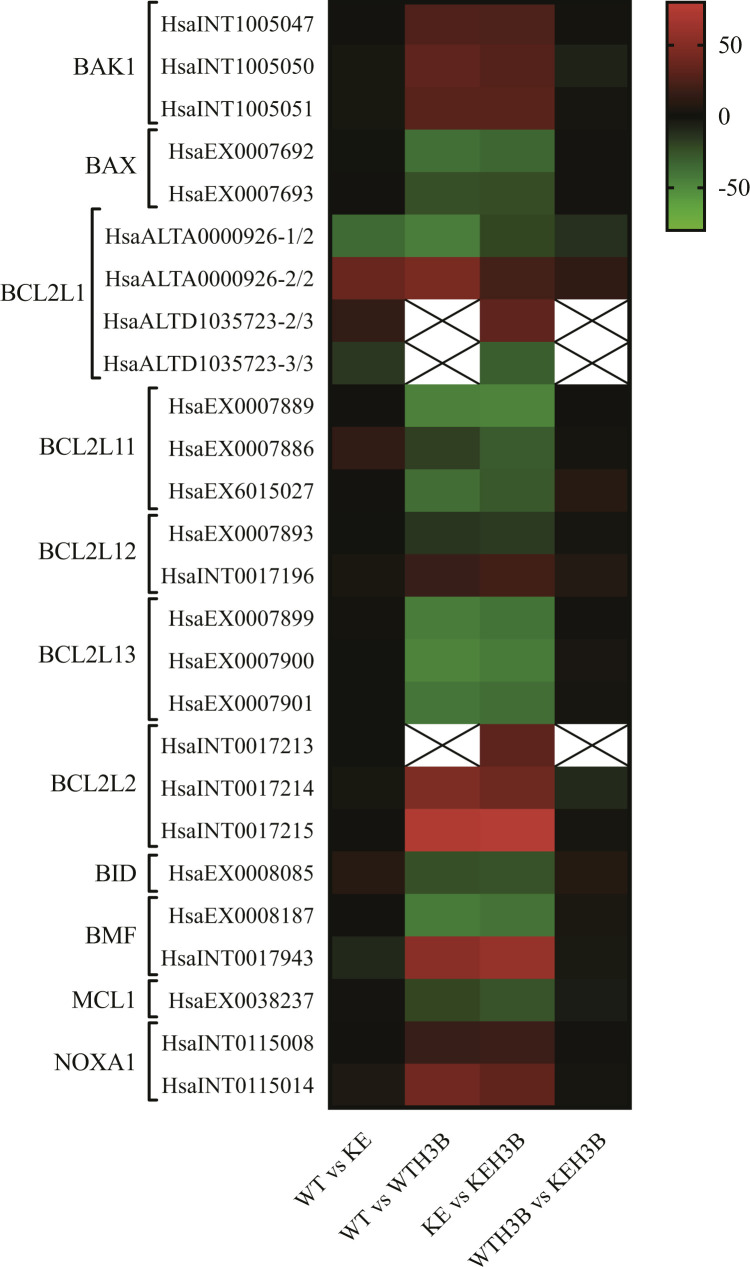
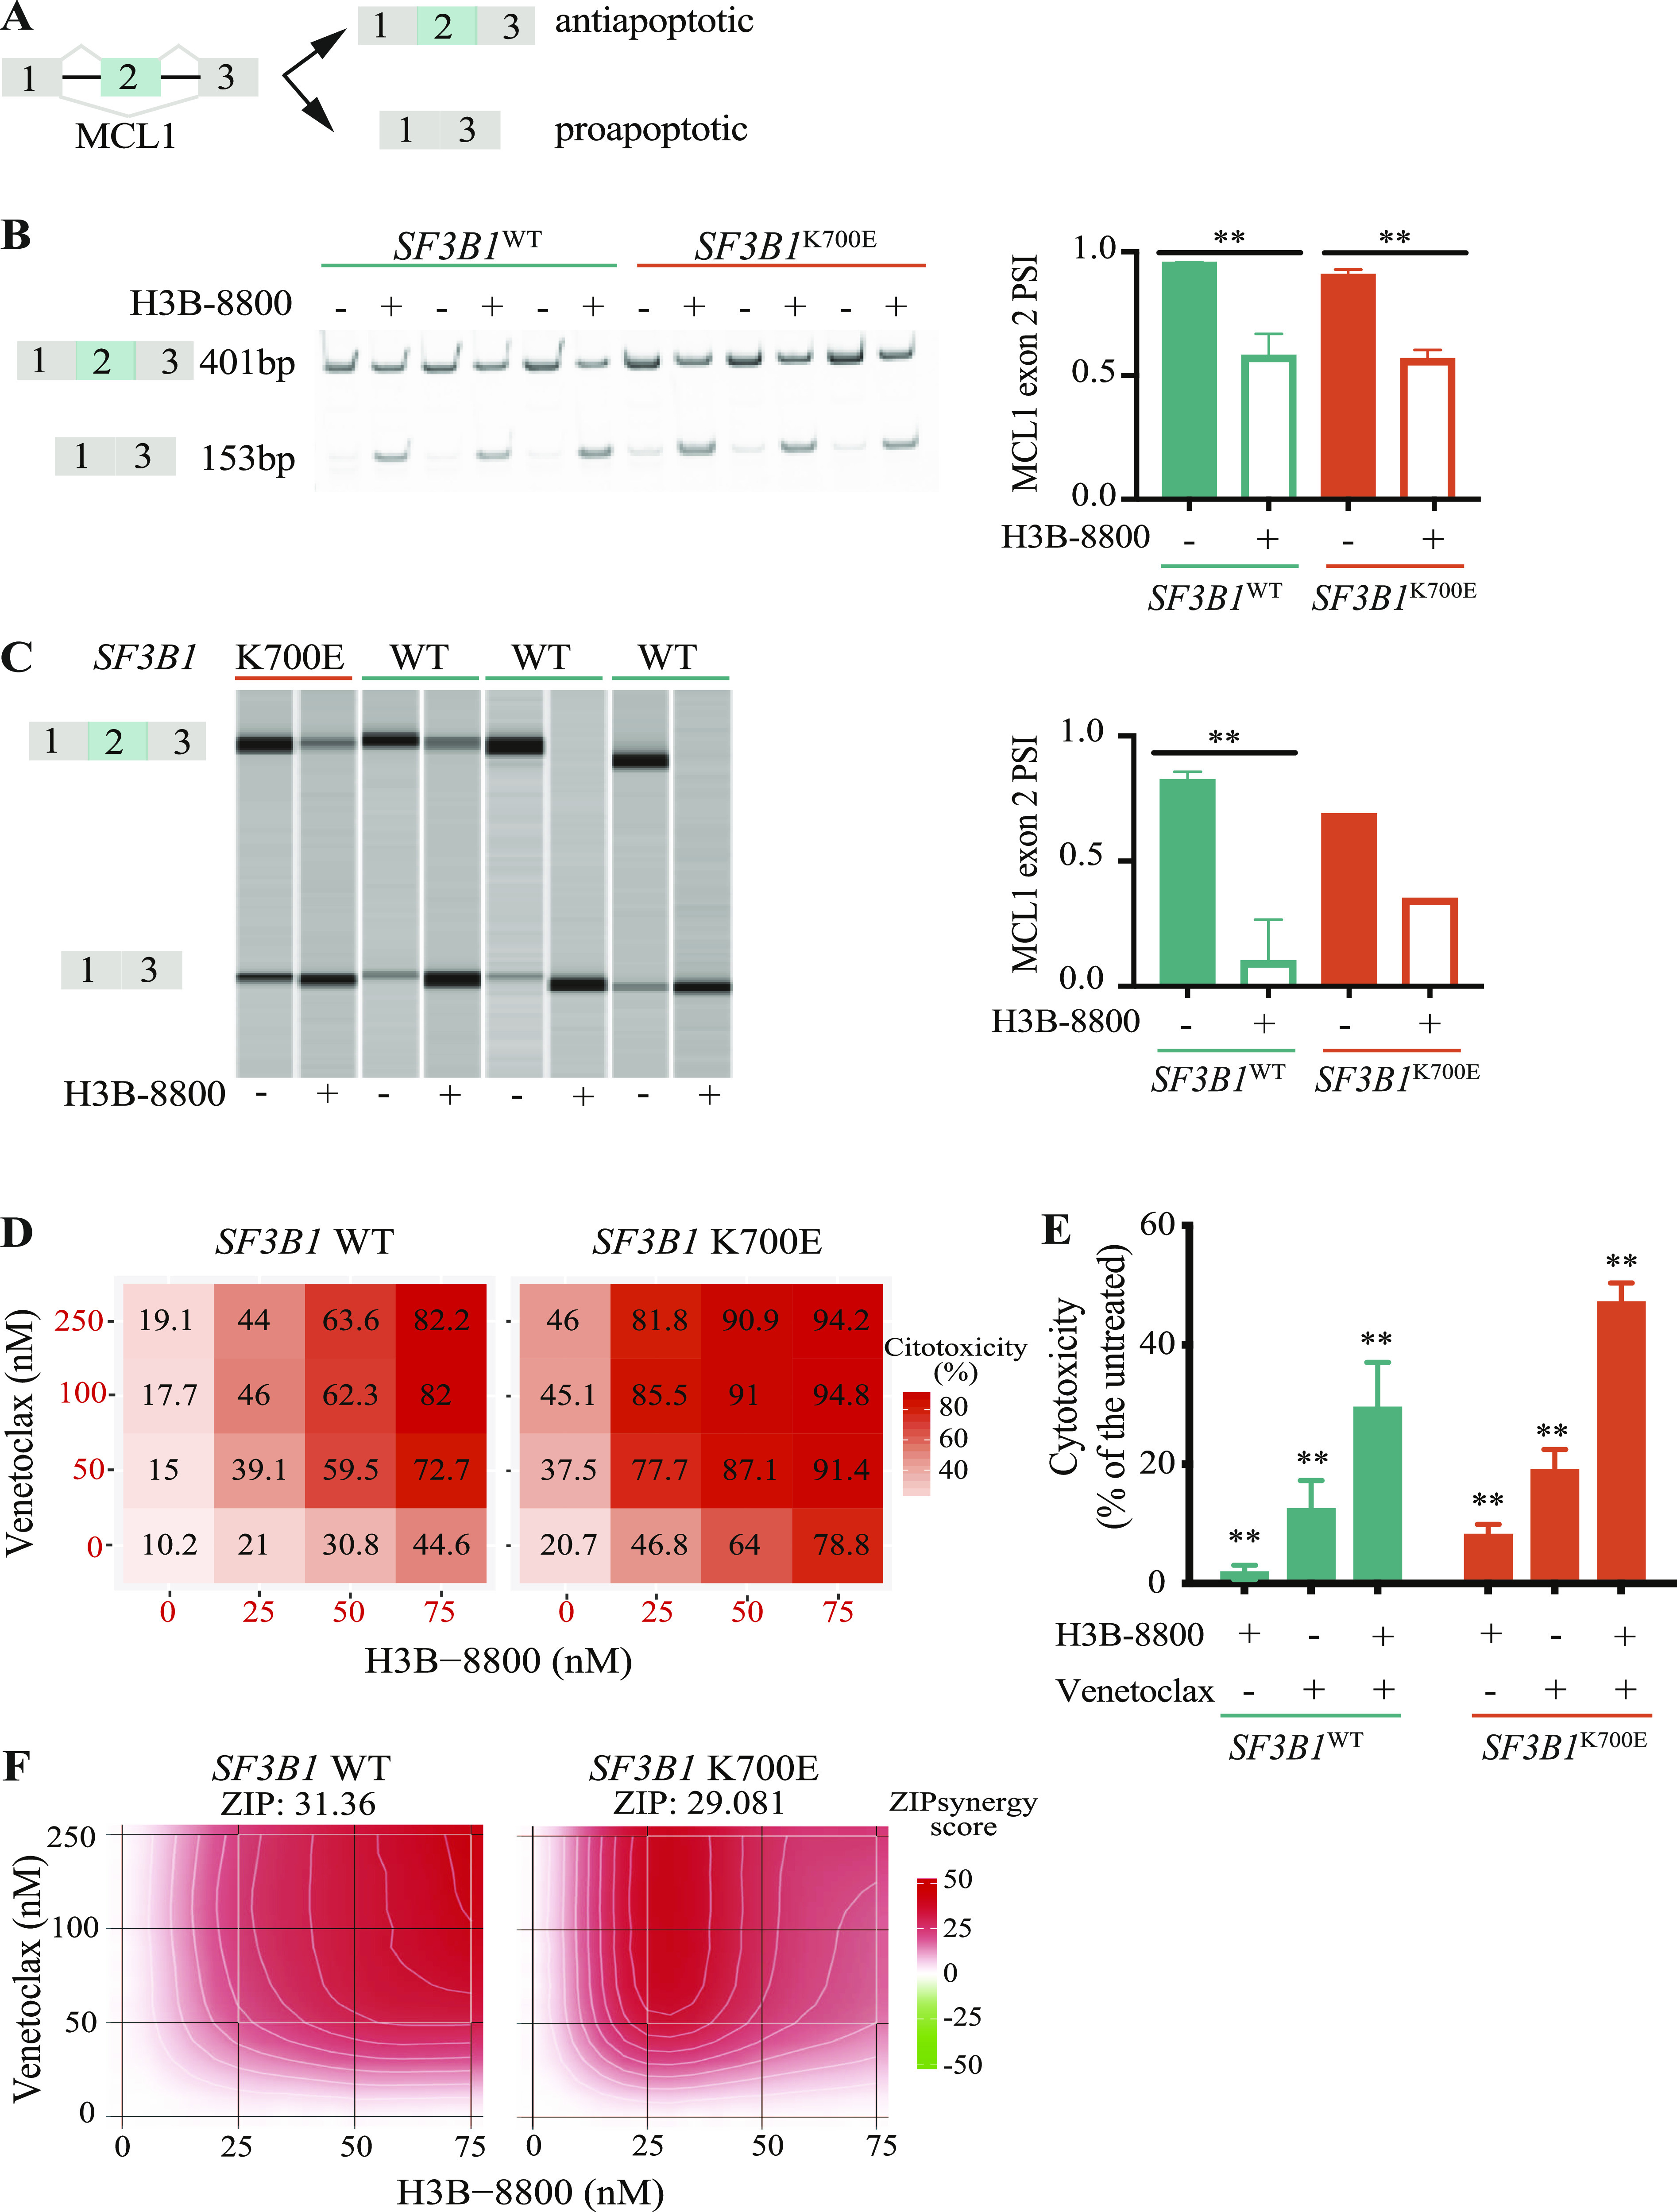
Splicing factor 3B subunit 1 (SF3B1) is involved in pre-mRNA branch site recognition and is the target of antitumor-splicing inhibitors. Mutations in SF3B1 are observed in 15% of patients with chronic lymphocytic leukemia (CLL) and are associated with poor prognosis, but their pathogenic mechanisms remain poorly understood. Using deep RNA-sequencing data from 298 CLL tumor samples and isogenic SF3B1 WT and K700E-mutated CLL cell lines, we characterize targets and pre-mRNA sequence features associated with the selection of cryptic 3' splice sites upon SF3B1 mutation, including an event in the MAP3K7 gene relevant for activation of NF-κB signaling. Using the H3B-8800 splicing modulator, we show, for the first time in CLL, cytotoxic effects in vitro in primary CLL samples and in SF3B1-mutated isogenic CLL cell lines, accompanied by major splicing changes and delayed leukemic infiltration in a CLL xenotransplant mouse model. H3B-8800 displayed preferential lethality towards SF3B1-mutated cells and synergism with the BCL2 inhibitor venetoclax, supporting the potential use of SF3B1 inhibitors as a novel therapeutic strategy in CLL.


Conflict of interest statement

D Colomer reports grants and personal fees from H3 Biomedicine, Novartis, Incyte, AstraZeneca, and AbbVie.

Figures

Figure 1.
Figure 1.. Establishment and characterization of SF3B1WT and SF3B1K700E MEC1 chronic lymphocytic leukemia isogenic cell lines.
(A) Representation of the CRISPR–Cas9 splicing factor 3B subunit 1 (SF3B1) K700E knock-in strategy, indicating the position of codon 700, PAM sequence, and Taqα1 recognition site, location of sgRNA, and donor single-stranded oligodeoxynucleotides with nucleotide changes to induce the K700E mutation and PAM sequence editing. (B) Expected size of PCR products corresponding to homology-directed repair clones after digestion with Taqα1 restriction enzyme, depending on absence (−) or presence (+) of edited sites. (C) DNA sequence of CRISPR/Cas9-modified MEC1 clones. The nucleotides corresponding to SF3B1 codon 700 and Cas9-targeted PAM sequence are shown. WT1 refers to parental MEC1 cell line, WT2 to a WT clone which underwent clonal selection after failed CRISPR/Cas9 edition, WT3 to a SF3B1K700K clone with the silent mutation in PAM, and MUT1-3 to the three SF3B1K700E clones. (D) Quantification by digital PCR of MEC1 SF3B1WT and SF3B1K700E clones. Variant allele frequency is the fraction abundance between droplets matching the specific K700E variant divided by the overall number of droplets analyzed. (E) SF3B1 protein expression in SF3B1WT and SF3B1K700E MEC1 cell lines. The quantification was calculated by normalizing the SF3B1/β actin ratio to sample WT1. (F) Viability of SF3B1WT and SF3B1K700E MEC1 cell lines (n = 17 replicates for each group) after 48 h in culture at 30,000 cell/100 μl concentration, assessed by flow cytometry (Annexin V-, PI-). (G) Metabolic activity of SF3B1WT and SF3B1K700E MEC1 cell lines (n = 12 replicates for each group) after 48 h in culture at 30,000 cell/100 μl concentration assessed by MTT assay. (F, G) Data information: in (F, G) data are represented as mean ± SD. Mann–Whitney test (****P < 0.0001). Source data are available for this figure.
Figure 2.
Figure 2.. Principal component analysis (PCA) of AS events found in IGCG chronic lymphocytic leukemia (CLL) RNA-seq data.
(A, B) PCA calculated for the AS events (>10 reads coverage supporting the percent spliced in calculation) found in PBMCs from 298 CLL cases and four healthy donors (herein referred to as normal B cells). Samples from our institution were labeled in yellow, and in grey the samples sent to us for processing from other institutions of the Spanish International Cancer Genome Consortium. (B, D, E, F) PCA calculated for Alt3’ss (B), Alt5’ss events (D), IR events (E), and ES events (F) found in CLL cases. PCA was calculated on the percent spliced in values of Alt3’ss, Alt5’ss, IR, and ES events of each sample using ggfortify and ggplot2 packages in R (v3.6.3). The mutational status and cancer cell fraction (CCF) (very low, CCF < 12%; low, CCF 12–50%; high, CCF > 50%) is indicated by color code as defined in each panel. (C) Location of splicing factor 3B subunit 1 (SF3B1) residues that induce (K700) or not (M757, E862) alterations in patterns of 3’ss usage upon mutation in the 3D structures of SF3B1 (in grey) and PHF5A (SF3B7) (in light blue). Highlighted in dark blue are residues that do not lead to altered 3’ss usage upon mutation (M575T, E862K) and in red K700, a mutation hotspot (frequently K700E) which induces characteristic patterns of 3’ss usage. mRNA and U2snRNA are represented in orange (base pairing corresponds to annealing between U2 snRNA BP recognition sequence and BP nucleotides flanking the BP adenosine, which bulges out from the helix) and the binding site of drugs such as SSA, pladienolide B, or H3B-8800 is marked by the circle with dotted line. The structural representation was prepared using the PyMOL Molecular Graphics System, Version 1.3r1 (Schrodinger, LLC) based on PDB 6FF4 structure from the Protein Data Bank.
Figure S1.
Figure S1.. Different splicing factor 3B subunit 1 (SF3B1) mutations’ exploratory analysis.
(A) Principal component analysis calculated for the AS profile (>100 reads coverage supporting the percent spliced in calculation) found in PBMCs from 15 chronic lymphocytic leukemia (CLL) cases with SF3B1 mutation. (B) Hierarchical clustering based on the most 1,000 differentially spliced AS events found among the 15 CLL cases with SF3B1 mutation. The data are centered by subtracting the average percent spliced in for each event. (C, D) Principal component analysis calculated for the gene expression profile and (D) hierarchical clustering based on the most 1,000 differentially expressed genes found among the 15 CLL cases with SF3B1 mutation. Heatmap values correspond to started log transformation of read counts, and the data are centered by subtracting the average expression level for each gene. (E) Differentially expressed genes (Fold change > 2, FDR cutoff 0.1) between SF3B1 K700E and SF3B1 H662D samples using DESeq2. Data information: (Ig) heavy-chain variable (IGHV): variable region of the immunoglobulin heavy-chain locus; M-CLL: mutated IGHV; U-CLL: unmutated IGHV.
Figure 3.
Figure 3.. Differentially alternatively spliced events found in chronic lymphocytic leukemia (CLL) samples and SF3B1WT and SF3B1K700E MEC1 CLL isogenic cell lines.
(A) Number of differentially spliced (|ΔPSI| ≥ 15) AS event types associated with SF3B1 mutations in primary CLL cases and SF3B1K700E MEC1 cell lines compared with all assessed AS events using vast-tools. The pie charts at the bottom represent the fraction of the AS events found in cell lines or CLL samples which are also observed in the other dataset. Test of equal proportion (****P-value < 0.0001; ns, not significant). (B) Correlation between AS events ΔPSI values comparing SF3B1 mutant versus WT samples found in MEC1 isogenic cell lines and in CLL samples, with a |ΔPSI| ≥ 15 at least in one of the datasets. Pearson correlation coefficients were estimated for each AS type as indicated. (C) Effects on the mRNA of differentially spliced (|ΔPSI| ≥ 15) transcripts found in CLL or MEC1 cell lines using vast-tools. The pie charts represent the fraction of events corresponding to each of the categories of predicted impact on ORF, located in UTR or unknown. (D) Comparison of gene expression changes associated with the events predicted to preserve or disrupt ORFs in CLL patient samples or MEC1 cell lines. The statistical significance between both groups was evaluated using a Mann–Whitney test (****P-value < 0.0001). (E) SF3B1 mutation induces AS changes in genes involved in diverse biological processes. Enriched Gene Ontology terms (enrichGO R package) for biological processes in genes displaying differentially spliced events in SF3B1-mutated CLL patient samples and SF3B1K700E MEC1 cell lines. GO terms are indicated along with the statistical significance (P-value, red circles, ns, not significant) and gene ratio that indicates the ratio of genes with an AS event from all the tested genes (black circles). Data information: IR, intron retention; ES, exon skipping; Alt3’ss and Alt5’ss, alternative 3’ss and alternative 5’ss.
Figure S2.
Figure S2.. Relative frequency of the number of Alt3’ss in addition to de canonical 3’ss in the presence of splicing factor 3B subunit 1 (SF3B1) mutations in MEC1 cell lines and chronic lymphocytic leukemia patient samples.
Only AG type 3’ss using a unique GT type 5’ss detected with JuncExplorer were considered. Alt3’ss found in SF3B1K700E MEC1 cell lines are shown in orange, Alt3’ss found in SF3B1-mutated chronic lymphocytic leukemia samples are shown in green.
Figure 4.
Figure 4.. Location, features, and mechanisms of regulation of cryptic and Alt3’ss activated by splicing factor 3B subunit 1 (SF3B1) mutations.
(A) Empirical density of distances (in nucleotides) between cryptic or Alt3’ss and their canonical 3’ss found in SF3B1-mutated MEC1 cell lines (continuous lines) and SF3B1-mutated chronic lymphocytic leukemia patient samples (dashed lines). A negative distance indicates that the cryptic 3’ss or Alt3’ss is located upstream of the canonical 3’ss counterparts. Distribution of distances is shown for cryptic and for Alt3’ss with |ΔPSI| > 15% and range of 5%, and non-changing Alt3’ss with |ΔPSI| < 1%, as indicated. (B) Schematic representation of subtypes of cryptic and Alt3’ss patterns relative to the canonical 3’ss (upstream near, UpN: ≤ 50 nucleotides upstream; upstream far, UpF: > 50 nucleotides upstream; downstream near, DoN: ≤ 50 nucleotides downstream; downstream far, DoF: > 50 nucleotides downstream) and their relative frequencies in SF3B1-mutated chronic lymphocytic leukemia samples and SF3B1K700E MEC1 cell lines. (C) Comparison between the normalized means of a variety of intronic features calculated using Matt software (Gohr & Irimia, 2019) for each type of cryptic or Alt3’ss. The mean of the features of the predicted BP, cryptic, and Alt3’ss compared with those of canonical 3’ss and predicted associated BP: BP strength (BP score for the best predicted BP), Num BPs (number of predicted BPs), Dist BP to 3’ss (distance from the best predicted BP to the 3’ss), PolyY strength (polypyrimidine tract score for the best-predicted BP), 3’ss strength (maximum entropy score of 3’ss using a model trained with human splice sites) (Yeo & Burge, 2004; Gohr & Irimia, 2019). Orange rectangles in the heatmap indicate that cryptic/Alt3’ss display lower values compared with canonical 3’ss for each of the features compared. The schematic representation below the heatmap indicates the position of the features examined within the architecture of 3’ss regions. (D) Schematic representation of the adenovirus major late transcript where different Alt3’ss were introduced to replace its natural 3’ss region. The insert in green includes the regions with alternative 3’ss AGs, from 20 nucleotides upstream of the 5’ branch point adenosine (A) to five nucleotides downstream of the 3’ AG. PT1 and PT2 correspond to sequences used for detection of the non-spliced and spliced products by RT–PCR. (E, F, G) Schematic representation of WT and mutant Alt3’ss regions corresponding to ZNF561 (E), MAP3K7 (F), or TARBP1 (G) included in the minigene constructs with the predicted branch site adenosines and 3’ss. Single-point mutations in BP1 or in BP2 are indicated with an “X.” (E, F) Lower left panel: results of RT–PCR analysis of RNAs from SF3B1WT or SF3B1K700E MEC1 cell lines transfected with the indicated ZNF561 (E) or MAP3K7 (F) minigenes, analyzed by polyacrylamide gel electrophoresis. Lower-right panel: quantification of the ratio between the Alt3’ss and canonical 3’ss usage of the amplification products shown in the left panel. The product corresponding to intron retention migrates at 264/287 nucleotides, whereas products corresponding to the usage of alternative 3’ss are annotated in blue (canonical 3’ss) and red (alternative 3’ss) with their respective sizes in the left panels. (G) Lower-left panel: fragment analysis of RT–PCR products from RNAs of SF3B1WT or SF3B1K700E MEC1 cell lines transfected with the indicated TARBP1 minigenes. Lower-right panel: ratio between the Alt3’ss and canonical 3’ss percent spliced in quantification area under the curve of the peaks (e.g., Alt3’ss percent spliced in: aberrant peak/[aberrant peak + canonical peak]) shown in the left panel. The product corresponding to intron retention migrates at 246 nucleotides, whereas products corresponding to the usage of alternative 3’ss are annotated in blue (canonical 3’ss) and red (alternative 3’ss). Data information: green bars: SF3B1WT cells. Orange bars: SF3B1K700E cells. ZNF561 minigene replicates: WT = 3, BP1 = 3, BP2 = 3. MAP3K7 minigene replicates: WT = 9, BP1 = 6, BP2 = 6, BP1, 2, 3, 4 = 3. TARBP1 minigene replicates: WT = 9, BP1 = 6, BP2 = 6. Kruskal–Wallis test (**P < 0.01, ****P < 0.0001). Source data are available for this figure.
Figure S3.
Figure S3.. Validation of Alt3’ss patterns associated with SF3B1K700E in MEC1 cell lines.
(A) RT–PCR validation of selected AS events belonging to the “upstream near,” “upstream far,” “downstream near,” and “downstream far” 3’ss categories. Amplification products using oligonucleotides in exons surrounding the pair of 3’ss analyzed were resolved by electrophoresis in native polyacrylamide gels. Results are shown for SF3B1WT and SF3B1K700E MEC1 cell lines, as indicated. Alt3’ss correspond to amplification products present only in K700E samples and that match the expected sizes. The barplots next to the images represent the percent spliced in values of the newly detected (Alt) isoforms, quantified using ImageJ. (B) Peaks of the Alt (184 nt) and canonical (187 nt) isoforms of TARBP1 gene NAGNAG pattern obtained by fragment analysis of the RT–PCR amplification products using an ABI 3130 Genetic Analyzer (Applied Biosystems) and GeneMapper software 6.0. Percent spliced in quantification of the area under the curve of the peaks (Alt3’ss peak/[Alt3’ss peak + canonical 3’ss peak]) is shown in the lower panel. Data information: in (A, B), unpaired t test was used (**P-value < 0.01, ***P-value < 0.001, ****P-value < 0.0001). Source data are available for this figure.
Figure S4.
Figure S4.. Characteristics of cryptic and Alt3’ss activated by splicing factor 3B subunit 1 (SF3B1) mutations.
(A) Comparison between the 3’ss strength (maximum entropy score of 3’ss using a model trained with human splice sites) of Alt3’ss and cryptic 3’ss depending on the distances to the canonical 3’ss (UpN, UpF, DoN, DoF). (B) Comparison between 3’ss strength (maximum entropy score of 3’ss using a model trained with human splice sites) of canonical 3’ss which have their Alt3’ss located at different distances (UpN, UpF, DoN, DoF). Data information: Mann–Whitney U test: *P < 0.05, **P < 0.01, ***P < 0.001, ****P < 0.0001. UpF, Upstream Far; UpN, Upstream Near; DoN, Downstream Near; DoF, Downstream Far.
Figure S5.
Figure S5.. MAP3K7 and TARBP1 minigenes’ additional analysis.
(A) Results of RT–PCR analysis of RNAs from SF3B1WT or SF3B1K700E MEC1 cell lines transfected with the indicated MAP3K7 minigenes, analyzed by polyacrylamide gel electrophoresis. The product corresponding to intron retention migrates at 287 nucleotides, whereas products corresponding to the usage of alternative 3’ss are annotated in blue (canonical 3’ss) and red (alternative 3’ss) with their respective sizes and unspecific bands with an asterisk. (B, C) Quantification of the ratio between the Alt3’ss and canonical 3’ss usage (B) and the ratio between the canonical 3’ss and retained intron (C) of the amplification products shown in panel (A). (D) The ratio between the canonical 3’ss and retained intron percent spliced in quantification (area under the curve of the peaks shown in Fig 4C). Data information: MAP3K7 minigene replicates: WT = 9, BP1 = 6, BP2 = 6, BP3 = 6, BP4 = 6, BP1, 2, 3, 4 = 3, BP1, 5 = 3, BP1, 2, 3, 4, 5 = 3. TARBP1 minigene replicates: WT = 9, BP1 = 6, BP2 = 6. Green bars: SF3B1WT cells. Orange bars: SF3B1K700E cells. Kruskal–Wallis test (*P < 0.05; ****P < 0.0001). Source data are available for this figure.
Figure S6.
Figure S6.. Activation of cryptic 3’ss in the gene ZDHHC16 is a surrogate marker of functional AS activity induced by splicing factor 3B subunit 1 (SF3B1) mutation.
(A, B) Canonical (A) and cryptic (B) 3’ss usage in the ZDHHC16 gene measured by qRT–PCR in RNAs from samples with high SF3B1 mutation cancer cell fraction (CCF) (n = 29), low CCF (n = 11), very low CCF (n = 9), and SF3B1 WT samples (n = 39). The relative expression of each isoform was quantified by the comparative cycle threshold (Ct) method (ΔΔCt) using RPLPO as an endogenous control. mRNA expression levels are presented as arbitrary quantitative PCR units, normalized to the median of the WT samples. In the case of ZDHHC16 cryptic isoform, which was not detected in the WT samples, the median of the SF3B1-mutated samples was used in the normalization. Data information: statistical significance was assessed using a Mann–Whitney test (*P-value < 0.05, **P-value < 0.001, ****P-value < 0.0001).
Figure 5.
Figure 5.. Impact of SF3B1K700E on AS events of genes involved in the NF-κB pathway.
(A) Ratio between Alt3’ss and canonical MAP3K7 isoforms measured by RT–qPCR in patients’ samples and in SF3B1WT versus SF3B1K700E MEC1 chronic lymphocytic leukemia cell lines. High SF3B1 mutation corresponds to cancer cell fraction > 50%. Low SF3B1 mutation corresponds to cancer cell fraction < 50%. (B) Western blot analysis of MAP3K7 expression, using alpha tubulin as a loading control protein. Quantification was carried out using Multi Gauge software and normalized by calculating the MAP3K7/alpha tubulin ratio. (C) Enriched Gene Ontology terms (enrichGO R package) for genes displaying differentially spliced events or differences in gene expression in SF3B1K700E MEC1 cell lines. GO terms are indicated along with the statistical significance (P-value, red and blue circles) and gene counts (black circles). (D) Western blot quantification of phosphorylated p65 (pp65) levels relative to total p65 amounts in nuclear extracts of SF3B1WT and SF3B1K700E MEC1 chronic lymphocytic leukemia cell lines. (E) p65 DNA binding of the same samples as in (D) measured using an ELISA-based chemiluminescence kit. Data information: statistical significance was estimated using an unpaired t test (**P-value < 0.01; ***P-value < 0.001; ****P-value < 0.0001).
Figure 6.
Figure 6.. Effects of H3B-8800 in splicing factor 3B subunit 1 (SF3B1)-mutated chronic lymphocytic leukemia (CLL) primary samples and cell lines.
(A) Analysis of viability of CLL cell lines after 48 h treatment with the indicated concentrations of H3B-8800, measured by Annexin V and propidium iodide negativity by flow cytometry. SF3B1WT refers to WT1, WT2, WT3, and SF3B1K700 refers to MUT1, MUT2, MUT3. Replicates from four consecutive experiments are shown. The statistical significance of the comparison between the viability of SF3B1WT and SF3B1K700E cells was assessed using Mann–Whitney test (***P-value < 0.001, ****P-value < 0.0001). (B) Analysis of relative viability of primary CLL cells after 48 h treatment with 75 nM H3B-8800 measured by Annexin V and propidium iodide negativity by flow cytometry. SF3B1-mutated samples are divided into two groups according to their cancer cell fraction. The identity of the mutations is indicated by the color code. The crossbar represents the mean value. (C, D) Viability (C) and relative cytotoxicity (D) of primary CLL cells after treatment with 50 nM H3B-8800 for 48 h under co-culture conditions with HS-5 (bone marrow stromal cell line) cells. Green symbols correspond to SF3B1WT samples, orange symbols to SF3B1-mutated samples across different conditions specified in the x axis. Statistical significance assessment using Wilcoxon tests (*P-value < 0.05, **P-value < 0.01). (E, F) Viability of cell lines (E) and relative cytotoxicity (F) after treatment with 75 nM H3B-8800 for 48 h under co-culture conditions. Data information: HK: follicular dendritic cell line. HS-5: bone marrow stromal cell line. Green symbols correspond to SF3B1WT samples, orange symbols to SF3B1-mutated samples across different conditions specified in the x axis. Statistical significance assessment using Mann–Whitney test: **P-value < 0.01, ***P-value < 0.001, ****P-value < 0.0001, ns, non-significant.
Figure 7.
Figure 7.. Leukemic infiltration analysis of splicing factor 3B subunit 1 (SF3B1) WT and K700E chronic lymphocytic leukemia isogenic lines upon xenograft implantation in NSG mice and treatment with vehicle or H3B-8800 at 6 mg/kg.
(A) Luciferase activity of SF3B1WT and SF3B1K700E MEC1 chronic lymphocytic leukemia isogenic lines xenografts in mice treated with vehicle or H3B-8800 for the times indicated, captured using AEQUORIA fluorescence/luminescence imaging system. # replaces the mouse which died before the experimental end point. (A, B) Quantification of the results in panel (A). The color and line codes indicate the different experimental conditions and treatments. (C, D, E, F) Analysis of leukemic infiltration in the bone marrow (C, D) and peripheral blood (E, F), measured as the percentage of CD19+ cells in flow cytometry assays (C, E) for SF3B1WT and SF3B1K700E xenograft-implanted NSG mice, treated with vehicle or H3B-8800, as indicated, or relative to treatment with vehicle (D, F). SF3B1WT samples are indicated in green, SF3B1K700E samples in orange. (G, H) Normalized quantification of the liver (G) and spleen (H) weights from mice harboring SF3B1WT (green) or SF3B1K700E (orange) xenografts treated with vehicle or H3B-8800 as indicated. (I) Representative spleens from NSG mice implanted with SF3B1WT and SF3B1K700E MEC1 cell lines after H3B-8800 or vehicle administration, as indicated. (J) CD79a immunohistochemical staining of spleens from H3B-8800–treated versus vehicle-treated mice implanted with SF3B1WT and SF3B1K700E MEC1 cell lines as indicated. The scale bar indicates 75 nm. (B, C, D, E, F, G, H) Data information: statistical significance was assessed using mixed effect analysis (B) and Mann–Whitney test (C, D, E, F, G, H) (*P-value < 0.05, **P-value < 0.01; ***P-value < 0.001, ****P-value < 0.0001).
Figure 8.
Figure 8.. H3B-8800 induces intron retention and exon skipping events in H3B-8800–treated SF3B1WT and SF3B1K700E MEC1 cell lines.
(A) Relative frequency of differentially spliced (|ΔPSI| ≥15) AS event types in SF3B1WT and SF3B1K700E MEC1 cell lines upon H3B-8800 treatment compared with all assessed AS events using vast-tools for each comparison (WT versus WTH3B: SF3B1WT versus SF3B1WT treated with H3B-8800; KE versus KEH3B: SF3B1K700E versus SF3B1K700E treated with H3B-8800). Test of equal proportion (****P < 2.2 × 10⁻¹⁶). (B) Gene Ontology enrichment analysis of biological processes for all the AS differentially expressed (|ΔPSI| ≥ 15 and percent spliced in [PSI] range < 5 upon H3B-8800 treatment) in SF3B1WT and SF3B1K700E MEC1 cell lines after treatment with 75 nM H3B-8800 for 6 h calculated using enrichGO. GO terms are indicated on the left, and the enrichment properties (adjusted P-value and gene ratio, the ratio of the affected genes in each pathway) indicated by the heatmap color and size of the circles, respectively. GO terms shown have an adjusted P-value < 0.05 and a Q-value < 0.05. (C) Sequence feature analysis of exons skipped upon H3B-8800 treatment of SF3B1WT MEC1 cells using Matt (Gohr & Irimia, 2019). Significant features are indicated at the top of the figure and the degree and statistical significance level for the comparison with constitutive, alternative non-changing, and cryptic exons indicated by the heatmap and Mann–Whitney test (*P < 0.05, **P < 0.01, ***P < 0.001). 5’ss and 3’ss strength are calculated by the maximum entropy score of 3’ss using a model trained with human splice sites (Yeo & Burge, 2004). Exons skipped upon H3B-8800 treatment were defined as |ΔPSI| ≥ 15 and PSI range < 5 upon H3B-8800 treatment. Constitutive exons were defined as displaying PSI > 95 in both groups (n = 4,922); alternative non-changing exons as 10 < PSI < 90 in at least one group and |ΔPSI| ≤ 5 (n = 3,288) and cryptic exons as PSI < 5 in both groups (n = 4,976). (D) Sequence feature analysis of retained and more spliced introns upon H3B-8800 treatment of SF3B1WT MEC1 cells using Matt (Gohr & Irimia, 2019). 5’ss and 3’ss strength are calculated by the maximum entropy score of 3’ss using a model trained with human splice sites (Yeo & Burge, 2004). Retained introns were defined as |ΔPSI (control—treated)| ≥ 15 and PSI range < 5, spliced introns as ΔPSI ≤ 15 and PSI range < 5 and non-changing introns as −1 < ΔPSI < 1, 5 < PSI < 95 in SF3B1WT control group. Significant features are indicated at the top of the figure, and the degree and statistical significance level for the comparison of retained and more spliced introns with non-changing introns indicated by the heatmap and Mann–Whitney test (*P < 0.05, **P < 0.01, ***P < 0.001). (E) Distribution of GC content along the genomic exon/intron region (RNA map) for retained, more spliced, and non-changing introns using Matt (Gohr & Irimia, 2019). The upper plot shows the frequency of GC content motif; the middle plot shows the coverage of the region, and the lower scheme, the length (in nucleotides) of the regions of exons and introns considered for the analysis. (F) Effect of H3B-8800 on splicing changes induced by SF3B1K700E mutation. The similarity between SF3B1 mutation and H3B-8800 treatment induced ΔPSI direction is shown in color code. |ΔPSI| ≤ 10 was set as a cut of to define the events affected less by H3B-8800 treatment. Alt3’ss event in MAP3K7 (studied in Fig 3) is highlighted. Data information: KE: SF3B1K700E; KEH3B: SF3B1K700E treated with H3B-8800, and WT: SF3B1WT.
Figure S7.
Figure S7.. H3B-8800 induces largely overlapping intron retention and exon skipping events in H3B-8800–treated SF3B1WT and SF3B1K700E MEC1 cell lines, whereas more divergent effects for Alt5’ss and Alt3’ss events.
(A, B, C, D) Upset plots displaying the numbers and overlaps between alternative splicing events (intron retention (A), skipped exons (B), Alt5’ss (C), and Alt3’ss (D)) changing upon H3B-8800 treatment of SF3B1WT and SF3B1K700E MEC1 cell lines for events mapped under all conditions. Data information: WT versus WTH3B: SF3B1WT versus SF3B1WT treated with H3B-8800; KE versus KEH3B: SF3B1K700E versus SF3B1K700E treated with H3B-8800.
Figure S8.
Figure S8.. H3B-8800 induces overlapping AS changes in genes involved in apoptosis in H3B-8800–treated SF3B1WT and SF3B1K700E MEC1 cell lines.
AS events in apoptotic genes differentially spliced (|ΔPSI| ≥ 15) between SF3B1K700E cells with and without H3B-8800 treatment are indicated on the left. The heatmap shows the |ΔPSI| values for the indicated comparisons. The boxes with the cross are equivalent to NA values. Data information: WT versus KE: SF3B1WT versus SF3B1K700E cells not treated with the drug. WT versus WTH3B: SF3B1WT versus SF3B1WT treated with H3B-8800; KE versus KEH3B: SF3B1K700E versus SF3B1K700E treated with H3B-8800. WTH3B versus KEH3B: SF3B1WT versus SF3B1K700E cells treated with the drug. Alternative splicing events are annotated accordingly to VastDB/vast-tools nomenclature. INT, intron; EX, exon; ALTD, alternative donor or Alt5’ss; ALTA, alternative acceptor or Alt3’ss.
Figure 9.
Figure 9.. H3B-8800 modulates MCL1 AS and displays synergistic effects with venetoclax in MEC1 chronic lymphocytic leukemia (CLL) cell lines.
(A) Schematic representation of the AS event involving MCL1 exon 2. (B) Validation of MCL1 exon 2 skipping in SF3B1WT and SF3B1K700E isogenic MEC1 cell lines after 6 h treatment with 75 nM H3B-8800. RT–PCR amplification products corresponding to SF3B1WT and SF3B1K700E isogenic MEC1 cell lines treated with vehicle or H3B-8800, using primers complementary to exons 1 and 3, were analyzed by polyacrylamide gel. Right panel: quantification of exon 2 percent spliced in values under the different conditions (mean and SD). Statistical significance was assessed using unpaired t tests (**P-value < 0.01; ***P-value < 0.001). (C) Validation of MCL1 exon 2 skipping in four patient samples after 3 h of treatment with 75 nM H3B-8800, analyzed by RT–PCR as in (B) and capillary electrophoresis. Right panel: quantification of exon 2 percent spliced in values under the different conditions (mean and SD). Statistical significance was assessed using unpaired t tests (**P-value < 0.01; ***P-value < 0.001). (D) Dose-response cytotoxicity matrices for the indicated doses of H3B-8800 and venetoclax combination therapy at 48 h in SF3B1WT and SF3B1K700E MEC1 cell lines. Cytotoxicity was assessed by Annexin V and propidium iodide positivity by flow cytometry. (E) Cytotoxicity after incubation for 48 h with 100 nM venetoclax and/or 50 nM H3B-8800 in SF3B1WT and SF3B1K700E MEC1 cell lines. Cytotoxicity was assessed by Annexin V and propidium iodide positivity by flow cytometry. Statistical significance was assessed using Wilcoxon signed rank test (**P-value < 0.01). (D, F) Zero interaction potency synergy score representation based on the dose-response cytotoxicity matrices from panel (D) for the indicated H3B-8800 and venetoclax combination doses in SF3B1WT and SF3B1K700E MEC1 cell lines. Synergy scores were calculated using SynergyFinder (Ianevski et al, 2020).

Similar articles

Cited by

References

    1. Aird D, Teng T, Huang C, Pazolli E, Banka D, Cheung-Ong K, Eifert C, Furman C, Wu ZJ, Seiler M, et al. (2019) Sensitivity to splicing modulation of BCL2 family genes defines cancer therapeutic strategies for splicing modulators. Nat Commun 10: 137. 10.1038/s41467-018-08150-5 - DOI - PMC - PubMed
    1. Alsafadi S, Houy A, Battistella A, Popova T, Wassef M, Henry E, Tirode F, Constantinou A, Piperno-Neumann S, Roman-Roman S, et al. (2016) Cancer-associated SF3B1 mutations affect alternative splicing by promoting alternative branchpoint usage. Nat Commun 7: 10615. 10.1038/ncomms10615 - DOI - PMC - PubMed
    1. Amit M, Donyo M, Hollander D, Goren A, Kim E, Gelfman S, Lev-Maor G, Burstein D, Schwartz S, Postolsky B, et al. (2012) Differential GC content between exons and introns establishes distinct strategies of splice-site recognition. Cell Rep 1: 543–556. 10.1016/j.celrep.2012.03.013 - DOI - PubMed
    1. Arruga F, Gizdic B, Serra S, Vaisitti T, Ciardullo C, Coscia M, Laurenti L, D’Arena G, Jaksic O, Inghirami G, et al. (2014) Functional impact of NOTCH1 mutations in chronic lymphocytic leukemia. Leukemia 28: 1060–1070. 10.1038/leu.2013.319 - DOI - PubMed
    1. Arruga F, Vaisitti T, Deaglio S (2018) The NOTCH pathway and its mutations in mature B cell malignancies. Front Oncol 8: 550. 10.3389/fonc.2018.00550 - DOI - PMC - PubMed

Publication types

MeSH terms

LinkOut - more resources