. 2023 Aug 10;6(11):e202302087.
doi: 10.26508/lsa.202302087. Print 2023 Nov.

Parenchymal border macrophages regulate tau pathology and tau-mediated neurodegeneration

Affiliations

Parenchymal border macrophages regulate tau pathology and tau-mediated neurodegeneration

Antoine Drieu et al. Life Sci Alliance. .

Abstract

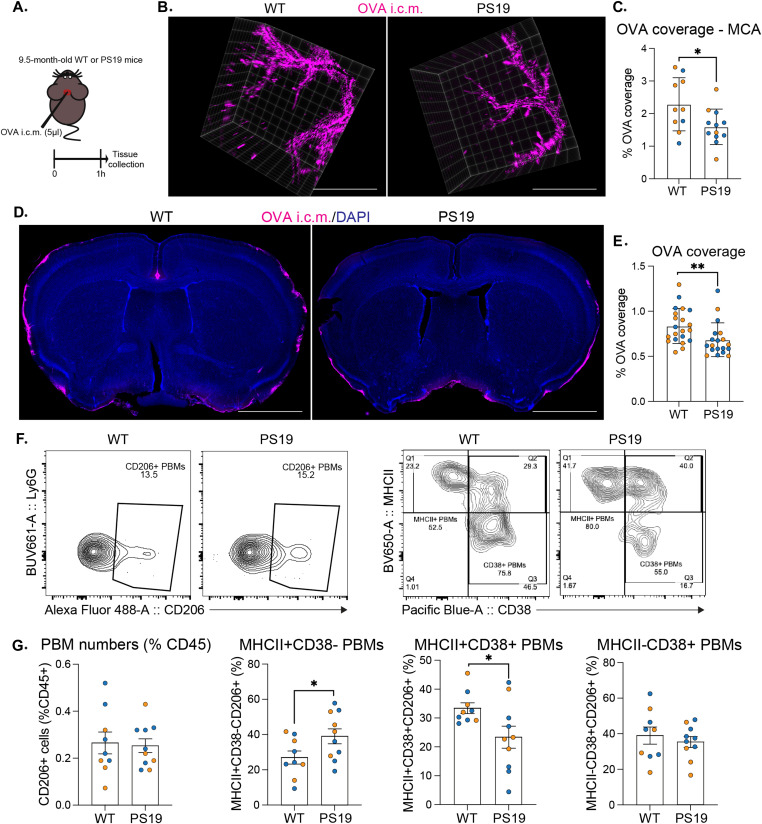
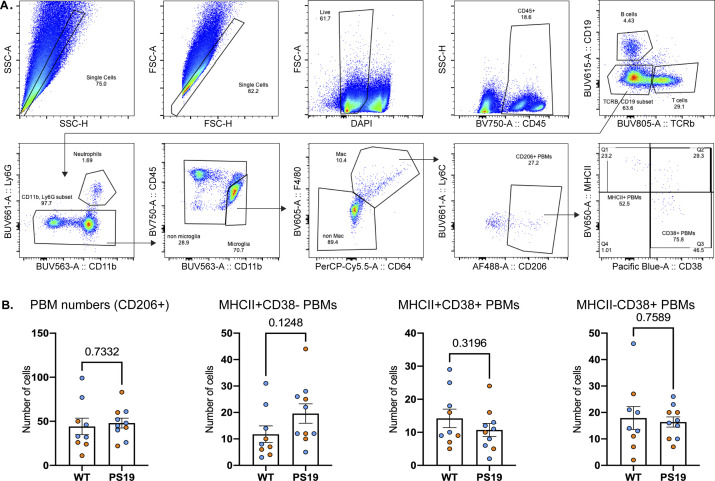
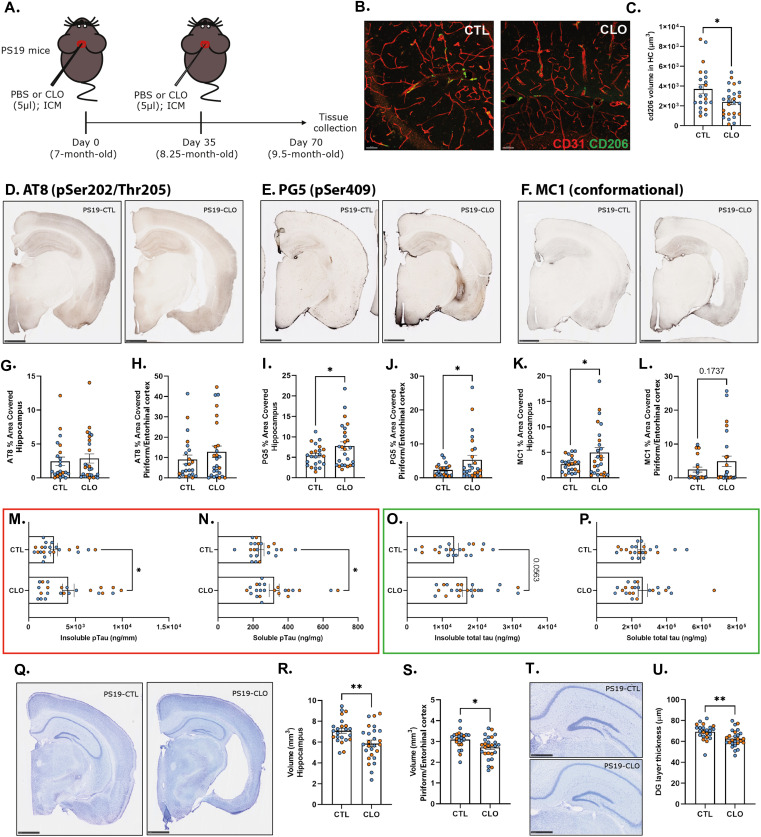
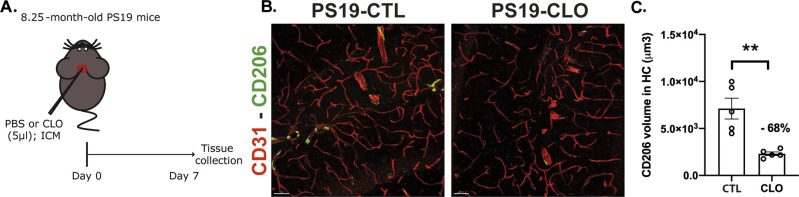
Parenchymal border macrophages (PBMs) reside close to the central nervous system parenchyma and regulate CSF flow dynamics. We recently demonstrated that PBMs provide a clearance pathway for amyloid-β peptide, which accumulates in the brain in Alzheimer's disease (AD). Given the emerging role for PBMs in AD, we explored how tau pathology affects the CSF flow and the PBM populations in the PS19 mouse model of tau pathology. We demonstrated a reduction of CSF flow, and an increase in an MHCII+PBM subpopulation in PS19 mice compared with WT littermates. Consequently, we asked whether PBM dysfunction could exacerbate tau pathology and tau-mediated neurodegeneration. Pharmacological depletion of PBMs in PS19 mice led to an increase in tau pathology and tau-dependent neurodegeneration, which was independent of gliosis or aquaporin-4 depolarization, essential for the CSF-ISF exchange. Together, our results identify PBMs as novel cellular regulators of tau pathology and tau-mediated neurodegeneration.


Conflict of interest statement

DM Holtzman is listed as an inventor on a provisional patent from Washington University on TREM2 antibodies. DM Holtzman is listed as inventor on a patent licensed by Washington University to C2N Diagnostics on the therapeutic use of anti-tau antibodies. DM Holtzman co-founded and is on the scientific advisory board of C2N Diagnostics. DM Holtzman is on the scientific advisory board of Denali, Genentech, and Cajal Neurosciences and consults for Asteroid Therapeutics.

Figures

Figure 1.
Figure 1.. CSF flow and PBMs in PS19 mice with tau pathology and neurodegeneration.
(A) Experimental schematic: 9.5-mo-old PS19 and WT mice received an i.c.m. injection of OVA; brains were then harvested and imaged 1 h after OVA injection. (B) Representative images showing OVA distribution at the middle cerebral artery (MCA) level. Scale bar, 2 mm. (C) Quantification of OVA coverage at the middle cerebral artery level (MCA). n = 10–12 mice/group. (D) Representative images showing OVA coverage on brain coronal sections and corresponding quantification of OVA coverage on full-brain coronal sections. Scale bar, 2 mm. (E) Quantification of OVA coverage on brain coronal sections. n = 14–26 mice/group; (F) Representative contour plots used for the identification of CD206+ cells, and MHCII/CD38 CD206+ subpopulations from half brains of 9.5-mo-old PS19 and WT mice. (G) Quantification of CD206+ cells, and subtypes of CD38+MHCII+CD206+, CD38-MHCII+CD206+, and CD38+MHCII-CD206+ cells. n = 9–10 mice/group. Data are presented as mean ± SEM. Significance was determined using two-tailed Mann–Whitney test. *P < 0.05, **P < 0.01, ***P < 0.001 and ****P < 0.0001. Males and females are represented with blue dots and orange dots, respectively.
Figure S1.
Figure S1.. Gating strategy and absolute numbers from FACS.
(A) Gating strategy and representative contour plots used for the identification of immune cells using flow cytometry in half brain of 9.5-mo-old PS19 and WT littermate mice. PBMs were sorted as TCRb CD11b+ Ly6g CD45high F4/80+ CD64+ CD206+. PBM phenotypes were identified by the expression of MHCII and/or CD38. (B) Absolute numbers of CD206+ cells, and subtypes of CD38+MHCII+CD206+, CD38-MHCII+CD206+, and CD38+MHCII-CD206+ cells. n = 9–10 mice/group. Data are presented as mean ± SEM. Significance was determined using two-tailed Mann–Whitney test. *P < 0.05, **P < 0.01, ***P < 0.001, and ****P < 0.0001. Males and females are represented with blue dots and orange dots, respectively.
Figure 2.
Figure 2.. Pharmacological PBM depletion significantly increased tau pathology and tau-mediated neurodegeneration in PS19 mice.
(A) Experimental schematic: PS19 mice received an i.c.m. injection of clodronate liposomes for PBM depletion or PBS control at 7 and 8.25 mo of age; brains were then harvested at 9.5 mo of age. (B) Representative images showing brain sections stained with anti-CD206 (green) and anti-CD31 (red) in the hippocampus of PBM-depleted and control 9.5-mo-old PS19 mice. Scale bar: 50 μm. (C) Quantification of the volume of CD206 cells in close association with CD31+ vessels per image in the CA1 and CA3 regions of the hippocampus. (D, E, F) Representative images of p-tau staining ((D): AT8 and (E): PG5) and pathological conformation of tau ((F): MC1) from PBM-depleted and control 9.5-mo-old PS19 mice. Scale bars: 1 mm. (G, H, I, J, K, L) Quantification of the percentage area covered by p-tau and pathological tau staining in the hippocampus (G, I, K) and the piriform/entorhinal cortex (H, J, L). (M, N, O, P) Concentrations of insoluble (M) and soluble (N) p-tau (p.Ser202/p.Thr205 and p.Thr181) and insoluble (O) and soluble (P) total tau from the hippocampus using a human tau-specific (hTau-specific) sandwich ELISA. (Q) Representative images of Nissl staining from 9.5-mo-old PS19 mice. (R, S) Quantification of the average volume of the hippocampus (R) and piriform/entorhinal cortex (S). (T) Representative images of Nissl staining from the dentate gyrus layer of 9.5-mo-old PS19 mice. (U) Quantification of the granule cell layer of the dentate gyrus; n = 23–26 mice/group; data are presented as mean ± SEM. Significance was determined by an unpaired, two-tailed t test for (C, I, J, L, M, N, O, P, R, S, U). For (G), an unpaired, two-tailed Mann–Whitney test was used because of the nonparametric dataset. For (H, K), two-tailed t test with Welch’s correction was used because of significantly different variances. *P < 0.05, **P < 0.01, ***P < 0.001, and ****P < 0.0001. Males and females are represented with blue dots and orange dots, respectively.
Figure S2.
Figure S2.. Efficiency of PBM depletion in PS19 mice.
(A) Experimental schematic: PS19 mice received an i.c.m. injection of clodronate liposomes for PBM depletion or PBS control at 8.25 mo of age; brains were then harvested 1 wk later to confirm PBM depletion. (B) Representative images showing brain sections stained with anti-CD206 (green) and anti-CD31 (red) in the hippocampus of PBM-depleted and control 8.25-mo-old PS19 mice 1 wk post-clodronate liposomes or PBS injection. Scale bar: 50 μm. (C) Quantification of the volume of CD206 cells within CD31+ vessels per image in the CA1 and CA3 regions of the hippocampus.
Figure S3.
Figure S3.. Correlation analysis among CD206 cell volume, hippocampus volume, and p-tau coverage.
(A, B) Correlation between the average volume of the hippocampus and the area covered by pathological tau ((a): MC1 and (B): PG5) in hippocampus. (C, D) Correlation between the volume of CD206 cells in close association with CD31+ vessels percentage and the area covered by pathological tau ((C): MC1 and (D): PG5) in the hippocampus. (E) Correlation between the average volume of the hippocampus and the volume of CD206 cells in close association with CD31+ vessel percentage in the hippocampus; n = 23–26 mice/group. (A, B, C, D, E) Significance was determined by Pearson correlation calculations for (C), and by Spearman nonparametric correlation for (A, B, D, E) because of the nonparametric dataset. Males and females are represented with blue dots and orange dots, respectively.
Figure 3.
Figure 3.. Pharmacological PBM depletion does not affect gliosis in 9.5-mo-old PS19 mice.
(A) Representative images showing brain sections stained with anti-Iba1 (red), anti-Clec7a (green), anti-P2ry12 (red), and anti-GFAP (GFAP) in the hippocampus of PBM-depleted and control 9.5-mo-old PS19 mice. Scale bar: 50 μm. (B, C, D, E) Quantification of the volume of Iba1+ (B), Clec7a+ (C), P2ry12+ (D), and GFAP+ (E) cells per image in the CA1 and CA3 regions of the hippocampus n = 23–26 mice/group. (F) Heatmap analysis of bulk RNA in the hippocampus of PBM-depleted and control 9.5-mo-old PS19 mice generated by hierarchical gene clustering based on groups. n = 18–20 mice/group. Data are presented as mean ± SEM. For (B, C, D, E, F) significance was determined by an unpaired, two-tailed t test. *P < 0.05. Males and females are represented with blue dots and orange dots, respectively.
Figure 4.
Figure 4.. Pharmacological PBM depletion does not impact aquaporin-4 polarization in 9.5-mo-old PS19 mice.
(A) Representative images showing brain sections stained with anti-AQP4 (green) and anti-CD31 (red) in the hippocampus of PBM-depleted and control 9.5-mo-old PS19 mice and age-matched WT littermates. Scale bar: 50 μm. (B, C) Quantification of the total volume of AQP4 (B) and the volume of depolarized AQP4 (C) measured as AQP4 volume at least 2 μm away from CD31+ vessels per image in the CA1 and CA3 regions of the hippocampus. n = 23–26 mice/group (WT n = 4). Data are presented as mean ± SEM. Significance was determined using a one-way ANOVA followed by (A) Tukey’s post hoc test for (B) and Welch’s and Brown–Forsythe ANOVA tests were used for (C) because of significantly different variances. ***P < 0.001 and ****P < 0.0001. Males and females are represented with blue dots and orange dots, respectively.

Similar articles

Cited by

References

    1. Abe Y, Shimada M, Takeda Y, Enoki T, Omachi K, Abe S, Murakami M, Tanaka T, Goda W, Goto M, et al. (2020) Evaluation of patient positioning during digital tomosynthesis and reconstruction algorithms for ilizarov frames: A phantom study. Strategies Trauma Limb Reconstr 15: 1–6. 10.5005/jp-journals-10080-1446 - DOI - PMC - PubMed
    1. Castellani RJ, Rolston RK, Smith MA (2010) Alzheimer disease. Dis Mon 56: 484–546. 10.1016/j.disamonth.2010.06.001 - DOI - PMC - PubMed
    1. Ceyzériat K, Ben Haim L, Denizot A, Pommier D, Matos M, Guillemaud O, Palomares MA, Abjean L, Petit F, Gipchtein P, et al. (2018) Modulation of astrocyte reactivity improves functional deficits in mouse models of Alzheimer's disease. Acta Neuropathol Commun 6: 104. 10.1186/s40478-018-0606-1 - DOI - PMC - PubMed
    1. Chen X, Firulyova M, Manis M, Herz J, Smirnov I, Aladyeva E, Wang C, Bao X, Finn MB, Hu H, et al. (2023) Microglia-mediated T cell infiltration drives neurodegeneration in tauopathy. Nature 615: 668–677. 10.1038/S41586-023-05788-0 - DOI - PMC - PubMed
    1. Da Mesquita S, Herz J, Wall M, Dykstra T, Alves de Lima K, Norris GT, Dabhi N, Kennedy T, Baker W, Kipnis J (2021. a) Aging-associated deficit in CCR7 is linked to worsened glymphatic function, cognition, neuroinflammation, and β-amyloid pathology. Sci Adv 7: eabe4601. 10.1126/sciadv.abe4601 - DOI - PMC - PubMed

Publication types