. 2023 Aug 10;14(1):4726.
doi: 10.1038/s41467-023-39941-0.

Brain mitochondrial diversity and network organization predict anxiety-like behavior in male mice

Affiliations

Brain mitochondrial diversity and network organization predict anxiety-like behavior in male mice

Ayelet M Rosenberg et al. Nat Commun. .

Abstract

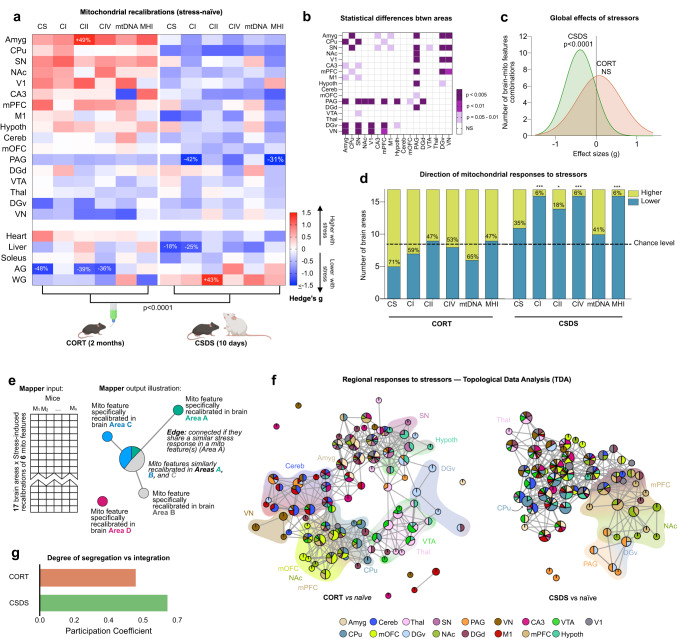
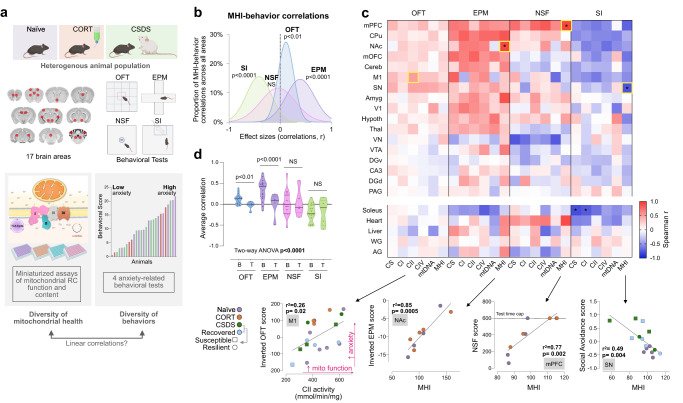
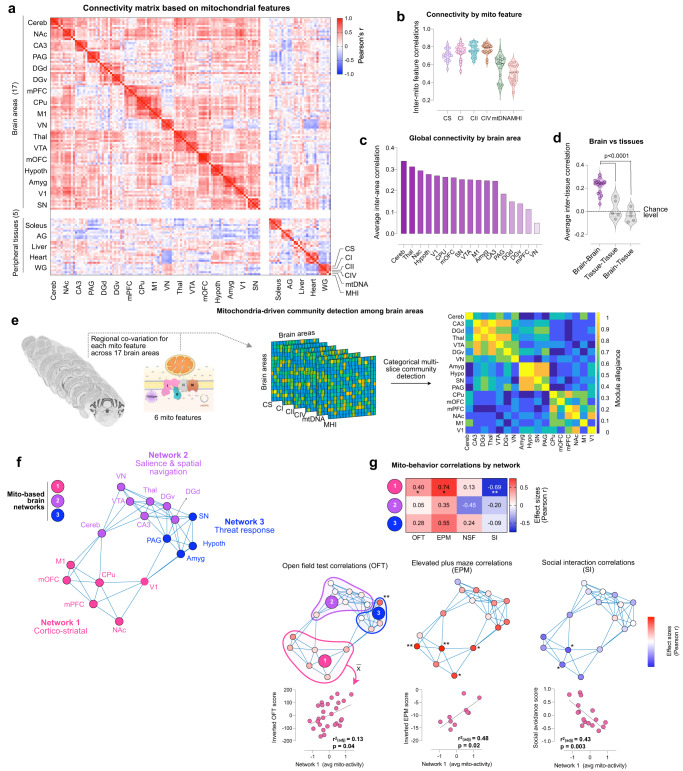
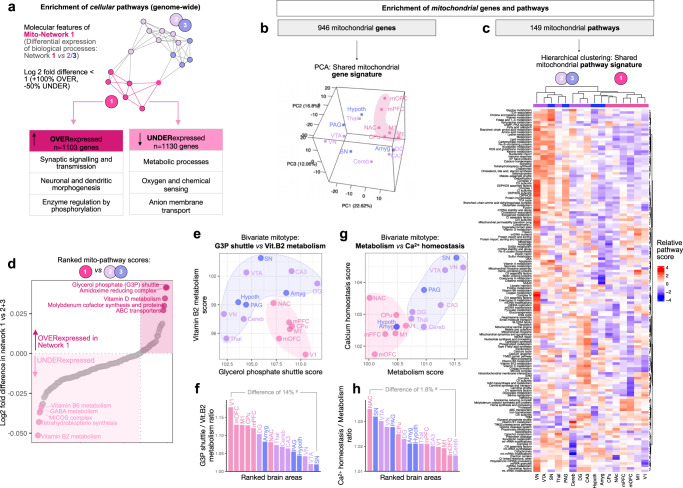
The brain and behavior are under energetic constraints, limited by mitochondrial energy transformation capacity. However, the mitochondria-behavior relationship has not been systematically studied at a brain-wide scale. Here we examined the association between multiple features of mitochondrial respiratory chain capacity and stress-related behaviors in male mice with diverse behavioral phenotypes. Miniaturized assays of mitochondrial respiratory chain enzyme activities and mitochondrial DNA (mtDNA) content were deployed on 571 samples across 17 brain areas, defining specific patterns of mito-behavior associations. By applying multi-slice network analysis to our brain-wide mitochondrial dataset, we identified three large-scale networks of brain areas with shared mitochondrial signatures. A major network composed of cortico-striatal areas exhibited the strongest mitochondria-behavior correlations, accounting for up to 50% of animal-to-animal behavioral differences, suggesting that this mito-based network is functionally significant. The mito-based brain networks also overlapped with regional gene expression and structural connectivity, and exhibited distinct molecular mitochondrial phenotype signatures. This work provides convergent multimodal evidence anchored in enzyme activities, gene expression, and animal behavior that distinct, behaviorally-relevant mitochondrial phenotypes exist across the male mouse brain.


Conflict of interest statement

The authors declare no competing interests related to this work. C.A. receives research funding from Sunovion Pharmaceuticals.

Figures

Fig. 1
Fig. 1. Behavioral and neuroendocrine stressors enhance the diversity of mitochondrial phenotypes across brain areas.
a Effect of CORT and CSDS on mitochondrial features across brain areas and peripheral tissues relative to naïve mice. Effect sizes are quantified as Hedge’s g, with significant effect sizes (95% confidence interval) labeled with the fold difference. Unadjusted p-value from two-way ANOVA, n = 27 mice, 5–6 per group. b Pair-wise comparisons between each brain areas’ responses to the stressors (Hedge’s g) from (A) as compared to each other area, colored by p-value (non-adjusted for multiple comparisons). c Gaussian fit for the frequency distribution of the effect sizes in A on all 6 mitochondrial features in all 17 brain areas (n = 102 pairs); one-sample t-test (two-tailed) against null hypothesis g = 0. d Number of brain areas in which mitochondrial features are either above or below the naïve group average in CORT and CSDS mice relative to naïve mice; p-values from binomial test (two-tailed); CI, CIV, MHI: p = 0.0003, CII: p = 0.013. e Exemplar representations of Mapper input and output. Nodes in the Mapper output represent regional mitochondrial features (rows from input matrix) that are highly similar across mice. Thus, the brain areas that undergo similar stress-induced recalibrations in specific mitochondrial features cluster together in single nodes (most similar) or interconnected nodes (moderately similar), whereas areas that undergo divergent recalibrations are not connected. The pie-chart-based annotation of graph nodes allowed us to examine the degree of co-regulation of mito-features across brain areas. f Topological data analysis (TDA)-based Mapper approach to determine if brain areas were co-regulated in their stress-induced mitochondrial recalibrations for the two groups. g Participation coefficient (PC) representing the uniformity of mitochondrial responses across all brain areas. CORT corticosterone, CSDS chronic social defeat stress. Source data are provided as a Source Data file.
Fig. 2
Fig. 2. Association patterns for brain-wide mitochondrial phenotypes and mouse behavior.
a Mitochondrial phenotyping and behavioral profiling of inter-individual variation in a heterogenous population of mice; OFT, open-field test; EPM, elevated plus maze; NSF, novelty suppressed feeding; SI, social interaction test. b Gaussian fits of the frequency distributions for all correlations (n = 102) between the composite mitochondrial health index (MHI) and each behavioral test; one-sample t-test (two-tailed) against null hypothesis r = 0 (other mitochondrial features are shown in Supplementary Fig. 8), SI: p < 0.0001, NSF: p = 0.49, OFT: p = 0.008, EPM: p < 0.0001. c Individual correlations for the 17 brain areas, across the 6 mitochondrial features, for each behavioral score, quantified as Spearman’s r. OFT and EPM behavioral scores were inverted so that higher scores on all four tests indicate higher anxiety (see Supplementary Fig. 8 for additional details). The strongest correlations for each behavioral test are denoted by yellow boxes, with the scatterplots shown below. An adjusted two-tailed p-value of <0.002 was applied (false-discovery rate 1%). All tests have been adjusted so that a higher score indicates higher anxiety-like behavior (see Methods for details). d Average correlation of each behavior for the brain (B) and tissue (T) mitochondrial features (n = 17 brain regions, n = 5 tissues); two-way ANOVA with Tukey’s multiple comparison adjustment, OFT: p = 0.0038, EPM: p < 0.0001. n = 10–27 mice per behavioral test. Source data are provided as a Source Data file.
Fig. 3
Fig. 3. Mitochondrial phenotype-based connectivity analysis across anatomical areas identifies large-scale brain networks that account for inter-individual variation in behaviors.
a Connectivity matrix of mitochondrial features across brain areas, using all 6 mitochondrial features across the animal cohort (n = 27 mice), quantified as Pearson’s r. The matrix is ordered by hierarchical clustering (Euclidian distance, Ward’s clustering). b Cross-correlation of each mitochondrial feature to the other 5 measures within each brain area (n = 17 brain areas). c Global connectivity based on the average correlation for each brain area with all other areas. d Average correlation of mitochondrial features between brain area’s, between peripheral tissues, and between brain areas and tissues; p < 0.0001, Ordinary one-way ANOVA with Tukey’s multiple comparisons. e Multi-slice community detection analysis on mitochondrial measures across the 17 brain areas (brain images acquired from the Allan Mouse Brain Atlas (Dong, H. W. The Allen reference atlas: A digital color brain atlas of the C57Bl/6 J male mouse. John Wiley & Sons Inc. (2008)), with mitochondrial features represented in six separate layers, resulting in f three distinct communities or brain networks. Modular structure confirmed by permutation test, p < 0.0001). g Average mito-behavior correlation by network for each behavioral test (top), with network 1 correlations p-values as follows: OFT: p = 0.039, EPM: p = 0.015, SI: p = 0.0033. The middle panel shows networks with each area color-coded by its average correlation with behaviors; for OFT (left), EPM (middle) and SI (right), *p < 0.05, **p < 0.01, two-tailed. The bottom panel shows scatterplots for network 1 correlations. The comparison of the modularity metrics with the modularity derived from whole-brain transcriptome and the structural connectome data, which show significant agreement, are shown in Supplementary Fig. 12. Source data are provided as a Source Data file.
Fig. 4
Fig. 4. Brain networks exhibit transcriptional genome-wide and mitochondrial specialization.
a The Allen Mouse Brain Atlas gene expression data was used to identify OVER-expressed and UNDER-expressed biological processes among Network 1 areas compared to Networks 2 + 3 areas combined. The number of genes whose Network 1 expression are more than double (Log2 fold difference > 1) or less than half (Log2 fold difference <) relative to Networks 2 + 3 is listed in the tables (right). The top three corresponding enriched categories of biological pathways for Network 1 are listed in the tables; enriched categories for Networks 2 and 3 are available in Supplementary Fig. 13, and the gene lists are available in Supplementary File 2. b Principal component analysis (PCA) representation of gene expression signatures based on mitochondrial localized genes alone (n = 946) and c the expression of 149 mitochondrial pathways by brain area (MitoCarta3.0), representing the relative expression of pathways relative to all brain areas. Analyses are performed on 16 areas because gene expression for dorsal and ventral DG is combined in the reference dataset. d Mitochondrial pathway scores ranked by their differential expression among networks 1 vs. 2 + 3. e, g Raw scores for selected divergent mitochondrial pathways illustrating the specialization of mitochondrial phenotypes (mitotypes) between brain areas, color coded by network. f, h Computed ratios of the two pathways analyzed in e and g, quantifying the magnitude of molecular specialization between brain areas in percentage of gene expression between the two juxtaposed ratios. Ratios are derived from scaled in situ RNA hybridization data so may not represent absolute differences in transcript abundance. Source data are provided as a Source Data file.

References

    1. Friston K. The free-energy principle: a unified brain theory? Nat. Rev. Neurosci. 2010;11:127–138. - PubMed
    1. Hall CN, Klein-Flugge MC, Howarth C, Attwell D. Oxidative phosphorylation, not glycolysis, powers presynaptic and postsynaptic mechanisms underlying brain information processing. J. Neurosci. 2012;32:8940–8951. - PMC - PubMed
    1. Courchet J, et al. Terminal axon branching is regulated by the LKB1-NUAK1 kinase pathway via presynaptic mitochondrial capture. Cell. 2013;153:1510–1525. - PMC - PubMed
    1. Gebara E, et al. Mitofusin-2 in the nucleus accumbens regulates anxiety and depression-like behaviors through mitochondrial and neuronal actions. Biol. Psychiatry. 2021;89:1033–1044. - PubMed
    1. Picard M, et al. Progressive increase in mtDNA 3243A>G heteroplasmy causes abrupt transcriptional reprogramming. Proc. Natl. Acad. Sci. USA. 2014;111:E4033–E4042. - PMC - PubMed

Publication types

Substances