. 2023 Aug 10;14(1):4828.
doi: 10.1038/s41467-023-40506-4.

Machine learning assisted quantum super-resolution microscopy

Affiliations

Machine learning assisted quantum super-resolution microscopy

Zhaxylyk A Kudyshev et al. Nat Commun. .

Erratum in

Abstract

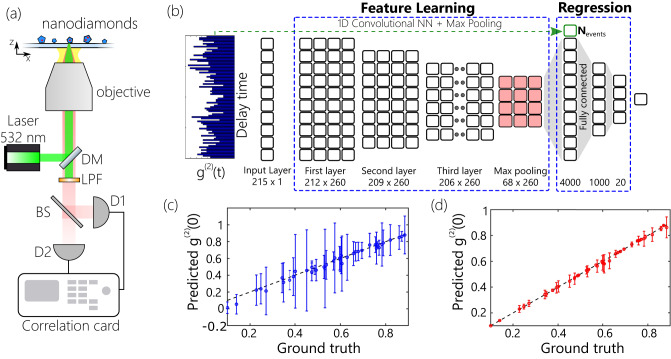
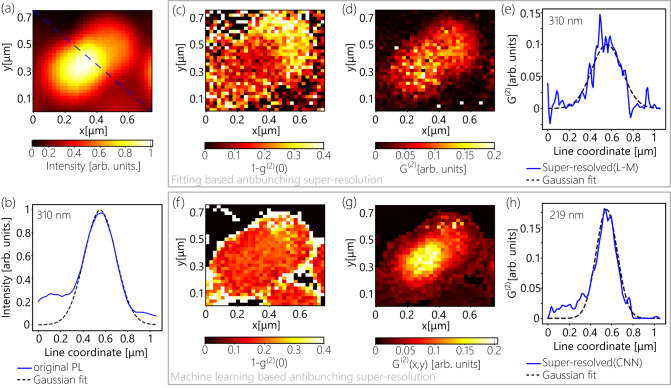
One of the main characteristics of optical imaging systems is spatial resolution, which is restricted by the diffraction limit to approximately half the wavelength of the incident light. Along with the recently developed classical super-resolution techniques, which aim at breaking the diffraction limit in classical systems, there is a class of quantum super-resolution techniques which leverage the non-classical nature of the optical signals radiated by quantum emitters, the so-called antibunching super-resolution microscopy. This approach can ensure a factor of [Formula: see text] improvement in the spatial resolution by measuring the n -th order autocorrelation function. The main bottleneck of the antibunching super-resolution microscopy is the time-consuming acquisition of multi-photon event histograms. We present a machine learning-assisted approach for the realization of rapid antibunching super-resolution imaging and demonstrate 12 times speed-up compared to conventional, fitting-based autocorrelation measurements. The developed framework paves the way to the practical realization of scalable quantum super-resolution imaging devices that can be compatible with various types of quantum emitters.


Conflict of interest statement

The authors declare no competing interests.

Figures

Fig. 1
Fig. 1. General framework of the machine learning (ML) assisted antibunching SRM.
Antibunching-based SRM image acquisition starts with an area of n by m pixels (a) and measures complete antibunching histograms via Hanbury-Brown-Twiss (HBT) interferometry at each pixel (b). The Levenberg-Marquardt (L-M) fit is done on each pixel’s HBT histogram to retrieve g2x,y,0 distribution. Finally, the super-resolved image is constructed using Eq. 2 (d). Alternatively, ML-assisted approach relies on pre-trained CNN regression model, which allows to accurately predict g2x,y,0 maps utilizing sparse HBT measurement data (c). The developed approach ensures at least 12 times speed-up compared with the conventional L-M fitting based antibunching SRM.
Fig. 2
Fig. 2. Machine learning assisted measurement of g(2)(0).
a Schematics of the HBT interferometer. Labels: DM dichroic mirror, LPF long-pass filter, BS beam splitter, D1/D2 detectors. b Schematics of the CNN regression network. The input layer takes in sparse HBT histograms. The total number of events, Nevents, of the histogram is concatenated to the output of the feature learning part and used as a regularization term. c, d Regression plot (predicted vs expected g20 values) for L-M fitting (c) and CNN regression of g20 (d) from 5s datasets. Dots show the average predicted g20 value, while error bars show the standard deviation of the predicted value over all the 5s datasets acquired for a given emitter.
Fig. 3
Fig. 3. Machine learning assisted antibunching SRM of a single NV center.
Photoluminescence (PL) distribution within the area of 32 by 32 pixels containing one NV center. b Cross section of the PL image (blue) along the dashed line in a and Gaussian fitting (dashed, black) with 310 nm FWHM. ce Results of L-M based antibunching SRM based on 7s HBT measurement: distribution of retrieved 1g2x,y,0 (c); reconstructed image (d) and cross-section of G2x,y distribution of the L-M fitting-based image (blue) and Gaussian fitting (dashed, black) with 310 nm FWHM (e). fh Results of ML assisted antibunching SRM: 1g2x,y,0 map (f); reconstructed image (d); and corresponding cross section of intensity distribution of reconstructed image (blue) and the Gaussian fitting (dashed, black) with 219 nm FWHM.
Fig. 4
Fig. 4. Robustness of the machine learning assisted SRM against the reduction of acquisition time.
ac Resolved images obtained via applying ML assisted antibunching SRM on 5s (a), 6s (b), and 7s (c) sparse HBT scans. The Blue, dashed line shows the cross-section line. d Comparison of intensity cross-sections for three cases.
Fig. 5
Fig. 5. Machine learning assisted antibunching SRM resolves two closely spaced emitters.
ac Results of ML assisted antibunching SRM done on 7s HBT measurement: PL image (a); distribution of retrieved 1g2x,y,0 (b) and the reconstructed image (c). d Cross-section of the intensity distribution of the PL image(blue) and Gaussian fitting (dashed, black). Blue dashed line in a shows the cross-section line. e Cross-section of the intensity distribution of the resolved image (blue) and Gaussian fitting (dashed, black).

References

    1. Rayleigh. XXXI. Investigations in optics, with special reference to the spectroscope. Lond. Edinb. Dublin Philos. Mag. J. Sci. 1879;8:261–274. doi: 10.1080/14786447908639684. - DOI
    1. Abbe E. Beiträge zur Theorie des Mikroskops und der mikroskopischen Wahrnehmung. Arch. f.ür. Mikroskopische Anat. 1873;9:413–468. doi: 10.1007/BF02956173. - DOI
    1. Huang B, Bates M, Zhuang X. Super-resolution fluorescence microscopy. Annu Rev. Biochem. 2009;78:993–1016. doi: 10.1146/annurev.biochem.77.061906.092014. - DOI - PMC - PubMed
    1. Hell SW. Far-field optical nanoscopy. Science. 2007;316:1153–1158. doi: 10.1126/science.1137395. - DOI - PubMed
    1. Rogers ETF, et al. Far-field unlabeled super-resolution imaging with superoscillatory illumination. APL Photonics. 2020;5:066107. doi: 10.1063/1.5144918. - DOI