. 2023 Aug 10;14(1):4823.
doi: 10.1038/s41467-023-40315-9.

Copy number architectures define treatment-mediated selection of lethal prostate cancer clones

Collaborators, Affiliations

Copy number architectures define treatment-mediated selection of lethal prostate cancer clones

A M Mahedi Hasan et al. Nat Commun. .

Abstract

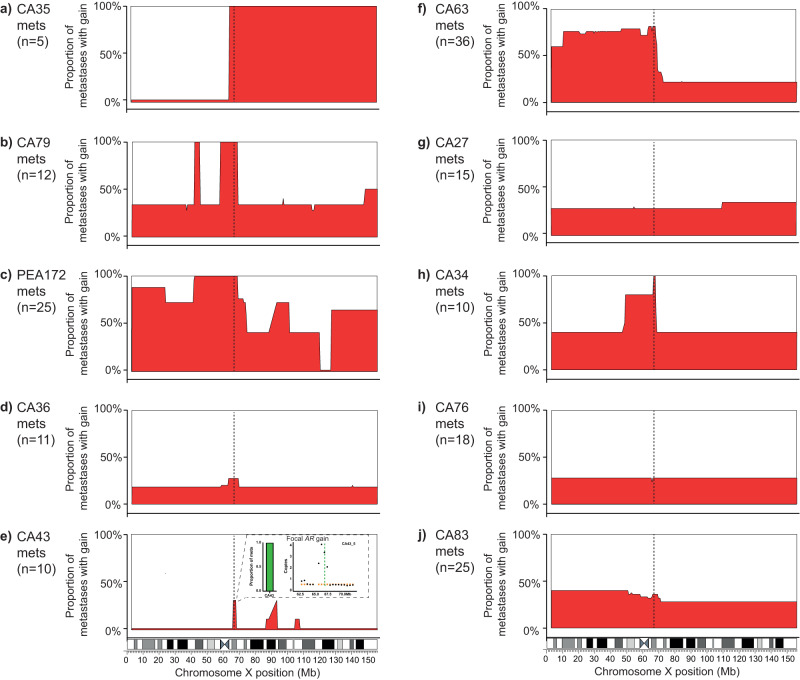
Despite initial responses to hormone treatment, metastatic prostate cancer invariably evolves to a lethal state. To characterize the intra-patient evolutionary relationships of metastases that evade treatment, we perform genome-wide copy number profiling and bespoke approaches targeting the androgen receptor (AR) on 167 metastatic regions from 11 organs harvested post-mortem from 10 men who died from prostate cancer. We identify diverse and patient-unique alterations clustering around the AR in metastases from every patient with evidence of independent acquisition of related genomic changes within an individual and, in some patients, the co-existence of AR-neutral clones. Using the genomic boundaries of pan-autosome copy number changes, we confirm a common clone of origin across metastases and diagnostic biopsies, and identified in individual patients, clusters of metastases occupied by dominant clones with diverged autosomal copy number alterations. These autosome-defined clusters are characterized by cluster-specific AR gene architectures, and in two index cases are topologically more congruent than by chance (p-values 3.07 × 10⁻⁸ and 6.4 × 10⁻⁴). Integration with anatomical sites suggests patterns of spread and points of genomic divergence. Here, we show that copy number boundaries identify treatment-selected clones with putatively distinct lethal trajectories.


Conflict of interest statement

M.J.-H. has received funding from CRUK, NIH National Cancer Institute, IASLC International Lung Cancer Foundation, Lung Cancer Research Foundation, Rosetrees Trust, UKI NETs and NIHR. M.J.-H. has consulted for, and is a member of, the Achilles Therapeutics Scientific Advisory Board and Steering Committee, has received speaker honoraria from Pfizer, Astex Pharmaceuticals, Oslo Cancer Cluster, Bristol Myers Squibb, and is co-inventor on a European patent application relating to methods to detect lung cancer (PCT/US2017/028013). C.S. acknowledges grants from AstraZeneca, Boehringer-Ingelheim, Bristol Myers Squibb, Pfizer, Roche-Ventana, Invitae (previously Archer Dx Inc—collaboration in minimal residual disease sequencing technologies), Ono Pharmaceutical, and Personalis. He is Chief Investigator for the AZ MeRmaiD 1 and 2 clinical trials and is the Steering Committee Chair. He is also Co-Chief Investigator of the NHS Galleri trial funded by GRAIL and a paid member of GRAIL’s Scientific Advisory Board. He receives consultant fees from Achilles Therapeutics (also SAB member), Bicycle Therapeutics (also a SAB member), Genentech, Medicxi, China Innovation Centre of Roche (CICoR) formerly Roche Innovation Centre—Shanghai, Metabomed (until July 2022), and the Sarah Cannon Research Institute C.S has received honoraria from Amgen, AstraZeneca, Bristol Myers Squibb, GlaxoSmithKline, Illumina, MSD, Novartis, Pfizer, and Roche-Ventana. C.S. has previously held stock options in Apogen Biotechnologies and GRAIL, and currently has stock options in Epic Bioscience, Bicycle Therapeutics, and has stock options and is co-founder of Achilles Therapeutics. C.S. also declares a patent application (PCT/US2017/028013) for methods to lung cancer; targeting neoantigens (PCT/EP2016/059401); identifying patent response to immune checkpoint blockade (PCT/EP2016/071471), determining HLA LOH (PCT/GB2018/052004); predicting survival rates of patients with cancer (PCT/GB2020/050221), identifying patients who respond to cancer treatment (PCT/GB2018/051912); methods for lung cancer detection (US20190106751A1). C.S. is an inventor on a European patent application (PCT/GB2017/053289) relating to assay technology to detect tumor recurrence. This patent has been licensed to a commercial entity and under their terms of employment C.S is due a revenue share of any revenue generated from such license(s). M.L. reports grants or contracts from BMS, Shionogi, and AstraZeneca; consulting fees from BioNTech, Bicycle Therapeutics, Janssen, Merck Sorano, Pfizer, and ADC Therapeutics; honoraria from AstraZeneca and Pfizer; and support for attending meetings or travel from MSD, Janssen, and Bayer. S.S. has served on advisory boards for Bristol Myer Squibb, Merck Sharp and Dohme, Astra Zeneca, Janssen and has received institutional grant funding from Merck Sharp and Dohme, Astra Zeneca, Amgen, and Advanced Accelerator Applications (AAA), a Novartis Company, Merck Serono and Roche/Genentech (outside the submitted work). P.C., D.W., and G.A. have a patent on blood methylation markers (GB1915469.9). G.A. received personal fees, grants, and travel support from Janssen and Astellas Pharma; personal fees or travel support from Pfizer, Novartis/AAA, Bayer Healthcare Pharmaceuticals, AstraZeneca, and Sanofi-Aventis; in addition, G.A.’s former employer, The Institute of Cancer Research, receives royalty income from abiraterone and G.A. receives a share of this income through the Institute’s Rewards to Discoverers Scheme. G.A. has received research funding (institutional) from Janssen, Astellas Pharma, and Novartis. All other authors declare no potential conflicts of interest.

Figures

Fig. 1
Fig. 1. Treatment regimen, anatomical positions and AR copy number status of metastases harvested post-mortem.
a Horizontal stacked bars denote the treatment regimen administered, color codes in the legend. Patients are arranged based on the time from diagnosis to death. Arrows denote the time of tissue biopsy (prostate, brain or liver) at initial diagnosis or as part of standard-of-care. Plasma was collected post-mortem from nine patients, denoted by blood collection tubes. b AR copy number state and approximate anatomical positions of tumors with tumor content ≥0.2. Numbers along a human body denote the identity of patient-wise tumors harvested post-mortem.
Fig. 2
Fig. 2. Chromosome X architecture captures intra- and inter-patient diversity.
aj Skyline plots (drawn using Graphpad prism) showing the proportion of samples in each patient with copy number gains (≥2 copies, along y-axis) at individual bins (500 kb wide) across chromosome X (along x-axis) (Supplementary Data 6). Number of metastatic samples per patient (n) is provided for each panel. Vertical dotted lines denote position of AR gene and associated enhancer region. e Inset used to show focal gain in AR, not evident at low resolution in the skyline plot. Orange squares depict mean copy number for contributing segment(s) and black dots represent copy number of each bin. Number of metastatic samples used per patient - CA35: n = 5, CA79: n = 12, PEA172: n = 25, CA36: n = 11, CA43: n = 10, CA63: n = 36, CA27: n = 15, CA34: n = 10, CA76: n = 18, CA83: n = 25.
Fig. 3
Fig. 3. High selective pressure for genomic alterations involving the AR gene region.
a Breakpoints at the start of structural variants (BND: translocation, DEL deletion, DUP duplication/gain and INV inversion) detected in high-coverage (~60X) whole-genome next-generation sequenced 25 samples from ten individuals, showing a 30 Megabase region of chromosome X around AR gene (Supplementary Data 7). b Left panel: anatomical positions of metastatic samples (inner circle) and their AR copy number (outer circle) are shown for CA34. Dashed outer circles depict samples with tumor content <0.2. Right panel: pie charts depicting the clonality (by cancer cell fraction, CCF) of breakpoints in the proximity of the AR gene and on chromosome 21 at the position of TMPRSS2:ERG fusion detected by high-coverage targeted sequencing on 11 samples (Supplementary Data 12). AR and associated enhancer are depicted with vertical salmon and blue dashed lines, respectively. We do not have high confidence in cancer cell fraction (CCF) calling for samples (CA34_1, CA34_2 and CA34_3) with very low tumor content. c Left panel: High-coverage custom NGS confirmed a copy number neutral breakpoint (for an inversion event) involving exon 5 to 7 of AR gene in patient CA27 which resulted in a ligand-independent, constitutively activated AR splice variant. Right panel: the distribution of the sub-clonal breakpoint and associated CCF at different anatomical sites are shown in pie charts (Supplementary Data 7). d Left panel: Anatomical sites of tissue sampled (color coded inner circles as for Fig. 1b) are shown with AR copy numbers (outer circles). Right panel: Pathological mutations detected in CA36 metastases using high-coverage targeted sequencing. Allelic fractions and tumor content are indicated by color and number, respectively. e Independent acquisition of AR mutations in a liver metastasis (CA36_11) detected using amplicon-based, high-coverage targeted sequencing. The supporting reads confirming each allele type shown on left: wild-type alleles are shown on top and mutated alleles are shown along the cartoon reads. f Reporter-luciferase assay showing activation of wild-type and mutant AR (T878A and D891N, individually and combined) by clinically relevant ligands (R1881: a synthetic androgen). Biological replicates of reporter-luciferase assay have been provided in Supplementary Fig. 9.
Fig. 4
Fig. 4. Copy number transition points confirm the same origin of lethal prostate cancer and archival biopsies and define the relationships of lethal metastases.
a Histograms showing sharing of copy number transition points detected in archival biopsies (total 24 archival biopsy samples from 8 patients) with metastases harvested post-mortem from the same patient (upper panel) and for each archival sample, across metastases harvested from each of the remaining patients (lower panel). A bin-width of 0.02 is chosen for both histograms along x-axis. b Percent of transition points detected in plasma (tumor content ≥ 0.2), collected post-mortem, are plotted as a function of the number of post-mortem metastatic samples from the same patient (N = 5 patients) (Supplementary Data 8). c Stacked bars show different percentages (<20%, 20 to 80% and >80%) of shared copy number transition points among autopsy samples in CA27 (Supplementary Data 8). Two prostate tumors (1 & 2) do not share a pathogenic AR inversion break point and display a higher percentage of tumor-unique transition points, while the remaining prostate tumor (CA27_4) shows more homogeneity of shared transition points with other distal metastases and, in unison, share the break point. d Left panel: Metastatic samples harvested postmortem in CA63 are depicted with anatomical position (inner circle) and AR copy number (outer circle). Right panel: Post-mortem metastatic samples form three distinct clusters by applying the SCRATCH clustering algorithm (described in methods). The color scheme of the heatmap is based on the correlation distances calculated using copy numbers at transition points. e Illustrative figure showing how clonal mutations (Supplementary Data 5), detected using Sclust, form a distinct peak at cancer cell fraction of 1.0. Intersection of non-silent clonal mutations between two samples were chosen and normalized by the total number of the smaller set of such mutations (described in methods). f Left panel: Correlation of percent common clonal non-silent mutation between metastases pairs in comparison (N = 27 comparing pairs) from the same patient and corresponding metastasis autosomal distances are shown with linear trendline (shaded area represents the 95% confidence interval level). Right panel: Box plot showing the distribution of percent common clonal non-silent mutations (N = 27 comparing pairs) by assignment of post-mortem samples in a cluster. Whisker follows mean ± IQR * 1.5 format of each box. Willcoxon non-parametric (one-sided) test was used to measure significance of difference between those two distinct groups, as shown.
Fig. 5
Fig. 5. Congruence of autosomal copy number and chromosome X derived relationships suggests selection of AR alterations in established clones.
Tanglegrams for CA63 (a) and PEA172 (b) with autosomal SCRATCH relationship network of metastases on the left and chromosome X-based SCRATCH relationship network on the right. Gray lines between relational networks are connecting the same metastatic cores between two SCRATCH determined metastatic relationships. c AR scores plotted as a function of AR expression (‘voom’ normalized, x-axis) for CA63, CA76, CA83 and PEA172 (Supplementary Data 9). Linear regression lines are drawn for each patient with the p-values of the correlation test in legend. d Boxplots showing the expression of AR and two of it’s regulated genes KLK3 and TMPRSS2 detected by ddPCR, on a logarithmic scale (y-axis), against the AR copy number status (gain or wild type) for patients CA63 (ngain,cluster1,3 = 4 samples, nwt,cluster2 = 4 samples) and PEA172 (ngain,cluster1 = 3 samples, ngain,cluster2 = 4 samples). In each box central line represents the mean and the whiskers represent mean ± IQR * 1.5 and p-values generated from the two-tailed Mann-Whitney U test are shown on the top for each comparing pair. Cluster numbers are shown below the x-axis. e, f Cartoons of postulated metastatic evolutionary relationships of dominant clones for CA63 (e, three clusters, denoted as Cl1, Cl2 and Cl3) and PEA172 (f, two clusters, denoted as Cl1 and Cl2) are shown with bidirectional trajectories as reverse migration of metastatic clone(s) cannot be ruled out. Bar charts show common or cluster-specific shared copy number transition points for respective patients. g Normalized expression of AR gene and distribution of AR-V12 mimics in the two different SCRATCH-defined autosomal clusters (depicted with purple and red circles at the base) are shown as circles for patient PEA172 (N = 20 samples). One-sided Fisher’s exact test (alternative = “less”) showed a significant difference (p = 0.0047) in the distribution of AR-V12 mimics between clusters.

References

    1. James ND, et al. Abiraterone for prostate cancer not previously treated with hormone therapy. N. Engl. J. Med. 2017;377:338–351. - PMC - PubMed
    1. Visakorpi T, et al. In vivo amplification of the androgen receptor gene and progression of human prostate cancer. Nat. Genet. 1995;9:401–406. - PubMed
    1. Li Y, et al. Diverse AR gene rearrangements mediate resistance to androgen receptor inhibitors in metastatic prostate cancer. Clin. Cancer Res. 2020;26:1965–1976. - PMC - PubMed
    1. Annala M, et al. Evolution of castration-resistant prostate cancer in ctDNA during sequential androgen receptor pathway inhibition. Clin. Cancer Res. 2021;27:4610–4623. - PubMed
    1. Taplin ME, et al. Mutation of the androgen-receptor gene in metastatic androgen-independent prostate cancer. N. Engl. J. Med. 1995;332:1393–1398. - PubMed

Publication types

Substances