. 2023 Aug 10;14(1):4829.
doi: 10.1038/s41467-023-40600-7.

MTH1 protects platelet mitochondria from oxidative damage and regulates platelet function and thrombosis

Affiliations

MTH1 protects platelet mitochondria from oxidative damage and regulates platelet function and thrombosis

Yangyang Ding et al. Nat Commun. .

Abstract

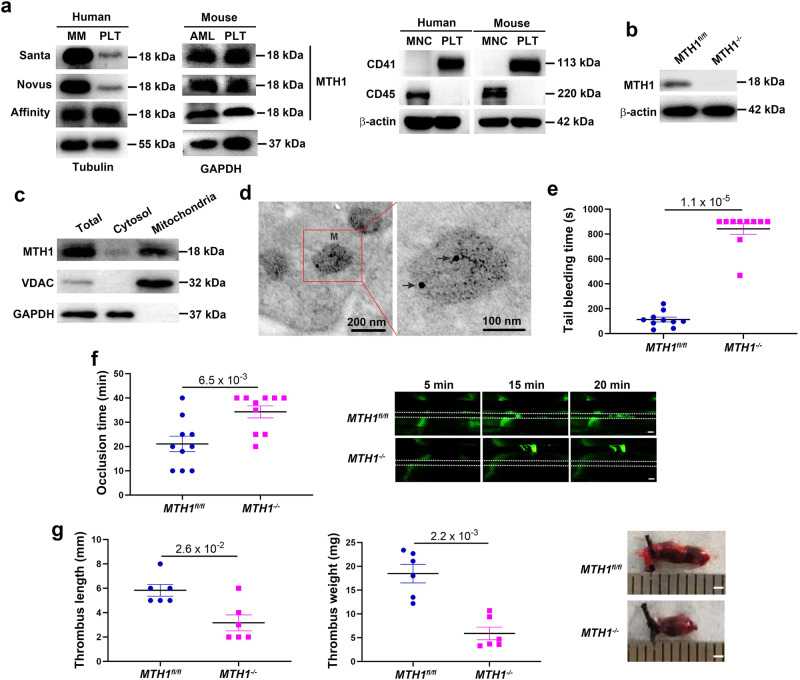
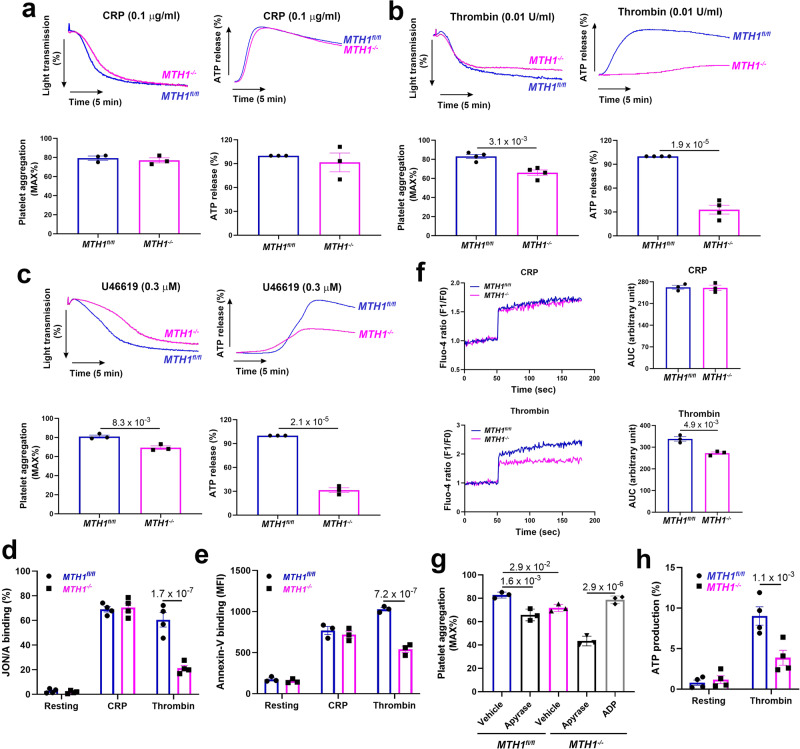
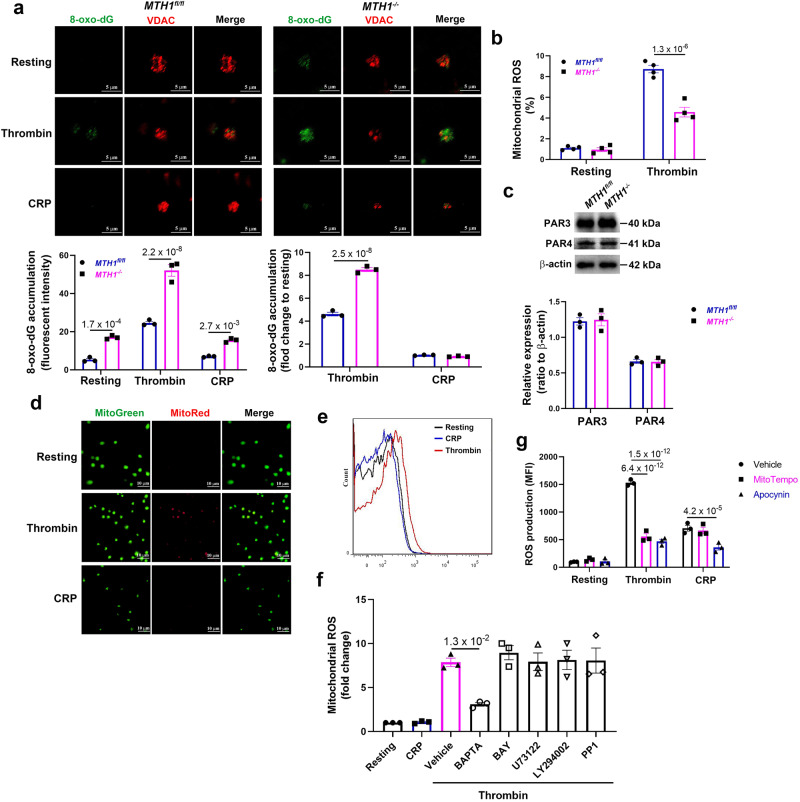
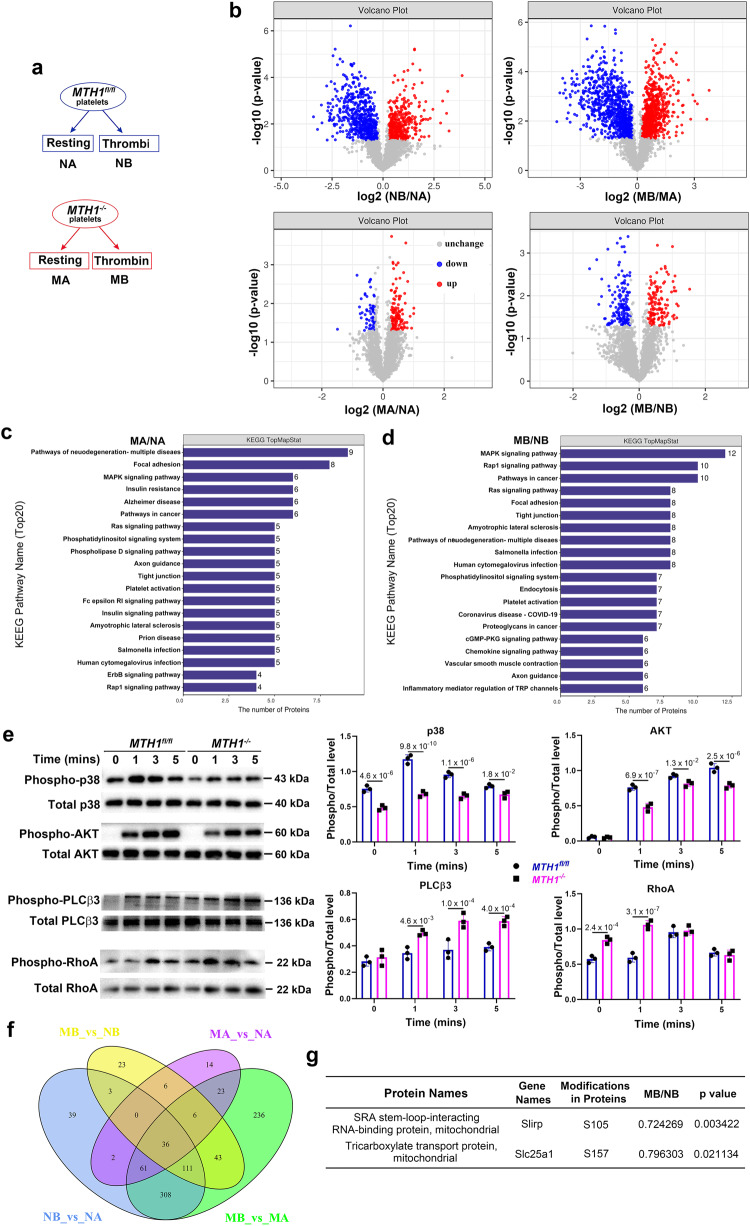
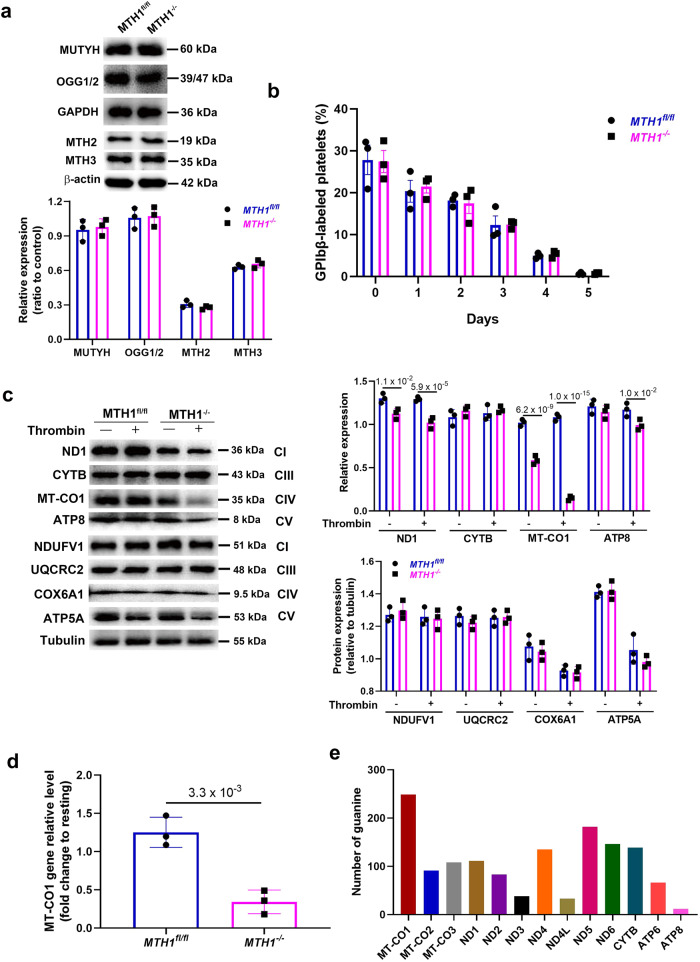
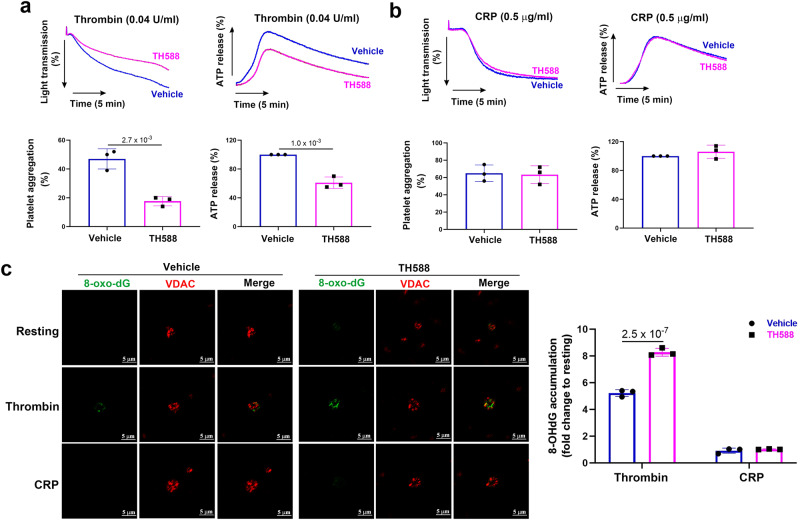
Human MutT Homolog 1 (MTH1) is a nucleotide pool sanitization enzyme that hydrolyzes oxidized nucleotides to prevent their mis-incorporation into DNA under oxidative stress. Expression and functional roles of MTH1 in platelets are not known. Here, we show MTH1 expression in platelets and its deficiency impairs hemostasis and arterial/venous thrombosis in vivo. MTH1 deficiency reduced platelet aggregation, phosphatidylserine exposure and calcium mobilization induced by thrombin but not by collagen-related peptide (CRP) along with decreased mitochondrial ATP production. Thrombin but not CRP induced Ca2+-dependent mitochondria reactive oxygen species generation. Mechanistically, MTH1 deficiency caused mitochondrial DNA oxidative damage and reduced the expression of cytochrome c oxidase 1. Furthermore, MTH1 exerts a similar role in human platelet function. Our study suggests that MTH1 exerts a protective function against oxidative stress in platelets and indicates that MTH1 could be a potential therapeutic target for the prevention of thrombotic diseases.


Conflict of interest statement

The authors declare no competing interests.

Figures

Fig. 1
Fig. 1. MTH1 is expressed in platelet mitochondria and regulates hemostasis and thrombosis in vivo.
Human or wild-type mouse platelets were isolated to measure MTH1 expression by western blot with three different antibodies using human multiple myeloma (MM) cells or mouse acute myeloid leukemia (AML) cells as positive control (representative of three independent experiments) (a). b MTH1 expression in MTH1-deficient platelets was measured by western blot using MTH1 antibody (Santa Cruz). c Platelet cytosol and mitochondria were isolated from wild-type mice to measure the expression of MTH1 (MTH1 antibody from Santa Cruz), VDAC (VDAC antibody from Abcam) or GAPDH (representative of three independent experiments). d Platelets were isolated from wild-type mouse and then fixed followed by labeling with MTH1 antibody and then with the secondary antibody to evaluate the localization of MTH1 using immune electron microscopy (n = 3 independent isolated platelets). M indicates mitochondria and arrows indicates the positive expression of MTH1. Left panel: ×12,000 and right panel: ×30,000. e Tail bleeding time (mean, n = 10 independent animals, two-tailed Mann–Whitney test) and f arterial thrombus formation (mean, n = 10 independent animals, two-tailed Mann-Whitney test). Representative image of thrombus formation at 5, 15 and 20 min was shown. The dotted lines indicate arterial vessel walls. Scale bar = 200 μm. g Venous thrombosis evaluation. Mice underwent ligation of inferior vena cava (IVC) to induce venous thrombosis and IVC samples were collected after 24 h of ligation to measure thrombus length and weight (mean, n = 10 independent animals, two-tailed Mann–Whitney test). The representative image of the venous thrombi was shown in the right panel. Scale bar = 1 mm.
Fig. 2
Fig. 2. MTH1 deficiency impairs GPCR-dependent platelet aggregation, granule secretion, calcium mobilization and mitochondrial ATP production.
Washed platelets (200 × 109/l) from MTH1fl/fl or MTH1-/- mice were stimulated with CRP (0.1 μg/ml) (mean ± SE, n = 3 independent isolated platelets) (a), thrombin (0.01 U/ml) (mean ± SE, n = 4 independent isolated platelets) (b), U46619 (0.3 μM) (mean ± SE, n = 3 independent isolated platelets) (c) followed by analysis of platelet aggregation and ATP release (reflecting dense granule secretion) in a Lumi-Aggregometer Model 700 (two-tailed unpaired Student’s t test). Washed platelets were stimulated with CRP or thrombin to measure integrin αIIbβ3 activation (presented by JON/A binding) (mean ± SE, n = 4 independent isolated platelets, two-way ANOVA with Sidak multiple comparisons test) (d) and phosphatidylserine exposure (presented by Annexin-V binding) (mean ± SE, n = 3 independent isolated platelets, two-way ANOVA with Sidak multiple comparisons test) (e) by flow cytometry or calcium mobilization using Fluo-4 AM by a microplate reader (mean ± SE, n = 3 independent isolated platelets, two-tailed unpaired Student’s t test) (f). g Platelet aggregation in response to thrombin (0.01 U/ml) after addition of apyrase (0.25 U/ml) or ADP (1 μM) (mean ± SE, n = 3 independent isolated platelets, one-way ANOVA with Tukey multiple comparisons test). h Mitochondrial ATP production was measured using the Biotracker dye in thrombin-stimulated platelets (mean ± SE, n = 4 independent isolated platelets, two-way ANOVA with Sidak multiple comparisons test).
Fig. 3
Fig. 3. Increased mitochondrial 8-oxo-dG accumulation in thrombin-stimulated MTH1-deficient platelets.
a Accumulation of 8-oxo-dG in mitochondria of platelets from MTH1fl/fl or MTH1−/− mice after stimulation by thrombin (1 U/ml) or CRP (5 μg/ml) (mean ± SE, n = 3 independent isolated platelets, two-way ANOVA with Sidak multiple comparisons test). b Washed platelets were loaded with MitoSOX Red (5 μM) for 10 min and then stimulated with thrombin (0.25 U/ml) for 3 min to measure mitochondrial ROS production by flow cytometry (mean ± SE, n = 3 independent isolated platelets, two-way ANOVA with Sidak multiple comparisons test). c PAR3 and PAR4 expression in MTH1fl/fl and MTH1−/− platelets under resting conditions (mean ± SE, n = 3 independent isolated platelets, two-tailed unpaired Student’s t test). d Wild-type (WT) platelets were treated with thrombin (1 U/ml) or CRP (5 μg/ml) for 3 min followed by measuring the mitochondrial ROS generation using MitoSox Red and MitoTracker Green probes by fluorescent microscope (×100) (n = 3 independent isolated platelets). e Representative image of mitochondrial ROS generation in WT platelets after stimulation with CRP or thrombin by flow cytometry. f WT platelets were pretreated with BAPTA (calcium inhibitor) (20 μM), BAY 11-7082 (NF-κB inhibitor), U-73122 (PLC inhibitor) (5 μM), LY294002 (PI3K inhibitor) (20 μM), PP1 (Src inhibitor) (10 μM) (MedChemExpress) for 5 min followed by stimulation with thrombin or CRP to measure mitochondrial ROS by flow cytometry (mean ± SE, n = 3 independent isolated platelets, one-way ANOVA with Dunnett multiple comparisons test). g WT platelets were pre-incubated with vehicle, Mito-TEMPO (10 μM) or Apocynin (500 μM) and then treated with thrombin or CRP followed by measuring intracellular ROS production by flow cytometry using H2DCFDA (mean ± SE, n = 3 independent isolated platelets, two-way ANOVA with Tukey multiple comparisons test).
Fig. 4
Fig. 4. Dysregulated protein phosphorylation in MTH1-deficient platelets after thrombin stimulation.
a MTH1fl/fl or MTH1−/− platelets were treated with thrombin (1 U/ml) for 3 min followed by quantitative phosphoproteomics assay. b Differentially expressed phosphopeptides between two groups were presented as volcano map. X-axis shows the fold change (logarithmic conversion based on 2) and Y-axis shows the P-value (logarithmic conversion based on 10). Red dots represented the differentially upregulated phosphopeptides with significance and Blue dots showed the differentially downregulated phosphopeptides with significance. KEGG pathway analysis between control and MTH1-deficient platelets under the condition of resting (MA/NA) (c) or stimulation (MB/NB) (d). e MTH1fl/fl or MTH1−/− platelets were stimulated with thrombin (1 U/ml) followed by measuring the phosphorylation level of p38 MAPK, AKT, PLCβ3 and RhoA. The data were quantified based on three independent experiments (mean ± SD, n = 3 independent isolated platelets, two-way ANOVA with Sidak multiple comparisons test). f The number of differentially expressed phosphopeptides among the four groups. g Details of the 2 differentially expressed phosphopeptides localized in the mitochondria with significance identified from the comparison of control and MTH1-deficient platelets after thrombin stimulation (n = 3 independent experiments, two-tailed unpaired Student’s t test).
Fig. 5
Fig. 5. MTH1 deficiency reduces the expression of mtDNA-encoded genes after thrombin stimulation.
a Western blot analysis of the expression of MUTYH, OGG1/2, MTH2, and MTH3 in MTH1fl/fl and MTH1-/- platelets under resting condition. The representative images were shown from three independent experiments (mean ± SD, n = 3 independent isolated platelets). b Mice were administered a Dylight 488-labeled anti-GP1bβ antibody (Emfret, X488) via tail vein (0.1 μg/g body weight) to measure platelet half-life by flow cytometry. Data were presented as mean ± SE (n = 3, two-way ANOVA with Sidak multiple comparisons test. c Expression of subunit of complexes (CI, CIII, CIV and CV) in the mitochondrial respiration chain proteins encoded by mtDNA (ND1, CYTB, MT-CO1, ATP8) or nucleus DNA (NDUFV1, UQCRC2, COX6A1, ATP5A) in platelets from MTH1fl/fl or MTH1−/− mice before (−) and after (+) stimulation with thrombin (1 U/ml) for 3 mins (representative of three independent experiments) (mean ± SD, n = 3, two-way ANOVA with Sidak multiple comparisons test). d MT-CO1 gene expression level in thrombin-activated platelets from MTH1fl/fl or MTH1−/− mice was measured by quantitative real-time PCR and represented as a fold change relative to its level in resting platelets (mean ± SD, n = 3 independent isolated platelets, two-tailed unpaired Student’s t test). e Analysis of the number of guanine in the 13 mtDNA sequences.
Fig. 6
Fig. 6. Inhibition of human platelet MTH1 reduces thrombin-mediated platelet function.
Washed human platelets were pre-treated with 5 μM TH588 (MTH1 inhibitor) for 1 h at 37 °C and platelet aggregation and ATP release induced by either thrombin (0.04 U/ml) (mean ± SD, n = 3, two-tailed unpaired Student’s t test) (a) or CRP (0.5 μg/ml) (mean ± SD, n = 3, two-tailed unpaired Student’s t test) (b), as well as 8-oxo-dG accumulation in platelet mitochondria induced by thrombin (1 U/ml) or CRP (5 μg/ml) (c) (mean ± SD, n = 3, two-way ANOVA with Sidak multiple comparisons test) were measured.

References

    1. Melchinger H, Jain K, Tyagi T, Hwa J. Role of platelet mitochondria: life in a nucleus-free zone. Front. Cardiovasc. Med. 2019;6:153. - PMC - PubMed
    1. Kuhlbrandt W. Structure and function of mitochondrial membrane protein complexes. BMC Biol. 2015;13:89. - PMC - PubMed
    1. Wang C, Youle RJ. The role of mitochondria in apoptosis. Annu. Rev. Genet. 2009;43:95–118. - PMC - PubMed
    1. Hekimi S, Wang Y, Noe A. Mitochondrial ROS and the effectors of the intrinsic apoptotic pathway in aging cells: the discerning killers! Front. Genet. 2016;7:161. - PMC - PubMed
    1. Kim HE, et al. Lipid biosynthesis coordinates a mitochondrial-to-cytosolic stress response. Cell. 2016;166:1539.e6–1552.e6. - PMC - PubMed

Publication types