. 2023 Aug 10;14(1):4852.
doi: 10.1038/s41467-023-40548-8.

Norepinephrine release in the cerebellum contributes to aversive learning

Affiliations

Norepinephrine release in the cerebellum contributes to aversive learning

Adrien T Stanley et al. Nat Commun. .

Abstract

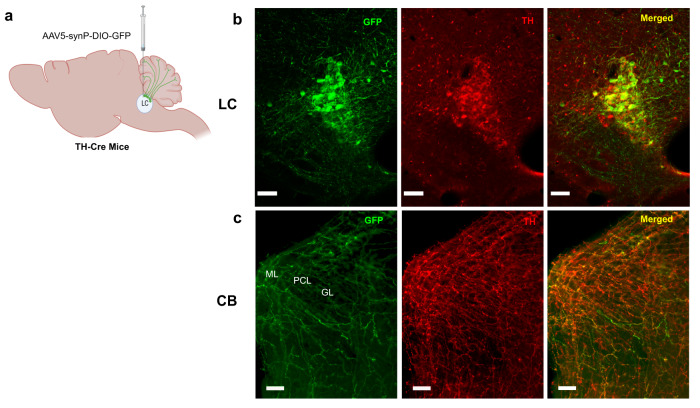
The modulation of dopamine release from midbrain projections to the striatum has long been demonstrated in reward-based learning, but the synaptic basis of aversive learning is far less characterized. The cerebellum receives axonal projections from the locus coeruleus, and norepinephrine release is implicated in states of arousal and stress, but whether aversive learning relies on plastic changes in norepinephrine release in the cerebellum is unknown. Here we report that in mice, norepinephrine is released in the cerebellum following an unpredicted noxious event (a foot-shock) and that this norepinephrine release is potentiated powerfully with fear acquisition as animals learn that a previously neutral stimulus (tone) predicts the aversive event. Importantly, both chemogenetic and optogenetic inhibition of the locus coeruleus-cerebellum pathway block fear memory without impairing motor function. Thus, norepinephrine release in the cerebellum is modulated by experience and underlies aversive learning.


Conflict of interest statement

The authors declare no competing interests.

Figures

Fig. 1
Fig. 1. The cerebellum exhibits a widespread expression of NE fibers.
a Schematic illustration of stereotaxic injection of AAV5-GFP into the LC of TH-Cre mice. Four to six weeks after AAV-delivery, immunostaining revealed expression of TH and GFP in the LC neurons (created with BioRender.com) (b) and their axonal projections to CB vermis (c); PCL Purkinje cell layer, GL granular layer, and ML molecular layer. One representative image of 6 independent experiments is shown in b and c. Scale bar, 100 μm.
Fig. 2
Fig. 2. FFN270 labels NE axons in the cerebellum.
a Schematic of cerebellar brain slice preparation and incubation with FFN270 with or without nomifensine (created with BioRender.com). b, c Representative 2-photon microscopy images of FFN270 (10 μM) loaded into the NE axons of acute cerebellar slices (lobule IV; one representative image of 4 independent experiments is shown in b and c). d The FFN270 axonal labeling was inhibited by nomifensine (lobule IV; NOM, 5 μM; representative of 3 independent experiments). PCL Purkinje cell layer, GL granular layer, and ML molecular layer. The scale bar is 5 μm in (b); 100 μm in (c and d).
Fig. 3
Fig. 3. Effect of foot-shock on the NE release in the cerebellum.
a AAV9-GRABNE was injected in the mouse cerebellar vermis and the optical fiber was implanted above the injection site (created with BioRender.com). b Mice were individually placed in the chamber and received 10 foot-shocks (0.5 mA, 1 s) with an inter-shock interval of 60 s (created with BioRender.com). c On the left, stereotaxic location of the optic fiber; based on Franklin and Paxinos’s mouse brain atlas (2007). On the right, histological section of the mouse cerebellum stained with DAPI showing the optic fiber placement (the image is representative of 8 independent experiments). Scale bar is 500 μm. d Representative image of 8 independent experiments of GRABNE expression in the cerebellum. PCL Purkinje cell layer, GL granular layer, and ML molecular layer. Scale bar is 100 μm. e Time course of GRABNE fluorescence, expressed as Z-score, in response to foot-shock under control condition (saline) and following systemic administration of amphetamine (10 mg/kg, i.p.), n = 8 mice. f, g Response to foot-shock measured as area under the curve (AUC) from 0 to 1.4 s (two-sided paired t-test no shock vs shock (saline) p = 0.0443; n = 8 mice) and from 1.4 to 5 s (two-sided paired t-test no shock vs shock (saline) p = 0.0001; n = 8 mice). Systemic administration of amphetamine (Amph) had no effect on the peak (AUC from 0 to 1.4 s: one-way ANOVA for treatment F(1.657, 11.6) = 1.653, p = 0.2327.) but induced a significant decrease in fluorescence relative to the trough (AUC from 1.4 to 5 s: one-way ANOVA for treatment F(1.962, 13.73) = 30.38, p < 0.0001, followed by Tukey test for multiple comparisons shock vs shock + amphetamine p = 0.0171); n = 8 mice per treatment. Data are presented as mean values ± SEM, corresponding to bars or shaded regions. Source data are provided as Source Data file.
Fig. 4
Fig. 4. Threat conditioned stimulus triggers NE release in the cerebellum.
a During fear conditioning, mice received two CS–US pairing trials. After 24 h, mice were exposed to 10 tones alone in a different context (recall) (created with BioRender.com). b Left graph: Percent time freezing during conditioning (two-sided paired t-test p = 0.1041; n = 6 mice). Right graph: Percent time freezing in response to the first conditioning tone and the first recall tone (two-sided paired t-test p = 0.0173; n = 6 mice). c Time course of average GRABNE fluorescence, expressed as Z-score, in response to 2 conditioning tone-shock presentations and intertrials (n = 6 mice). d, e Conditioning tones did not cause a significant change in GRABNE fluorescence (AUC 0-30 s: one-way ANOVA F (1.442, 7.212) = 0.662 relative to intertrial; n = 6 mice) while foot-shock induced a significant fluorescence decrease (AUC 29-34 s: F(1.574, 7.869) = 39.28, p = 0.0001 relative to intertrial; n = 6 mice). f Time course of GRABNE fluorescence across the 10 recall tones and the intertrials (n = 6 mice). g GRABNE fluorescence across 10 recall tones relative to the intertrials (two-sided paired t-test p = 0.0117; n = 6 mice). h GRABNE fluorescence change during the first CS presentation in the recall test vs. the first CS presented in the conditioning (two-sided paired t-test p = 0.0258; n = 6 mice). i Heat map showing the mean GRABNE fluorescence response to each of the 10 recall tones (n = 6 mice). j GRABNE fluorescence and movement score in response to recall tone in one representative mouse. Red trace represents movement score while blue trace represents fluorescence. The two movement peaks occur at the beginning and the end of the recall tones. k Pearson cross-correlation (n = 6 mice) between GRABNE fluorescence and movement score in response to recall tone. Data are presented as mean values ± SEM, corresponding to bars or shaded regions. Source data are provided as Source Data file.
Fig. 5
Fig. 5. Inhibition of LC-NE projections to the CB impairs auditory fear conditioning.
a Inhibitory DREADD hM4D(Gi)-mCherry or control YFP virus were bilaterally injected in the LC of TH-Cre mice. CNO (300 nM) or saline was delivered into the CB vermis (created with BioRender.com). b DAPI-stained cerebellar slice showing the cannula placement (right) and corresponding stereotaxic atlas page (left). Scale bar, 500 μm. The image is representative of at least four replicates per experimental conditions. c, d Gi-DREADD (green) and TH (red) double labeling of LC neurons and their projections to CB. GL granular layer. Scale bar, 50 μm. Each image is representative of at least four replicates per experimental conditions. e DREADD-mediated inhibition of LC-CB projections during fear conditioning reduced the freezing response to the recall tone (two-way ANOVA followed by Sidaks test: treatment factor (F(1, 18) = 8.376, P = 0.0097), viral expression factor (F(1, 18) = 4.632, P = 0.0452), interaction factor (F(1, 18) = 4.589, P = 0.0461); n = 7 mice treated with hM4Di/CNO, n = 6 mice treated with hM4Di/vehicle, n = 5 mice treated with YFP/CNO, n = 4 mice treated with YFP/vehicle. Measurement of the total distance (f) and speed (g) in the open field revealed no difference between hM4Di/CNO mice with respect to control mice (YFP and vehicle); n = 7 mice treated with hM4Di/CNO, n = 7 mice treated with hM4Di/vehicle, n = 6 mice treated with YFP/CNO, n = 5 mice treated with YFP/vehicle. h Number of footslip errors in narrow beam walking test showed no significant motor coordination impairment in hM4Di/CNO mice compared to control mice (YFP and vehicle); n = 8 mice treated with hM4Di/CNO, n = 7 mice treated with hM4Di/vehicle, n = 4 mice treated with YFP/CNO, n = 3 mice treated with YFP/vehicle. Data are presented as mean values ± SEM. Source data are provided as Source Data file.
Fig. 6
Fig. 6. Inhibition of LC-NE projections to the CB impairs auditory fear conditioning.
a Arch3-YFP was bilaterally injected into the LC of TH-Cre mice and optic fibers were bilaterally implanted in the CB vermis. b Stereotaxic and histology location of the optical fibers. On the left is a picture from the mouse brain atlas (Franklin and Paxinos; 2007). On the right is an image of a cerebellar slice showing the fiber placement in the cerebellum. Scale bar, 500 μm. The image is representative of at least four replicates per experimental conditions. c, d Arch3-YFP and TH expression in LC neurons and their axon terminals in the CB. PCL Purkinje cell layer, GL granular layer, and ML molecular layer. Scale bar, 100 μm. Each image is representative of at least four replicates per experimental conditions. e Optogenetic inhibition of LC axons in the CB during CS–US presentation suppressed the freezing response to recall tone (one-way ANOVA F(2, 10) = 16.87, p = 0,0006; Tukey’s post hoc test: Arch3-laser on versus YFP-laser on, p = 0.0013; Arch3-laser on versus Arch3-laser off, p = 0.002; Arch3-laser off versus YFP-laser on, p = 0.62; n = 5 mice treated with Arch3-laser on, n = 5 mice treated with Arch3-laser off, n = 3 mice treated with YFP-laser on). Data are presented as mean values ± SEM. Source data are provided as Source Data file.

References

    1. Lissek S, van Meurs B. Learning models of PTSD: theoretical accounts and psychobiological evidence. Int. J. Psychophysiol. 2015;98:594–605. doi: 10.1016/j.ijpsycho.2014.11.006. - DOI - PMC - PubMed
    1. Olds J. The central nervous system and the reinforcement of behavior. Am. Psychol. 1969;24:114–132. doi: 10.1037/h0027145. - DOI - PubMed
    1. Schultz W. Predictive reward signal of dopamine neurons. J. Neurophysiol. 1998;80:1–27. doi: 10.1152/jn.1998.80.1.1. - DOI - PubMed
    1. Likhtik E, Johansen JP. Neuromodulation in circuits of aversive emotional learning. Nat. Neurosci. 2019;22:1586–1597. doi: 10.1038/s41593-019-0503-3. - DOI - PubMed
    1. Lammel S, Lim BK, Malenka RC. Reward and aversion in a heterogeneous midbrain dopamine system. Neuropharmacology. 2014;76:351–359. doi: 10.1016/j.neuropharm.2013.03.019. - DOI - PMC - PubMed

Publication types

LinkOut - more resources