. 2023 Aug 10;14(1):4826.
doi: 10.1038/s41467-023-40424-5.

Extravillous trophoblast cell lineage development is associated with active remodeling of the chromatin landscape

Affiliations

Extravillous trophoblast cell lineage development is associated with active remodeling of the chromatin landscape

Kaela M Varberg et al. Nat Commun. .

Abstract

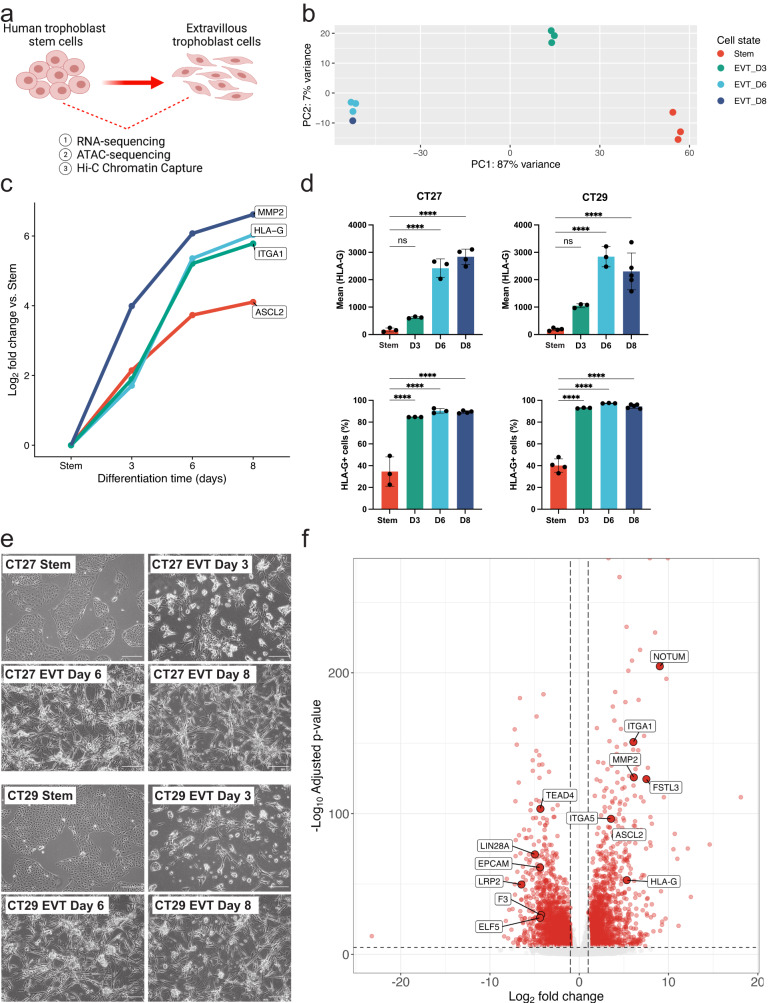
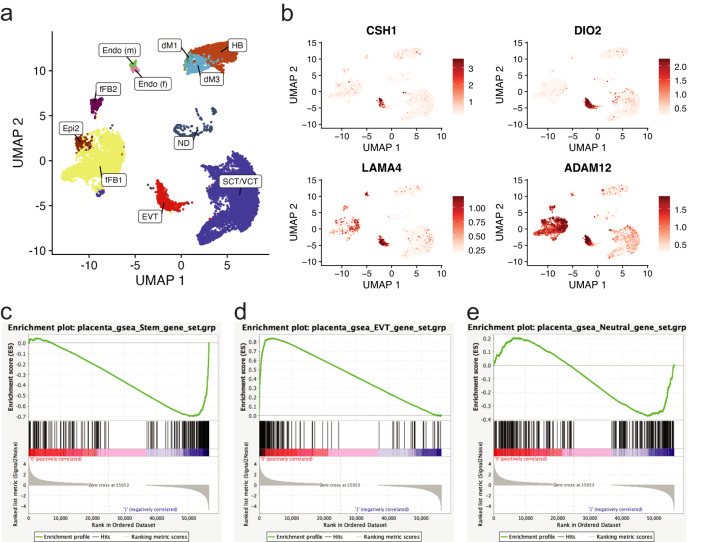
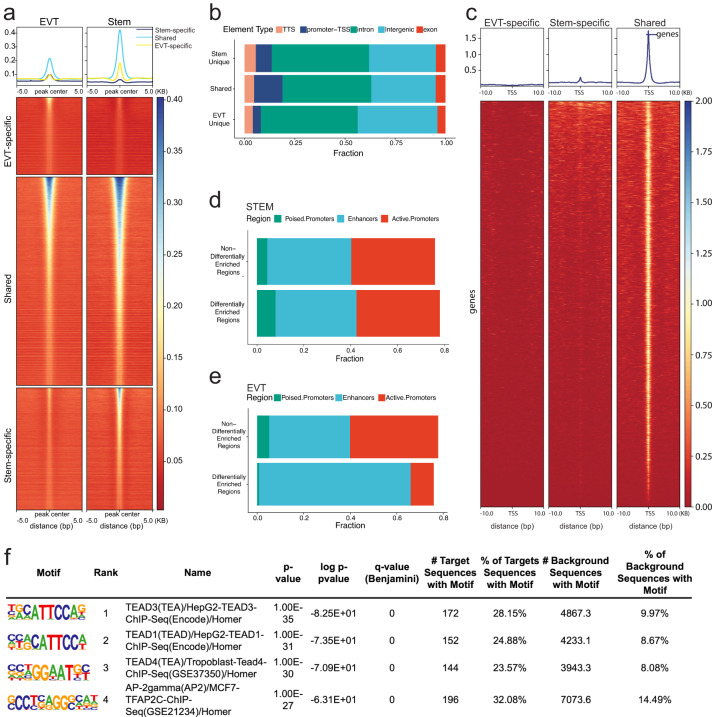
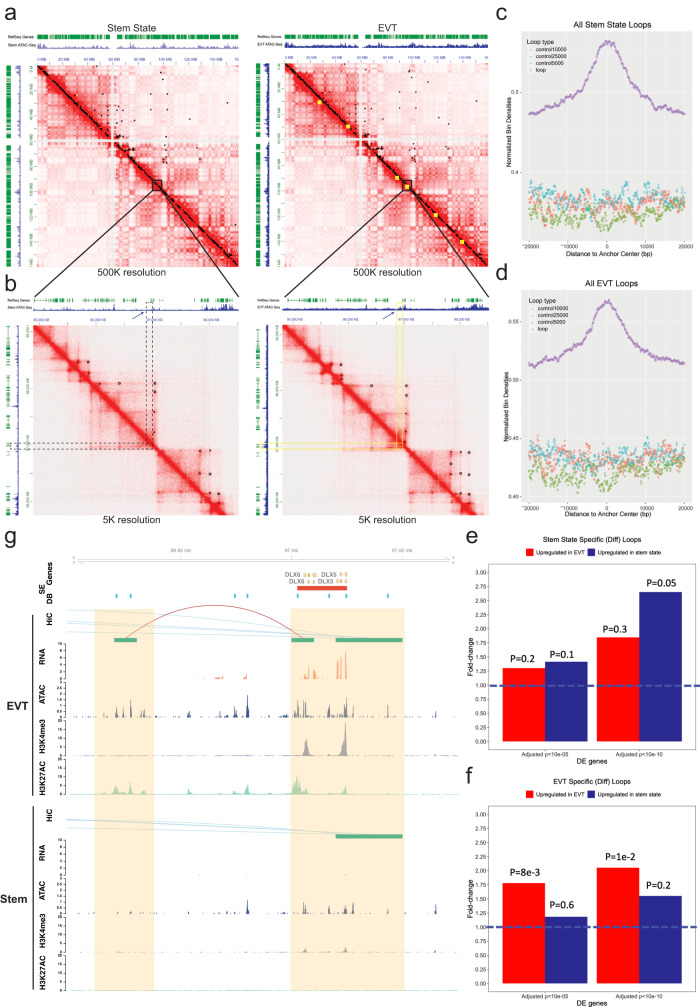
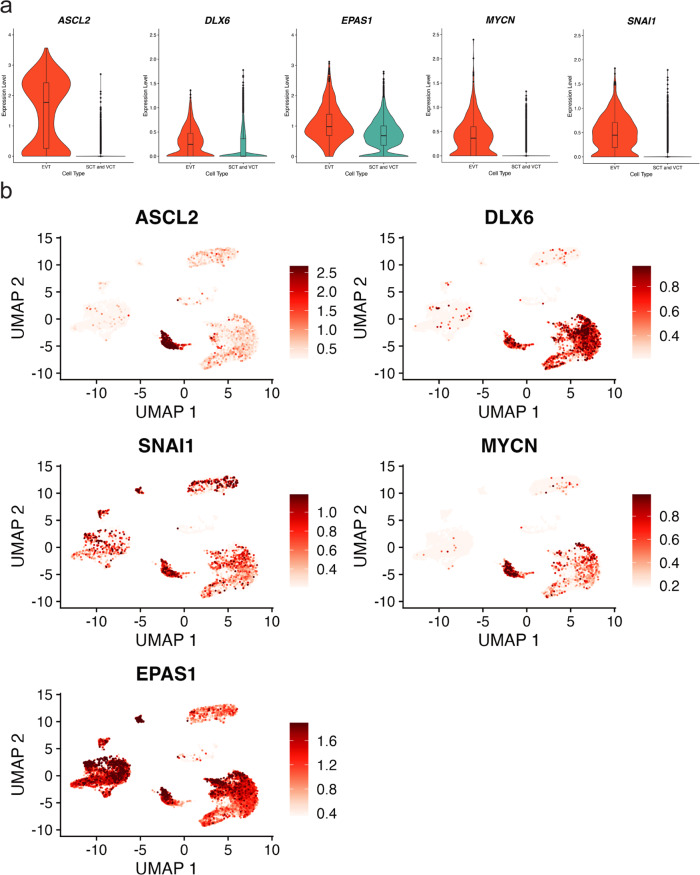
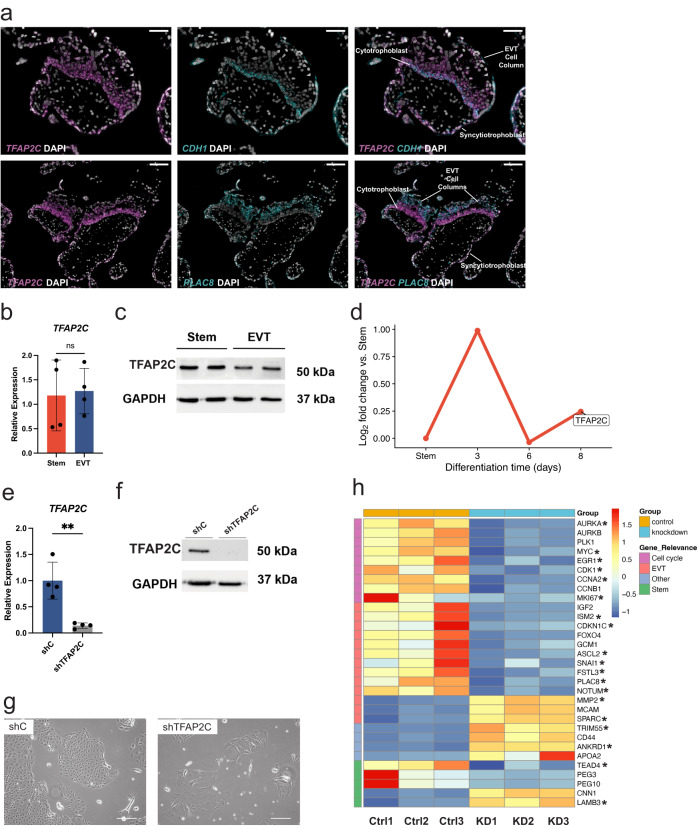
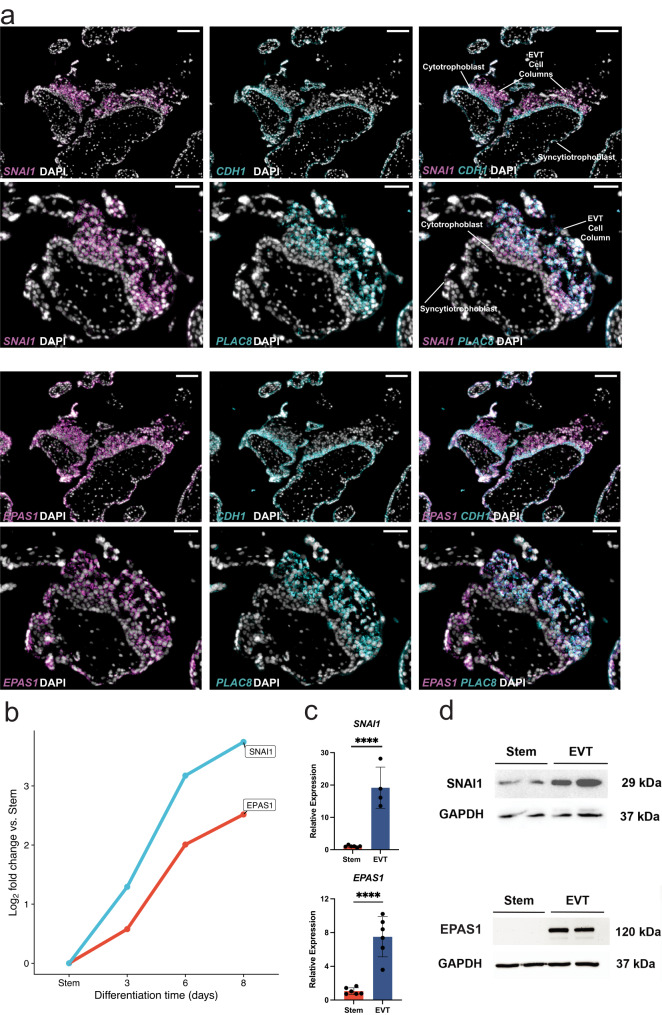
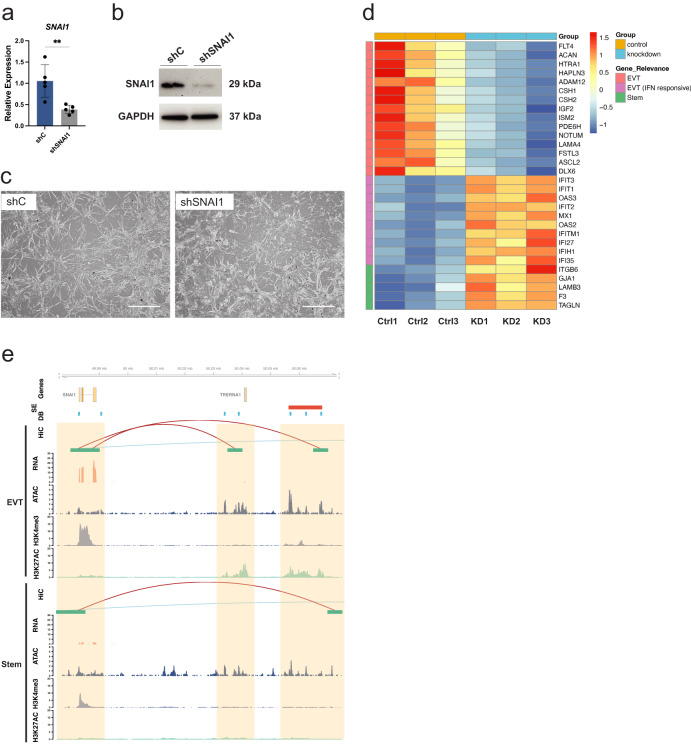
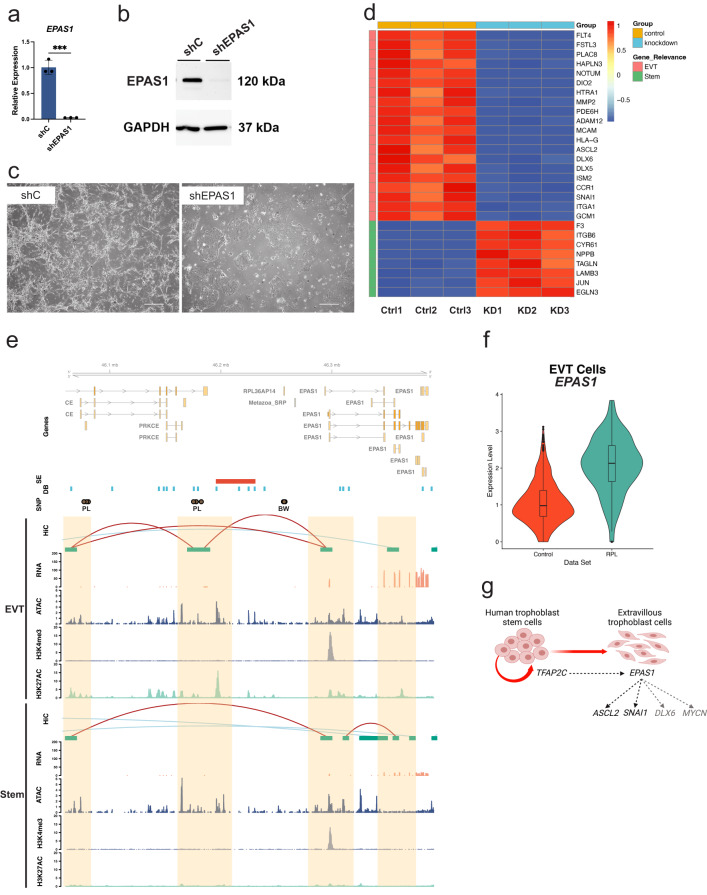
The extravillous trophoblast cell lineage is a key feature of placentation and successful pregnancy. Knowledge of transcriptional regulation driving extravillous trophoblast cell development is limited. Here, we map the transcriptome and epigenome landscape as well as chromatin interactions of human trophoblast stem cells and their transition into extravillous trophoblast cells. We show that integrating chromatin accessibility, long-range chromatin interactions, transcriptomic, and transcription factor binding motif enrichment enables identification of transcription factors and regulatory mechanisms critical for extravillous trophoblast cell development. We elucidate functional roles for TFAP2C, SNAI1, and EPAS1 in the regulation of extravillous trophoblast cell development. EPAS1 is identified as an upstream regulator of key extravillous trophoblast cell transcription factors, including ASCL2 and SNAI1 and together with its target genes, is linked to pregnancy loss and birth weight. Collectively, we reveal activation of a dynamic regulatory network and provide a framework for understanding extravillous trophoblast cell specification in trophoblast cell lineage development and human placentation.


Conflict of interest statement

The authors declare no competing interests.

Figures

Fig. 1
Fig. 1. Morphologic and transcriptomic changes during EVT cell differentiation.
a Schematic depicting three primary analyses (RNA-Seq, assay for transposase-accessible chromatin (ATAC)-Seq, and Hi-C) performed on human TS cells in the stem state and following eight days of extravillous trophoblast (EVT) cell differentiation (BioRender; n = 1 biological replicate of stem and EVT cells depicted. b Principal component analysis (PCA) plot depicting stem (red), EVT Day 3 (green), EVT Day 6 (light blue), and EVT Day 8 (dark blue) data of normalized read counts from RNA-Seq datasets. c Log2 fold-change values of normalized read counts from RNA-Seq of EVT cell-specific transcripts (ASCL2, HLA-G, ITGA1, and MMP2) at stem state and on day 3, 6, and 8 of EVT cell differentiation. d Mean HLA-G expression/cell (top) and the percentage (%) of HLA-G positive cells detected by flow cytometry in CT27 (left) and CT29 (right) cells in the stem state and on days 3, 6, and 8 of EVT cell differentiation (n = 3 biologically independent replicates for CT27 stem and CT27 and CT29 EVT days 3 and 6; n = 4 biologically independent replicates for CT29 stem and CT27 EVT day 8; n = 5 biologically independent replicates for CT29 EVT day 8; ****p < 0.0001). Data were analyzed using a one-way ANOVA followed by Dunnett’s multiple comparisons test and are presented as mean values ± standard deviation (SD). e Phase contrast images of TS cells cultured in the stem state and on days 3, 6, and 8 of EVT cell differentiation in CT27 and CT29 cell lines. Scale bars represent 500 μm. f Volcano plot depicting transcriptomic changes in EVT cells (CT27 and CT29) on day 8 of differentiation compared to stem state cells (CT27 and CT29) measured by RNA-Seq. Differentially expressed transcripts (absolute log2 fold change >1, adjusted p-value < 0.05) are labeled in red obtained by hypothesis testing by a Wald test followed by Benjamini and Hochberg procedure to adjust for multiple testing. Key stem state (ELF5, EPCAM, F3, LIN28A, LRP2, and TEAD4) and EVT cell (ASCL2, FSTL3, HLA-G, ITGA1, ITGA5, MMP2, and NOTUM) transcripts are annotated. Source data are provided as a Source Data file.
Fig. 2
Fig. 2. Validation of in vitro signatures of the TS cell model in single cell datasets from human placental samples.
UMAP plots of single cell expression values (normalized, scaled, and natural-log transformed) depicting cell clustering from two publicly available, independent, single-cell RNA sequencing (scRNA-Seq) datasets from first-trimester placentas, for (a) all cell types inferred using marker genes published previously as decidual macrophages (dM), fetal (Endo f) and maternal endothelial cells (Endo m), epithelial glandular cells (Epi), extravillous trophoblast cells (EVT), fetal fibroblasts (FB), Hofbauer cells (HB), syncytiotrophoblast and villous cytotrophoblast (SCT/VCT) and cells not determined (ND) and (b) EVT cell-specific genes detected using an in vitro model (red color scale of expression values thresholded at the 5th and 95th percentiles). ce Plots depicting gene set enrichment analysis using three genes sets (each N = 250) of genes significantly upregulated in (c) SCT/VCT cells or (d), EVT cells or (e) genes not differently expressed between SCT/VCT and EVT cells from scRNA-Seq data sets and tested for enrichment for expression pattern in stem state (phenotype 1, CT27) and EVT cells (phenotype 0, CT27) from the in vitro TS cell model. Enrichment score (ES) reflects the degree of which each gene set is overrepresented at the extremes (top or bottom) of genes expressed in phenotype 0 (EVT cells) versus phenotype 1 (stem state cells). Estimated significance of ES were accounted for multiple testing and corresponded to (b) Phenotype 0; FDR q value = NS; Phenotype 1; FDR q value = 0.00190 (c) Phenotype 0; FDR q value = 0.00196; Phenotype 1; FDR q value = NS and (d) Phenotype 0; FDR q value = NS; Phenotype 1; FDR q value = 0.0016. FDR = false discovery rate; NS = not significant.
Fig. 3
Fig. 3. EVT cell differentiation is associated with global changes in chromatin accessibility.
a Density plot and heatmap of coverages from extravillous trophoblast (EVT) and stem state assay for transposase-accessible chromatin (ATAC)-seq assays showing stem-specific (dark blue), shared (light blue), and EVT-specific (yellow) regions centered around: EVT-specific peaks (top, ranked based on peak score from EVT ATAC-Seq in descending order), shared peaks across cell states (middle, ranked based on peak score from EVT ATAC-Seq in descending order) and stem state-specific peaks (bottom, ranked based on peak score from stem state ATAC-Seq in descending order), respectively. Each row represents one genomic region centered around (5kb) a peak and the depth of coverage is encoded in a colorimetric scale (red to blue corresponding low to high coverage). b Bar graphs depicting the fraction of chromatin accessible regions across five defined genomic regions (e.g., transcription termination site (TTS; pink), promoter-transcription start site (TSS; dark blue), intron (green), intergenic (light blue), and exon (red) regions). Chromatin accessible regions identified by ATAC-Seq are classified as regions (1) unique to stem state cells, (2) shared between stem and EVT cells or (3) unique to EVT cells. c Density plot and heatmap of coverages from EVT and stem state ATAC-Seq assays limited to genomic regions in EVT-specific peaks (left, ranked based on coverage in EVT ATAC-Seq in descending order), stem state-specific peaks (middle, ranked based on coverage in stem state ATAC-Seq in descending order) and shared peaks across cell states (right, ranked based on coverage in EVT ATAC-Seq in descending order). Each row represents one genomic region centered around (10 kb) a TSS and the depth of coverage is encoded in a colorimetric scale (red to blue corresponding low to high coverage). d, e Bar graphs depicting the fraction of differentially enriched chromatin accessible regions identified by ATAC-Seq in stem state (d) or EVT (e) cells across three chromatin states defined by histone modifications: H3K4me3 (putative poised promoters; green), H3K27ac (active enhancers; light blue) and H3K4me3+H3K27ac (active promoters; red). f Schematic depicting transcription factor (TF) analysis results and motifs for top identified TFs.
Fig. 4
Fig. 4. Long-range chromatin interactions in stem state and EVT cells.
Contact matrices (chromosome 7) from stem (left) and extravillous trophoblast (EVT) cell (right) Hi-C contact maps. Pixel intensity represents a normalized (balanced) number of observed loci pair contacts. Contact maps are annotated with RefSeq gene positions (green tracks) and cell state-specific assay for transposase-accessible chromatin (ATAC)-Seq assay signals (blue tracks, counts per million (CPM) mapped reads, y-axis). Selected regions exemplify the quantity of all loop anchors (black dots) versus EVT cell state-specific loop anchors (yellow squares) for a region mapping near an EVT cell-state specific transcription factor. Contact maps include (a) 500 kb whole chromosome and (b) 5 kb resolution region subsets. EVT cell-specific (differential) loops (yellow) with one anchor overlapping an EVT-specific regulatory element indicated by ATAC-Seq data (blue) with corresponding stem state regions (dashed lines). Density plots show open chromatin distribution relative to loop anchor centers (bp, x-axis) for all (c) stem and (d) EVT cell loops (purple). Normalized bin densities shown for every 10 million total reads (y-axis) measured by ATAC-seq. Regions below peak signals represent 1000 randomly selected control sets that do not intersect loops with 5 kb (blue), 10 kb (red) and 25 kb (green) region sizes. Proportion of differential loop anchors in stem (e) and EVT (f) cells that mapped to a nearby (within 10 kb) gene. Enrichment of significantly upregulated genes (RNA-Seq) shown for stem state (blue) and EVT (red) cells presented as fold-change (y-axis). Loop anchors link to significant vs non-significant genes (dotted line). P-values obtained from two-sided Fisher’s exact test. g Genomic sub-region highlighted in (b) (yellow box) annotated with Hi-C, RNA-Seq, ATAC-Seq, H3K4me3 and H3K27ac ChIP-Seq assessments in EVT (top) or stem state (bottom) CT27 cells. Regulatory elements near DLX5/DLX6 include Hi-C loops (red, both loop anchors in view; blue, loop anchors out of view), RNA-Seq (transcripts per million, y-axis), ATAC-Seq (CPM mapped reads, y-axis), H3K4me3, and H3K27ac ChIP-Seq (CPM mapped reads, y-axis) tracks. All datasets represented by individual tracks. Super-enhancers (SE, red) and differentially bound regions (DB, blue) are specific to EVT cells. Yellow highlights regulatory regions overlapping loop anchors.
Fig. 5
Fig. 5. Expression of transcription factors in single EVT cells derived from human placenta.
Data from two publicly available, independent, single-cell RNA sequencing (scRNA-Seq) datasets from first trimester placentas, are used and cell types are inferred using marker genes published previously as decidual macrophages (dM), fetal (Endo f) and maternal endothelial cells (Endo m), epithelial glandular cells (Epi), extravillous trophoblast cells (EVT), fetal fibroblasts (FB), Hofbauer cells (HB), syncytiotrophoblast and villous cytotrophoblast (SCT/VCT) and cells not determined (ND). Single cell expression values (normalized, scaled and natural-log transformed) for five transcription factors (ASCL2; DLX6; EPAS1, MYCN and SNAI1) shown in (a) Violin plots (shown as median and 25th and 75th percentiles; points are displayed as outliers if they are above or below 1.5 times the interquartile range) comparing EVT cells (orange, N = 693 cells) with syncytiotrophoblast (SCT) and villous cytotrophoblast cells (VCT) combined (turquoise, N = 7834 cells) and (b) UMAP feature plots (red color scale of expression values thresholded at the 5th and 95th percentiles).
Fig. 6
Fig. 6. Functional assessment of TFAP2C actions in trophoblast cell development.
a Representative human placental tissue specimen (12 weeks of gestation) probed for TFAP2C, CDH1, and PLAC8 transcripts using in situ hybridization. 4′,6-diamidino-2-phenylindole (DAPI) labels cell nuclei. Overlay of merged immunofluorescence images: TFAP2C (magenta), DAPI (gray), and either CDH1 (cyan) or PLAC8 (cyan), respectively. Scale bars represent 50 μm (CDH1 image panels) and 100 μm (PLAC8 image panels). b RT-qPCR measurement of TFAP2C normalized to POLR2A in stem (red) and extravillous trophoblast (EVT) cells (blue). Data were analyzed by unpaired t-test and are presented as mean values ± standard deviation (SD; ns = not significant p = 0.8374; n = 4 biologically independent replicates per group). c TFAP2C (50 kilodaltons (kDa)) and GAPDH (37 kDa) proteins in stem and EVT cells assessed by western blot analysis. d Log2 fold-change values of normalized read counts of TFAP2C from RNA-Seq in stem state and days 3, 6, and 8 of EVT cell differentiation compared to the stem state. e RT-qPCR measurement of TFAP2C normalized to POLR2A in stem state cells transduced with lentivirus containing a control shRNA (shC; blue) or a TFAP2C-specific shRNA (gray). Data were analyzed by unpaired t-test and are presented as mean values ± standard deviation (SD; shTFAP2C; n = 4 biologically independent replicates per group; **p = 0.0029). f TFAP2C (50 kDa) and GAPDH (37 kDa) proteins in stem state cells transduced with shC or shTFAP2C and assessed by western blot. g Phase contrast images of stem state cells transduced with shC or shTFAP2C. Scale bar represents 250 μm. h Heat map based on scaled, normalized counts of selected differentially expressed transcripts generated from RNA-Seq in shC (control, Ctrl; orange) or shTFAP2C (knockdown, KD; blue) transduced cells using a red-blue diverging scale. Transcripts are clustered into four groups including cell cycle (purple), EVT-specific (pink), stem state-specific (green), or other (blue). *Depict genes identified as direct targets of TFAP2C based on ChIP-Seq analysis in stem state cells. Graphs in panels (b) and (e) depict mean ± standard deviation. Source data are provided as a Source Data file.
Fig. 7
Fig. 7. Expression patterns of SNAI1, and EPAS1.
a Human placental tissue specimen (12 weeks of gestation) probed for SNAI1, EPAS1, CDH1 and PLAC8 transcripts using in situ hybridization. 4′,6-diamidino-2-phenylindole (DAPI) labels cell nuclei. Overlay of merged immunofluorescence images: SNAI1 (magenta), or EPAS1 (magenta), with DAPI (gray), and CDH1 (cyan) or PLAC8 (cyan). Scale bars represent 100 μm in CDH1 image panels and 50 μm in PLAC8 image panels. b Log2 fold-change values of normalized read counts of SNAI1 (blue) and EPAS1 (red) from RNA-Seq in stem state and days 3, 6, and 8 of extravillous trophoblast (EVT) cell differentiation compared to the stem state. c RT-qPCR measure of SNAI1 (stem n = 6 (red) and EVT n = 4 (blue) biologically independent replicates per group), and EPAS1 (n = 6 biologically independent replicates per group) normalized to B2M in stem and EVT cells (****p < 0.0001). Data were analyzed by unpaired t-test and are presented as mean values ± standard deviation (SD). d SNAI1 (29 kilodaltons (kDa)), EPAS1 (120 kDa), and GAPDH (37 kDa) protein in stem and EVT cells assessed by western blot analysis. Source data are provided as a Source Data file.
Fig. 8
Fig. 8. Functional investigation of SNAI1 on EVT cell differentiation in CT27 cells.
a RT-qPCR measurement of SNAI1 (n = 5 biologically independent replicates per group) normalized to B2M in extravillous trophoblast (EVT) cells differentiated from stem state cells transduced with lentivirus containing a control shRNA (shC; blue) or SNAI1-specific shRNA (shSNAI1; gray). Data were analyzed by unpaired t-test and are presented as mean values ± standard deviation (SD) and **p = 0.0054. b SNAI1 (29 kilodaltons (kDa)) and GAPDH (37 kDa) protein in EVT cells from shC control or shSNAI1 treated cells measured by western blot. c Phase contrast images of shC control or shSNAI1 EVT cells following eight days of differentiation. Scale bars represent 500 μm. d Heat map based on scaled, normalized counts of selected transcripts generated from RNA-Seq in shC (control, Ctrl; orange) or shSNAI1 (knockdown, KD; blue) transduced cells (n = 3 biologically independent replicates per group) using a red-blue diverging scale. Transcripts are clustered into three groups including EVT-specific (pink), EVT interferon (IFN) responsive (purple), or stem state-specific (green). e Hi-C, RNA-Seq, ATAC-Seq, and H3K4me3 and H3K27ac ChIP-Seq assessments performed in CT27 cells differentiated into EVT cells (top panel) or maintained in the stem state (bottom panel). Identified regulatory elements near SNAI1 are highlighted in orange and overlap Hi-C loops (red, both loop anchors in view; blue, loop anchors out of view), open chromatin by ATAC-Seq (counts per million mapped reads, y-axis), and promoter or enhancer mark by H3K4me3, or H3K27ac ChIP-Seq, respectively (counts per million mapped reads, y-axis). Expression level is shown by RNA-Seq (transcripts per million, y-axis). All datasets are shown in individual tracks. Super-enhancers (SE, red) and differentially bound regions (DB, blue) are specific to the EVT cell state. Source data are provided as a Source Data file.
Fig. 9
Fig. 9. Functional investigation of EPAS1 on EVT cell differentiation in CT27 cells.
a EPAS1 (n = 3 biologically independent replicates per group) normalized to B2M in extravillous trophoblast (EVT) cells differentiated from stem cells transduced with control shRNA (shC; blue) or EPAS1-specific shRNA (shEPAS1; gray) lentivirus. Data were analyzed by unpaired t-test and are presented as mean values ± standard deviation (SD) and ***p = 0.0002. b EPAS1 (120 kilodaltons (kDa)) and GAPDH (37 kDa) in EVT cells from shC control or shEPAS1 transduced cells. c Phase contrast images of EVT cells (day 8). Scale bars represent 500 μm. d Heat map based on scaled, normalized counts of selected transcripts (RNA-Seq) in shC control (Ctrl, orange) or shEPAS1 (KD, blue) transduced cells (n = 3 biologically independent replicates per group) using a red-blue diverging scale. Transcripts cluster into two groups (i) EVT-specific (pink) or (ii) stem state-specific (green). e Hi-C, RNA-Seq, assay for transposase-accessible chromatin (ATAC)-Seq, and H3K4me3 and H3K27ac chromatin immunoprecipitation (ChIP)-Seq assessments performed in EVT differentiated (top) or stem state (bottom) CT27 cells. Regulatory elements near EPAS1 (orange) overlap Hi-C loops (red, both loop anchors in view; blue, loop anchors out of view), open chromatin identified by ATAC-Seq (counts per million (CPM) mapped reads, y-axis), and promoter or enhancer marks identified by H3K4me3, or H3K27ac ChIP-Seq, respectively (CPM mapped reads, y-axis). Expression level is shown by RNA-Seq (transcripts per million, y-axis). All datasets shown as individual tracks. Super-enhancers (SE, red) and differentially bound regions (DB, blue) are EVT cell-specific. Brown circles denote SNPs associated with pregnancy loss (PL) or birth weight (BW) in large GWAS studies. f Violin plot (shown as median and 25th and 75th percentiles; points are displayed as outliers if they are above or below 1.5 times the interquartile range) of EPAS1 in EVT cells from single-cell RNA-Seq analysis of human first trimester placental samples from control (Control, orange, N = 693 cells) or recurrent pregnancy loss (RPL, turquoise, N = 194 cells) patients. Y-axis represents normalized and natural log transformed EPAS1 expression levels. g Schematic of transcriptional regulatory hierarchy controlling EVT cell differentiation (BioRender). Source data are provided as a Source Data file.

Similar articles

Cited by

References

    1. Brosens I, Puttemans P, Benagiano G. Placental bed research: I. The placental bed: from spiral arteries remodeling to the great obstetrical syndromes. Am. J. Obstet. Gynecol. 2019;221:437–456. doi: 10.1016/j.ajog.2019.05.044. - DOI - PubMed
    1. Velicky P, Knöfler M, Pollheimer J. Function and control of human invasive trophoblast subtypes: intrinsic vs. maternal control. Cell Adhes. Migr. 2016;10:154–162. doi: 10.1080/19336918.2015.1089376. - DOI - PMC - PubMed
    1. Knöfler M, et al. Human placenta and trophoblast development: key molecular mechanisms and model systems. Cell. Mol. Life Sci. 2019;76:3479–3496. doi: 10.1007/s00018-019-03104-6. - DOI - PMC - PubMed
    1. Damsky CH, Fisher SJ. Trophoblast pseudo-vasculogenesis: faking it with endothelial adhesion receptors. Curr. Opin. Cell Biol. 1998;10:660–666. doi: 10.1016/S0955-0674(98)80043-4. - DOI - PubMed
    1. Burton GJ, Woods AW, Jauniaux E, Kingdom JCP. Rheological and physiological consequences of conversion of the maternal spiral arteries for uteroplacental blood flow during human pregnancy. Placenta. 2009;30:473–482. doi: 10.1016/j.placenta.2009.02.009. - DOI - PMC - PubMed

Publication types

MeSH terms