. 2023 Aug 10;14(8):514.
doi: 10.1038/s41419-023-06029-y.

Neuroblastoma RAS viral oncogene homolog (N-RAS) deficiency aggravates liver injury and fibrosis

Affiliations

Neuroblastoma RAS viral oncogene homolog (N-RAS) deficiency aggravates liver injury and fibrosis

Kang Zheng et al. Cell Death Dis. .

Abstract

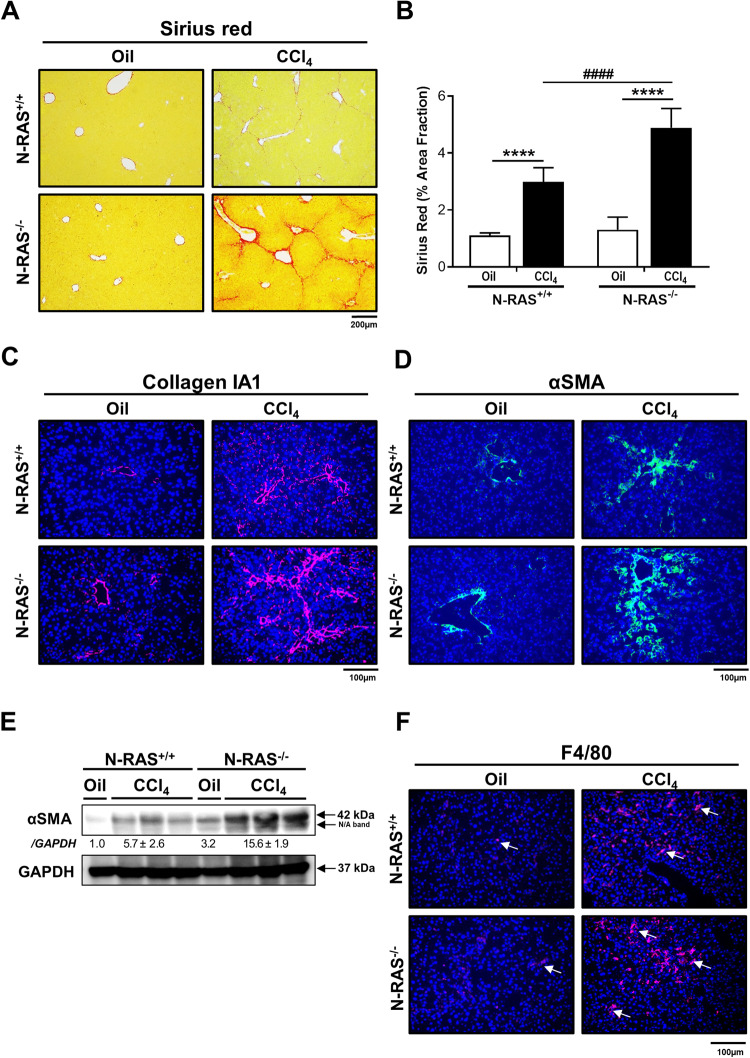
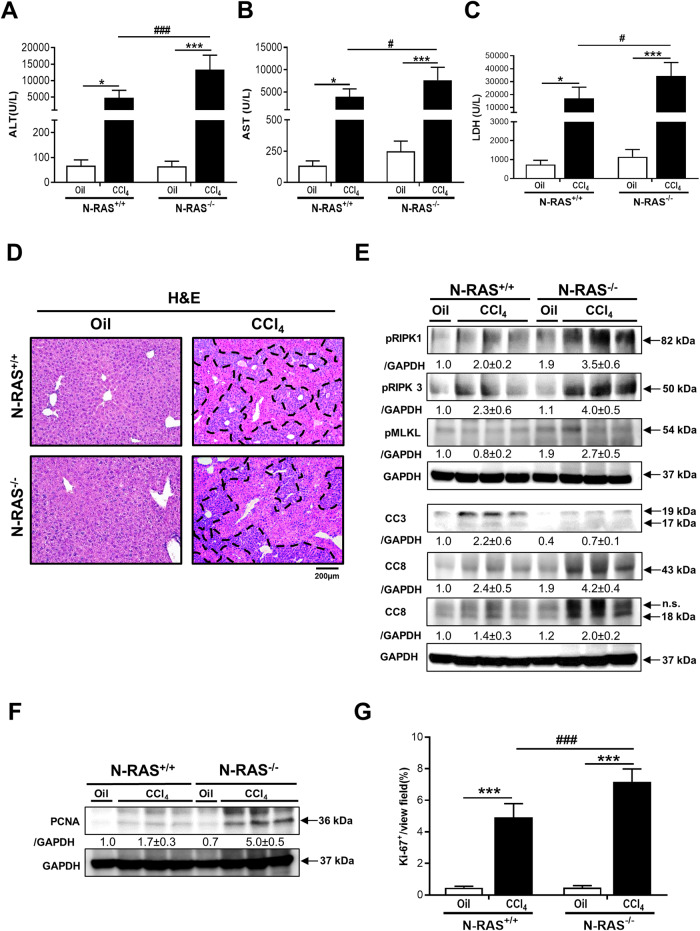
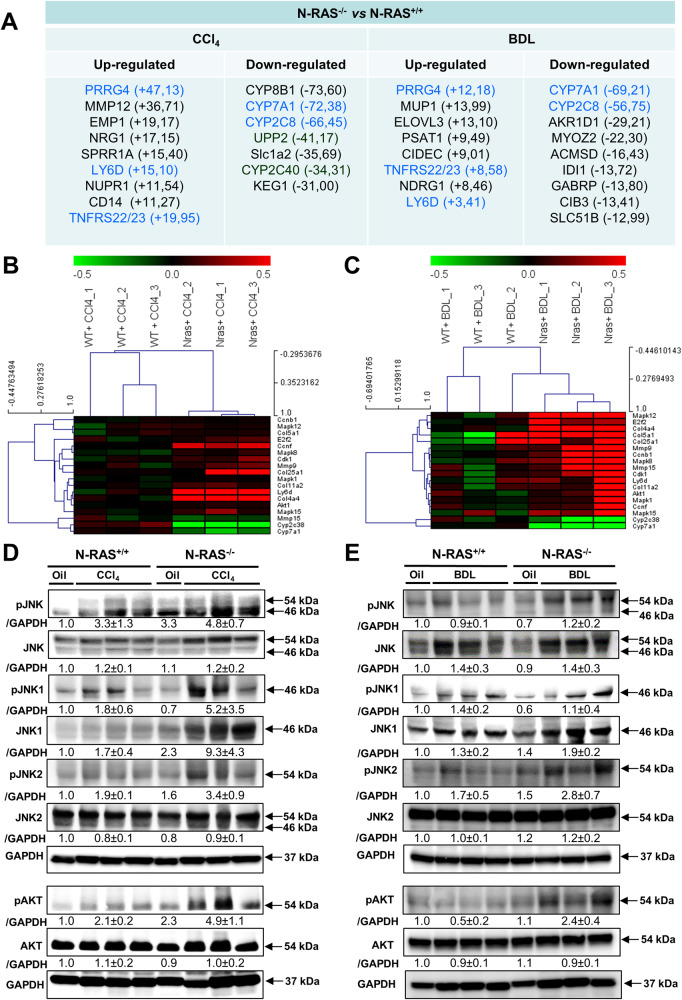
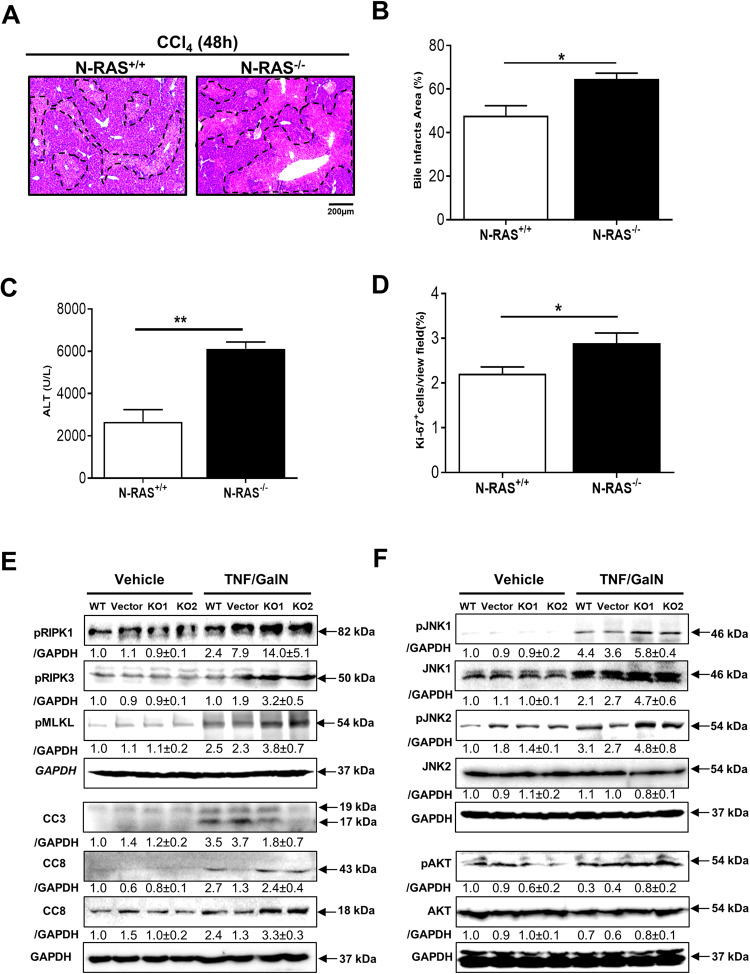
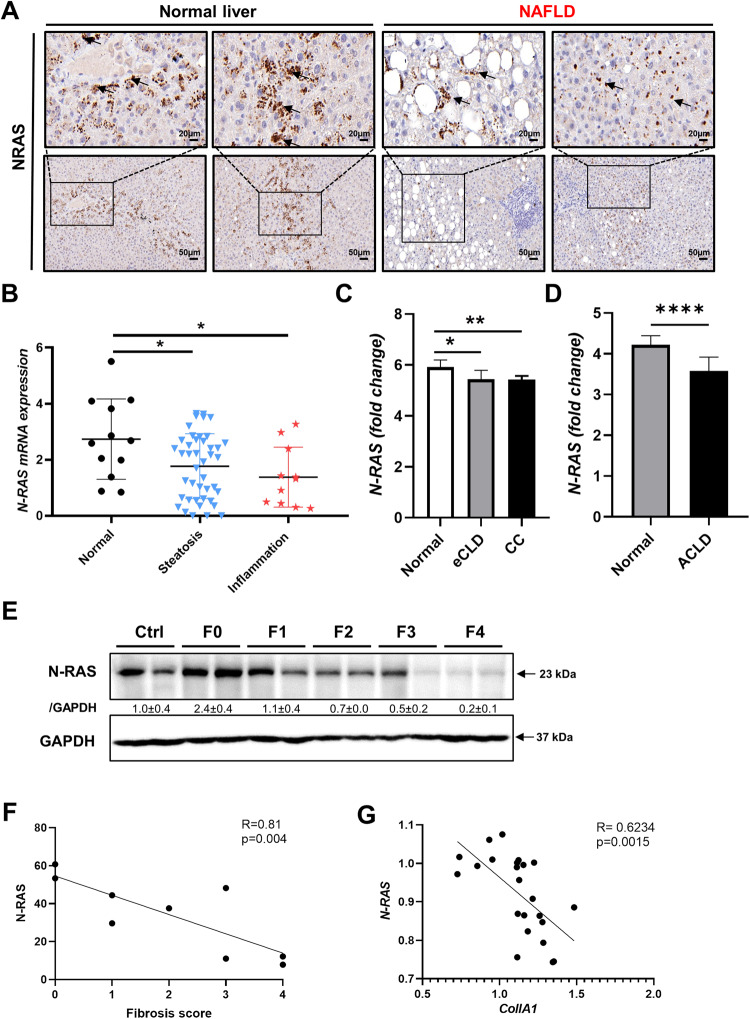
Progressive hepatic damage and fibrosis are major features of chronic liver diseases of different etiology, yet the underlying molecular mechanisms remain to be fully defined. N-RAS, a member of the RAS family of small guanine nucleotide-binding proteins also encompassing the highly homologous H-RAS and K-RAS isoforms, was previously reported to modulate cell death and renal fibrosis; however, its role in liver damage and fibrogenesis remains unknown. Here, we approached this question by using N-RAS deficient (N-RAS-/-) mice and two experimental models of liver injury and fibrosis, namely carbon tetrachloride (CCl4) intoxication and bile duct ligation (BDL). In wild-type (N-RAS+/+) mice both hepatotoxic procedures augmented N-RAS expression in the liver. Compared to N-RAS+/+ counterparts, N-RAS-/- mice subjected to either CCl4 or BDL showed exacerbated liver injury and fibrosis, which was associated with enhanced hepatic stellate cell (HSC) activation and leukocyte infiltration in the damaged liver. At the molecular level, after CCl4 or BDL, N-RAS-/- livers exhibited augmented expression of necroptotic death markers along with JNK1/2 hyperactivation. In line with this, N-RAS ablation in a human hepatocytic cell line resulted in enhanced activation of JNK and necroptosis mediators in response to cell death stimuli. Of note, loss of hepatic N-RAS expression was characteristic of chronic liver disease patients with fibrosis. Collectively, our study unveils a novel role for N-RAS as a negative controller of the progression of liver injury and fibrogenesis, by critically downregulating signaling pathways leading to hepatocyte necroptosis. Furthermore, it suggests that N-RAS may be of potential clinical value as prognostic biomarker of progressive fibrotic liver damage, or as a novel therapeutic target for the treatment of chronic liver disease.


Conflict of interest statement

The authors declare no competing interests.

Figures

Fig. 1
Fig. 1. N-RAS deficiency exacerbates CCl4-induced liver fibrosis and immune cell infiltration.
Representative Sirius red (SR) staining (A) and (B) quantification of SR areas in paraffin sections from N-RAS+/+ and N-RAS−/− livers, after 28 days CCl4 treatment. Immunofluorescence staining for Collagen IA1 (C) and (D) α-SMA (D) was performed in liver cryosections from N-RAS+/+ and N-RAS−/− animals. E Liver extracts were prepared and analyzed by immunoblot using α-SMA. GAPDH was used as housekeeping protein. F Representative hepatic F4/80 immunofluorescence staining from N-RAS+/+ and N-RAS−/− mice, after 28 days CCl4 treatment. Arrows (→) indicate positive cells. Values represent mean ± SEM from 6–8 mice per group (intragroup ****p < 0.0001; intragroup ####p < 0.0001).
Fig. 2
Fig. 2. N-RAS deficiency is associated with aggravated liver injury, cell death, and increased compensatory proliferation after chronic CCl4 challenge.
AC Serum levels of ALT (A), AST (B), and LDH (C) were determined, 28 days after CCl4 treatment. D Representative H&E staining of livers. E Protein analysis by Western Blot of pRIK1/3, pMLKL, CC3, CC8, and F PCNA. GAPDH was used as housekeeping protein. G Immunofluorescence staining for Ki-67 of liver cryosections and positive cell quantification was performed, 28 days after CCl4 treatment. Values represent mean ± SEM (N = 6–8, intragroup, *p < 0.05–***p < 0.001; intergroup #p < 0.05–###p < 0.001). Dotted area indicates necrotic foci.
Fig. 3
Fig. 3. N-RAS deficiency aggravates BDL-induced liver injury and fibrosis.
A Representative Sirius red (SR) staining (A) was performed in paraffin sections of N-RAS+/+ and N-RAS−/− livers, 28 days after CCl4. B Immunofluorescence for Collagen IA was carried out in the cryosections of the same animals. C Liver weight (LW) versus body weight (BW) ratio was calculated and represented. D Representative H&E staining of N-Ras+/+ and N-Ras−/− mice, 28 days after BDL. E Immunoblots were performed using pRIK1/3, pMLKL, CC3, CC8 antibodies. GAPDH was used as housekeeping protein. F Protein expression of α-SMA and PCNA was evaluated by Western blot. GAPDH was used as housekeeping protein. Values represent mean ± SEM from 5–6 mice per group (**p < 0.01; ***p < 0.001; ****p < 0.0001). Dotted areas indicate necrotic foci.
Fig. 4
Fig. 4. N-RAS deficiency alters the profile of gene expression induced by experimental liver injury and causes overactivation of the JNK and AKT pathways.
A Ingenuity Pathway Analysis (IPA) was performed in N-RAS+/+ and N-RAS−/− livers, 28 days both after CCl4 (left column) and BDL (right column). In blue color, common genes in both models are highlighted. Gene array analysis was performed in N-RAS+/+ and N-RAS−/− livers, 28 days after CCl4 (B) or BDL (C). Correlation of the fold induction of genes in hepatocytes and liver is shown. Log2 expression values of the individual mice were divided by the mean of the sham-operated mice. Log ratios were saved in a .txt file and analyzed with the Multiple Experiment Viewer. Top up- and downregulated genes are shown (red: upregulated; green: downregulated, n = 3 for each model of liver fibrosis, 2.0 < FC > −2.0). D, E Immunoblotting for pJNK, JNK, pJNK1, JNK1, pJNK2, JNK2, pAKT, and AKT) was performed in liver extracts of N-RAS+/+ and N-RAS−/− livers, 28 days after CCl4 (D) and BDL (E), respectively. GAPDH was used as loading control.
Fig. 5
Fig. 5. Impact of N-RAS deficiency in acute liver injury in mice and in hepatocytic cells in vitro.
A, B Representative H&E staining of liver sections (A) and quantification of necrotic foci (B) area from N-RAS+/+ and N-RAS−/− mice, after 48 h acute CCl4. Dotted areas denote necrotic foci. C Serum levels of ALT were determined in the same samples. D Immunofluorescence against Ki-67 was performed in N-RAS+/+ and N-RAS−/− mice, after 48 h CCl4 and positive cell quantification was calculated and graphed. E HepG2 cells were knocked-out for N-RAS using CRISPR/Cas9 and treated with TNF/GalN or vehicle for 48 h. Protein expression was studied in cell lysates of untreated (WT), vector or knocked-out cells (KD1, KD2) by Western Blot using antibodies against pRIK1/3, pMLKL, CC3, and CC8. GAPDH was used as a housekeeping protein control. F Immunoblotting for pJNK1, JNK1, pJNK2, JNK2, pAKT, and AKT was performed with the same cell lysates. GAPDH was also used as loading control. Values are represent mean ± SEM from 4 mice per group (*p < 0.05).
Fig. 6
Fig. 6. Loss of N-RAS expression in patients with advanced chronic liver disease (ACLD).
A Immunostaining for N-RAS was tested in paraffin sections of patients with diagnosis of unaffected “normal” liver (left panel) or advanced chronic liver disease ACLD (NAFLD) with presence of steatosis and inflammation (right panel). Microphotographs were taken at 20 (top panel) and 50 µm (bottom panel), respectively. B mRNA expression of N-RAS was assessed in patients diagnosed with unaffected liver, steatosis, or inflammation (cohort#1). C N-RAS gene counts in healthy patients and in patients with early chronic liver disease (eCLD), compensated cirrhosis (CC) was calculated and normalized to the healthy group, and graphed (cohort#2). D N-RAS gene counts in control patients and in patients with ACLD was calculated and graphed (cohort#3). E Immunoblot for N-RAS was performed in fine needle liver biopsies of patients with fibrosis (Vall d’Hebron cohort). GAPDH was used as the loading control. F Spearmen correlation of mean N-RAS with the fibrosis score. G Spearmen correlation of N-RAS with collagen IA1 deposition. Values represent mean ± SEM (*p < 0.5–****p < 0.0001).

References

    1. Takai Y, Sasaki T, Matozaki T. Small GTP-binding proteins. Physiol Rev. 2001;81:153–208. doi: 10.1152/physrev.2001.81.1.153. - DOI - PubMed
    1. Hancock JF. Ras proteins: different signals from different locations. Nat Rev Mol Cell Biol. 2003;4:373–84. doi: 10.1038/nrm1105. - DOI - PubMed
    1. Castellano E, Santos E. Functional specificity of ras isoforms: so similar but so different. Genes Cancer. 2011;2:216–31. doi: 10.1177/1947601911408081. - DOI - PMC - PubMed
    1. Castellano E, De Las Rivas J, Guerrero C, Santos E. Transcriptional networks of knockout cell lines identify functional specificities of H-Ras and N-Ras: significant involvement of N-Ras in biotic and defense responses. Oncogene. 2007;26:917–33. doi: 10.1038/sj.onc.1209845. - DOI - PubMed
    1. Parola M, Pinzani M. Liver fibrosis: Pathophysiology, pathogenetic targets and clinical issues. Mol Asp Med. 2019;65:37–55. doi: 10.1016/j.mam.2018.09.002. - DOI - PubMed

Publication types