. 2023 Sep;3(9):1144-1166.
doi: 10.1038/s43587-023-00462-6. Epub 2023 Aug 10.

Universal DNA methylation age across mammalian tissues

A T Lu #  1   2 Z Fei #  3   4 A Haghani  1   2 T R Robeck  5 J A Zoller  3 C Z Li  3 R Lowe  6 Q Yan  2 J Zhang  1 H Vu  7   8 J Ablaeva  9 V A Acosta-Rodriguez  10 D M Adams  11 J Almunia  12 A Aloysius  13 R Ardehali  14 A Arneson  7   8 C S Baker  15 G Banks  16 K Belov  17 N C Bennett  18 P Black  19 D T Blumstein  20   21 E K Bors  15 C E Breeze  22 R T Brooke  23 J L Brown  24 G G Carter  25 A Caulton  26   27 J M Cavin  28 L Chakrabarti  29 I Chatzistamou  30 H Chen  31 K Cheng  32 P Chiavellini  33 O W Choi  34 S M Clarke  26 L N Cooper  35 M L Cossette  36 J Day  37 J DeYoung  34 S DiRocco  38 C Dold  39 E E Ehmke  40 C K Emmons  41 S Emmrich  42 E Erbay  43 C Erlacher-Reid  38   44 C G Faulkes  45 S H Ferguson  46   47 C J Finno  48 J E Flower  49 J M Gaillard  50 E Garde  51 L Gerber  52 V N Gladyshev  53 V Gorbunova  42 R G Goya  33 M J Grant  54 C B Green  10 E N Hales  48 M B Hanson  41 D W Hart  18 M Haulena  55 K Herrick  56 A N Hogan  57 C J Hogg  17 T A Hore  58 T Huang  59   60 J C Izpisua Belmonte  2 A J Jasinska  34 G Jones  61 E Jourdain  62 O Kashpur  63 H Katcher  64 E Katsumata  65 V Kaza  66 H Kiaris  66   67 M S Kobor  68 P Kordowitzki  69   70 W R Koski  71 M Krützen  72 S B Kwon  7   8 B Larison  73   74 S G Lee  53 M Lehmann  33 J F Lemaitre  50 A J Levine  75 C Li  76   77 X Li  78 A R Lim  1 D T S Lin  79 D M Lindemann  38 T J Little  80 N Macoretta  42 D Maddox  81 C O Matkin  82 J A Mattison  83 M McClure  84 J Mergl  85 J J Meudt  86 G A Montano  39 K Mozhui  87   88 J Munshi-South  89 A Naderi  67 M Nagy  90 P Narayan  54 P W Nathanielsz  76   77 N B Nguyen  14 C Niehrs  91   92 J K O'Brien  37 P O'Tierney Ginn  63   93 D T Odom  94   95 A G Ophir  96 S Osborn  97 E A Ostrander  57 K M Parsons  41 K C Paul  75 M Pellegrini  98 K J Peters  72   99 A B Pedersen  100 J L Petersen  101 D W Pietersen  102 G M Pinho  73 J Plassais  57 J R Poganik  53 N A Prado  103 P Reddy  2   104 B Rey  50 B R Ritz  105   106   107 J Robbins  108 M Rodriguez  109 J Russell  56 E Rydkina  42 L L Sailer  96 A B Salmon  110 A Sanghavi  64 K M Schachtschneider  111   112   113 D Schmitt  114 T Schmitt  56 L Schomacher  91 L B Schook  111   115 K E Sears  73   98 A W Seifert  13 A Seluanov  42 A B A Shafer  116 D Shanmuganayagam  86   117 A V Shindyapina  53 M Simmons  40 K Singh  118 I Sinha  73 J Slone  59 R G Snell  54 E Soltanmaohammadi  67 M L Spangler  101 M C Spriggs  19 L Staggs  38 N Stedman  19 K J Steinman  119 D T Stewart  120 V J Sugrue  58 B Szladovits  121 J S Takahashi  10   122 M Takasugi  42 E C Teeling  123 M J Thompson  98 B Van Bonn  124 S C Vernes  125   126 D Villar  127 H V Vinters  128 M C Wallingford  63   129 N Wang  130   131 R K Wayne  73 G S Wilkinson  11 C K Williams  75 R W Williams  88 X W Yang  130   131 M Yao  3 B G Young  132 B Zhang  53 Z Zhang  42 P Zhao  14   133 Y Zhao  42 W Zhou  134   135 J Zimmermann  136 J Ernst  7   8 K Raj #  6 S Horvath #  137   138   139
Affiliations

Universal DNA methylation age across mammalian tissues

A T Lu et al. Nat Aging. 2023 Sep.

Erratum in

  • Author Correction: Universal DNA methylation age across mammalian tissues.
    Lu AT, Fei Z, Haghani A, Robeck TR, Zoller JA, Li CZ, Lowe R, Yan Q, Zhang J, Vu H, Ablaeva J, Acosta-Rodriguez VA, Adams DM, Almunia J, Aloysius A, Ardehali R, Arneson A, Baker CS, Banks G, Belov K, Bennett NC, Black P, Blumstein DT, Bors EK, Breeze CE, Brooke RT, Brown JL, Carter GG, Caulton A, Cavin JM, Chakrabarti L, Chatzistamou I, Chen H, Cheng K, Chiavellini P, Choi OW, Clarke SM, Cooper LN, Cossette ML, Day J, DeYoung J, DiRocco S, Dold C, Ehmke EE, Emmons CK, Emmrich S, Erbay E, Erlacher-Reid C, Faulkes CG, Ferguson SH, Finno CJ, Flower JE, Gaillard JM, Garde E, Gerber L, Gladyshev VN, Gorbunova V, Goya RG, Grant MJ, Green CB, Hales EN, Hanson MB, Hart DW, Haulena M, Herrick K, Hogan AN, Hogg CJ, Hore TA, Huang T, Izpisua Belmonte JC, Jasinska AJ, Jones G, Jourdain E, Kashpur O, Katcher H, Katsumata E, Kaza V, Kiaris H, Kobor MS, Kordowitzki P, Koski WR, Krützen M, Kwon SB, Larison B, Lee SG, Lehmann M, Lemaitre JF, Levine AJ, Li C, Li X, Lim AR, Lin DTS, Lindemann DM, Little TJ, Macoretta N, Maddox D, Matkin CO, Mattison JA, McClure M, Mergl J, Meudt JJ, Montano GA, Mozhui K, Munshi-South J, Naderi A, Nagy M, Narayan P, Nathanielsz PW, Nguyen NB, Niehrs C, O'Brien JK, O'… See abstract for full author list ➔ Lu AT, et al. Nat Aging. 2023 Nov;3(11):1462. doi: 10.1038/s43587-023-00499-7. Nat Aging. 2023. PMID: 37674040 Free PMC article. No abstract available.

Abstract

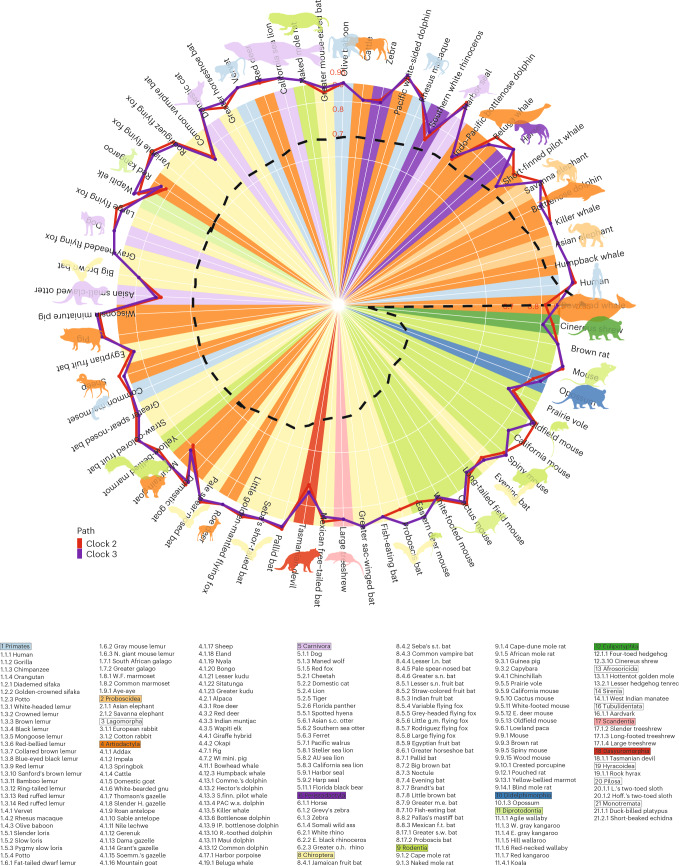
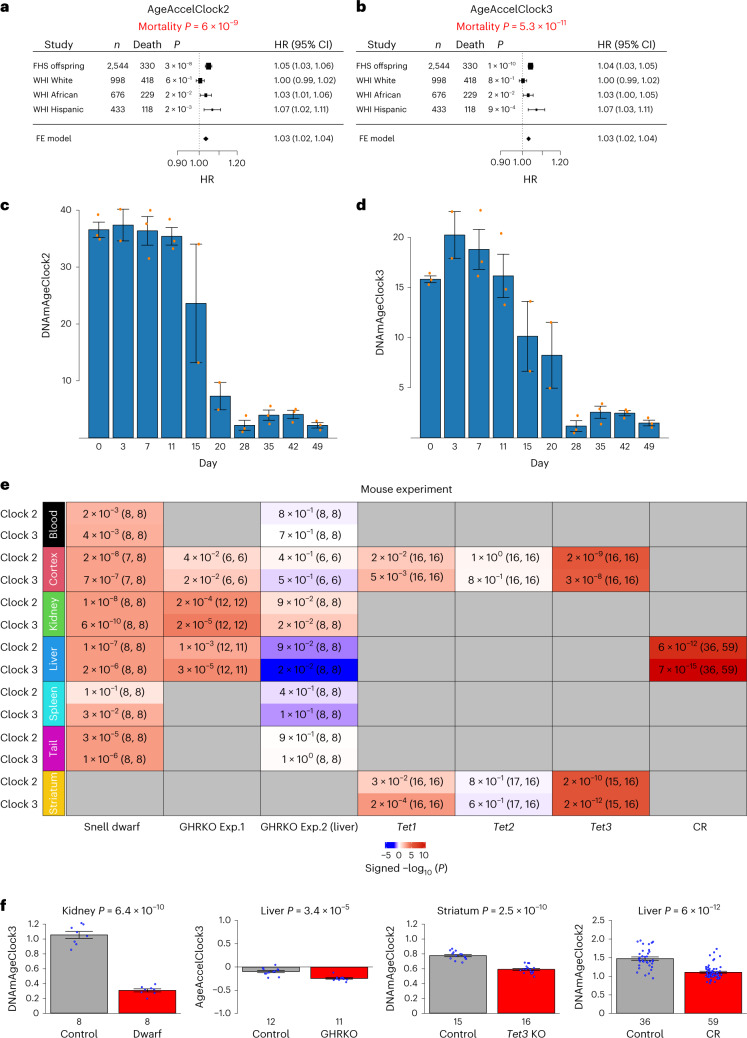
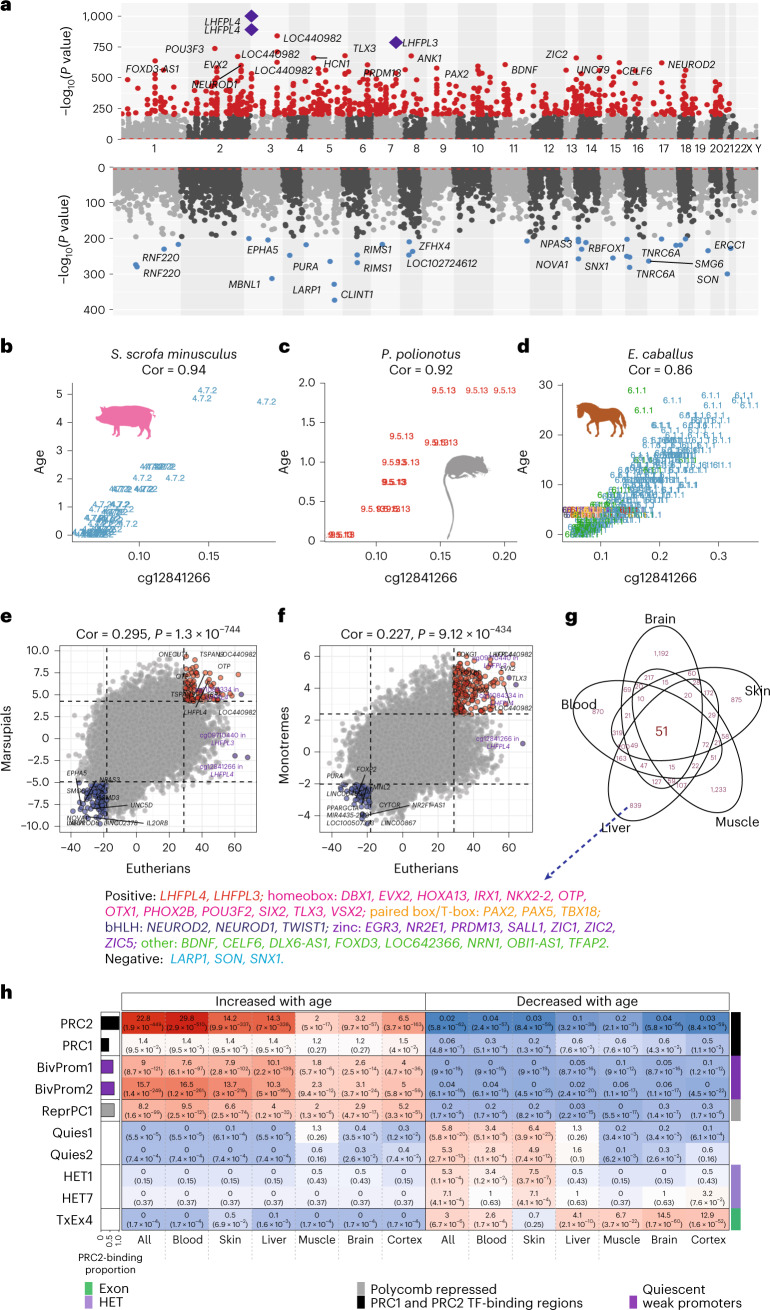
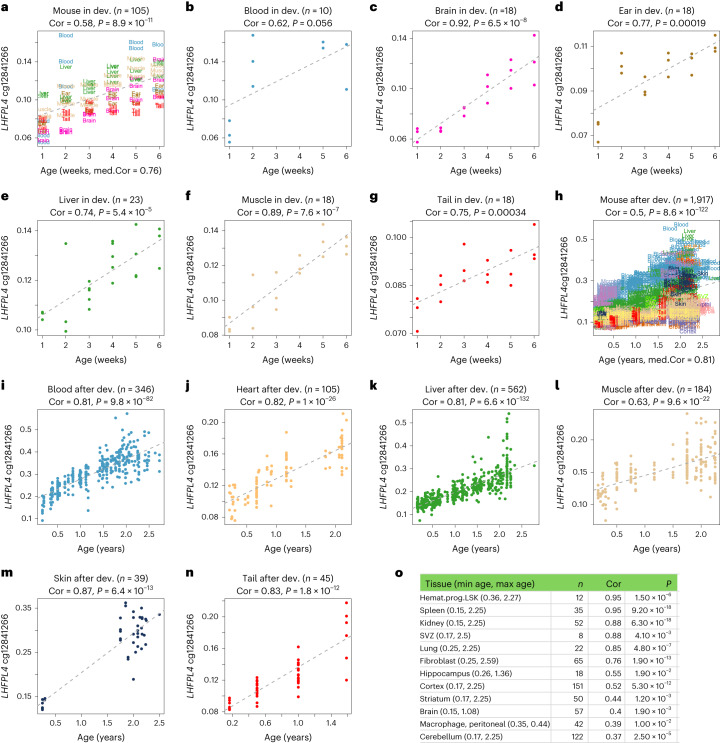
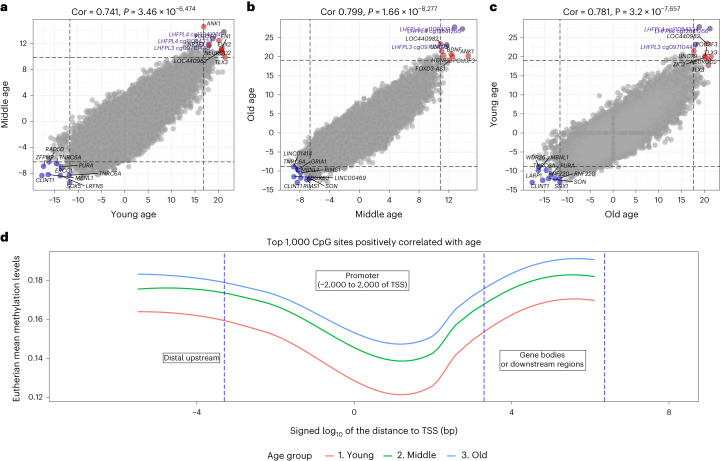
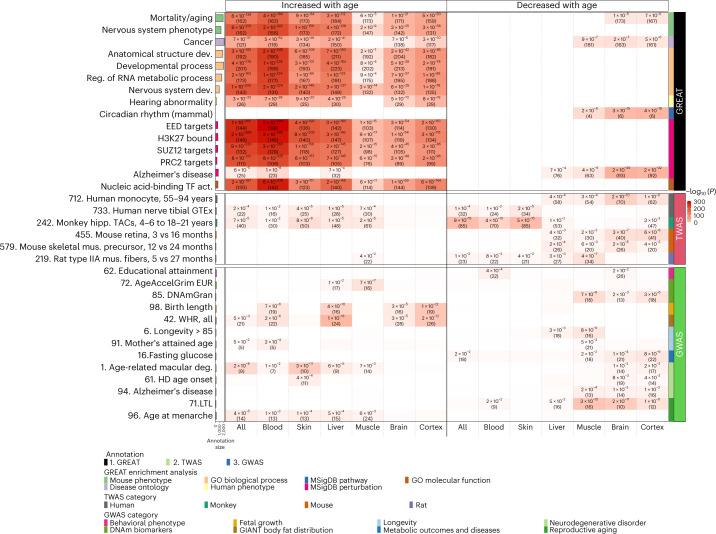
Aging, often considered a result of random cellular damage, can be accurately estimated using DNA methylation profiles, the foundation of pan-tissue epigenetic clocks. Here, we demonstrate the development of universal pan-mammalian clocks, using 11,754 methylation arrays from our Mammalian Methylation Consortium, which encompass 59 tissue types across 185 mammalian species. These predictive models estimate mammalian tissue age with high accuracy (r > 0.96). Age deviations correlate with human mortality risk, mouse somatotropic axis mutations and caloric restriction. We identified specific cytosines with methylation levels that change with age across numerous species. These sites, highly enriched in polycomb repressive complex 2-binding locations, are near genes implicated in mammalian development, cancer, obesity and longevity. Our findings offer new evidence suggesting that aging is evolutionarily conserved and intertwined with developmental processes across all mammals.


Conflict of interest statement

The Regents of the University of California filed a patent application (publication number WO2020150705) related to this work on which S.H., A. Arneson and J.E. are named inventors. S.H. and R.T.B. are founders of the non-profit Epigenetic Clock Development Foundation, which has licensed several patents from UC Regents, and distributes the mammalian methylation array. The remaining authors declare no competing interests.

Figures

Fig. 1
Fig. 1. Universal clocks for transformed age across mammals.
The figure displays relative age estimates of universal clock 2 (clock 2) and log–linear-transformed age of universal clock 3 (clock 3). Relative age estimates incorporate maximum lifespan and assume values between 0 and 1. Log–linear age is formulated with ASM and gestational time. ai, Age estimated by LOFO cross-validation for clock 2 and clock 3. jl, Age estimated via LOSO cross-validation for clock 2. The DNAm estimates of age (y axes) of ac are transformations of relative age (clock 2) or log–linear age (clock 3) into units of years. b,e, Only marsupials (nine species). Each panel reports a Pearson correlation (Cor) coefficient. The gray and black dashed lines correspond to the diagonal line (y=x) and the regression line, respectively. Median correlation (med.Cor) and median of MAE (med.MAE) are calculated across species (af) or across species–tissue (gl). All correlation P values are highly significant (P < 1.0 × 10−22). Each sample is labeled by mammalian species index and indicated by tissue color (Supplementary Data 1.3–1.4). All P values reported are unadjusted and two sided.
Fig. 2
Fig. 2. Accuracy of universal clocks are independent of species lifespan.
The circle plot displays Pearson correlation between age and DNAmAge estimated by universal clocks 2 (clock 2) and 3 (clock 3) for various species. Of the 185 species, correlation analysis was performed on 69 species (with n ≥ 15 in a single tissue) across 12 taxonomic orders. We took log transformation of maximum lifespans of species and divided them by log (211), which is the maximum lifespan of bowhead whales. Values of the resulting ratios ranged from 0.12 (cinereus shrew) to 1 (bowhead whales). These ratios are displayed in descending order in the circle plot marked by the black dashed line, starting with the bowhead whale (1) and human (0.90) and ending with the cinereus shrew (0.12), in counterclockwise direction. In the background, circumferences with increasing radii represent increasing correlation levels up to 0.9. These correlations between age and DNAmAge were estimated by clock 2 (red path line) and clock 3 (purple path line) for each species. Colors within the circle represent the taxonomic order of the corresponding species, as listed below the circle. The median of correlation across species is 0.926 for clock 2 and 0.918 for clock 3. Straw-colored fruit bats exhibit the highest correlation (r = 0.985) based on clock 2, and Wisconsin miniature pigs have the second highest correlation (r = 0.984) based on clock 3. A majority of species with their circle lines located outside the background indicates that their correlation estimates are greater than 0.9. The text at the bottom lists the 185 species under their corresponding taxonomic order. Each taxonomic order is marked by the same color matching with the circle plot. The numbers after the first and second decimal points enumerate the taxonomic family and species, respectively. AU, Australian; Comme., Commerson’s; E., eastern; f.t., free-tailed; g.m., golden-mantled; H. (gazelle), Horn gazelle; Hoff., Hoffman’s; IP, Indo-Pacific; L.’s, Linne’s; l.n., long-nosed; m.e., mouse-eared; mini., miniature; N., northern; o.h., one horned; s.c., small-clawed; PAC w.s., Pacific white-sided; R.-toothed, Rough-toothed; Soemm., Soemmerring’s; S.finn., Short-finned; s.n., short nosed; s.t., short-tailed; s.w., sac-winged; W. western; W.F., White-fronted; WI mini., Wisconsin miniature.
Fig. 3
Fig. 3. Applications of universal pan-mammalian clocks in human cohorts, reprogramming experiment and murine anti-aging studies.
a,b, Forest plots representing the fixed effect (FE) model meta-analysis, combining HRs from Cox regression models for time to death, based on epigenetic age acceleration measures of clock 2 (AgeAccelClock2) and clock 3 (AgeAccelClock3) across different ethnic groups within two epidemiological cohorts. Each row indicates an HR for a 1-year increase in the age acceleration (AgeAccel) measure, along with a 95% confidence interval (CI). c,d, DNAmAge estimates of human dermal fibroblasts during OSKM-induced reprogramming. The y axes are DNAmAge estimates of clock 2 and clock 3 at day 0, 3, …, 42 and 49, respectively, during reprogramming. e, Evaluations of mouse anti-age interventions: (1) age-matched Snell dwarf mutation study: 48 normal and 47 dwarf mice with ages of approximately 0.52 (mean ± s.d. = 0.52 ± 0.01) years, (2) age-matched whole-body GHRKO experiment 1 (Exp.1) with 36 normal and 35 GHRKO mice (mean ± s.d. = 0.65 ± 0.06 years), (3) age-matched GHRKO experiment 2 with GHRKO in livers only with 48 normal and 48 GHRKO genotypes (mean ± s.d. = 0.51 ± 0.03 years old), (4) Tet gene-KO study with all samples at age 0.5 years (Tet1, 32 controls and 32 Tet1 KO; Tet2, 33 controls and 32 Tet2 KO; Tet3, 31 controls and 32 Tet3 KO) and (5) CR study in livers (59 in CR versus 36 control mice with all ages at 1.57 years old). Comparisons in experiments 2 and 3 were based on AgeAccel measures. The color gradient is based on the sign of t-test for controls versus experimental mice, with a positive sign indicating that the mice in the control group exhibit higher age acceleration than the mice in the experimental group. f, Bar plots for selective tissue types and clocks across Snell dwarf mice (eight normal and eight dwarf mice) GHRKO experiment 1 (12 normal and 11 GHRKO mice), Tet3-KO mice (15 normal and 16 Tet3-KO mice) and the entire CR experiment, respectively. The orange dots in c and d and the blue dots in e correspond to individual observations. The y axes of the bar plots depict the mean of one standard error. All P values reported are two sided and are unadjusted for multiple testing.
Fig. 4
Fig. 4. Meta-analysis of methylation change in function of chronological age across species and tissues.
ad,g,h, Eutherian EWAS of age. a, Meta-analysis −log10 (P values) for age-related CpG sites (annotated by proximal genes) on chromosomes (x axis in hg38). Top and bottom, CpG sites that gain or lose methylation with age, respectively. CpG sites in red and blue denote highly significant positive and negative age correlation (P < 10−200), respectively. The most significant CpG (cg12841266, P = 1.41 × 10−1,001) resides in exon 2 on the LHFPL4 gene in humans and most mammals, followed by cg11084334 (P = 2.59 × 10−891). These two CpG sites and cg097720 (P = 4.97 × 10−787) located in the paralog gene LHFPL3 are marked with purple diamonds. bd, Scatterplots of cg12841266 versus chronological age (years) in mini pigs (Sus scrofa minusculus) (b), Oldfield mice (Peromyscus polionotus) (c) and horses (Equus caballus) (d). Tissue samples are labeled by the mammalian species index and colored by tissue type as detailed in Supplementary Data 1.1–1.4. e,f, Correlation analysis between Z scores of EWAS of age in eutherians versus marsupials (e) and eutherians versus monotremes (f). g,h, Annotations of the top 1,000 CpG sites with increased or decreased methylation with age that were identified in EWAS meta-analysis across all species and tissues (results in a) (brain, cortex, blood, liver, muscle and skin tissues). g, The overlap of age-associated CpG sites across various organs, based on the top 1,000 CpG sites showing positive or negative age correlation in EWAS. The Venn diagram includes 51 age-associated CpG sites shared across all organs, adjacent to 38 genes (35 with positive and three with negative age correlation) categorized by protein family. The 35 positive genes are color coded based on their protein family: two in LHFPL, 12 in homeobox, three in paired box or T-box, three in bHLH, seven in zinc finger and eight in others. h, Selected universal chromatin state and polycomb group protein enrichment results. ORs (P values) are presented in each cell. The color gradient is based on −log10 (hypergeometric P value) times sign of OR > 1. The complete results are listed in Extended Data Fig. 7. State annotation can be found in Supplementary Data 8.2. HET denotes heterochromatin. Except for the hypergeometric analysis in h, all figure P values are unadjusted and two sided.
Fig. 5
Fig. 5. Methylation levels of cg12841266 (LHFPL4) versus chronological age in mouse tissues.
Results are reported for different tissues and age groups. ag, Postnatal development (dev.) (from 1 week to 6 weeks). ho, Age effects in adult mice. Mean ± s.d. of chronological age is 3.5 ± 1.7 (1.0–6.0) weeks in the developmental age group and 1.12 ± 0.72 (0.15–2.78) years in the post-developmental group. a,h, All tissues combined. Each dot (sample) is colored by the tissue type. o, Pearson correlations between the CpG site and age in additional mouse tissues and cell types from the Mammalian Methylation Consortium. Hemato.prog.LSK, hematopoietic progenitor cells with lineageSca-1+c-Kit+ phenotype; max, maximum; min, minimum; n, sample size; SVZ, subventricular zone. Pearson correlation coefficients and nominal (unadjusted) two-sided correlation test P values are shown.
Fig. 6
Fig. 6. EWAS of age in three different age groups.
For each species, the age groups were defined with respect to the average ASM obtained from the Animal Aging and Longevity Database (AnAge) (de Magalhaes et al.). We defined the three age groups using intervals defined by multiples of ASM: young age is defined as age <1.5 × ASM, middle age is defined as age between 1.5ASM and 3.5ASM, and old age is defined by age ≥3.5ASM. Each axis reports a Z score from the meta-analysis EWAS of age across all mammalian species and tissues. Each dot corresponds to a CpG site. Labels are provided for the top ten hypermethylated or hypomethylated CpG sites according to the product of Z scores in x and y axes. CpG sites that are located in LHFPL4 and LHFPL3 are colored in purple. The Pearson correlation coefficient and corresponding nominal (unadjusted) two-sided correlation test P value can be found in the title. a, EWAS of age in young animals versus EWAS in middle-aged animals. b, EWAS of age in middle-aged animals versus EWAS in old animals. c, EWAS of age in young animals versus EWAS of age in old animals. The high pairwise correlations indicate that conserved aging effects in mammals are largely preserved in different age groups. Many of the top CpG sites for conserved aging effects in young mammals remain the top CpG sites for conserved aging effects in old mammals. Specifically, we analyzed the mean methylation levels in eutherians across the three age groups. d, Mean methylation (y axis) across the top 1,000 CpG sites positively correlated with age according to the EWAS across all mammalian tissue types (Fig. 4a). The x axis denotes the distance to the closest TSS in a log10 scale of bp. The positive TSS indicates the direction from 5′ to 3′, and the negative TSS indicates from the direction from 3′ to 5′. The horizontal phase is categorized into three regions: distal upstream → promoter → gene bodies. The mean methylation levels are bounded by 0.2, reflecting that fact that CpG sites beginning with lower methylation levels have higher propensity to increase with age.
Fig. 7
Fig. 7. Biological pathways and functional gene sets enriched in age-related CpG sites.
Selected results from (1) genomic region-based GREAT functional enrichment (top), (2) gene-based EWAS–TWAS enrichment analysis (middle) and (3) genomic region-based EWAS–GWAS enrichment analysis (bottom). All enrichment analyses were based on hypergeometric tests with background based on the mammalian array. The bar plots in the first column report the total number of genes at each studied gene set adjusted based on the background. The left and right parts of the x axis list the top 1,000 CpG sites that increased or decreased with age from meta-EWAS of age across all blood, skin, liver, muscle, brain and cerebral cortex tissues, respectively. On the right side, the first column color band depicts the three types of enrichment analyses. The second column color band depicts (1) six ontologies in the GREAT analysis, (2) four species in our TWAS collections and (3) seven categories of human complex traits in the GWAS as described in the legend. The heatmap color codes −log10 (hypergeometric P values). Unadjusted hypergeometric P values (number of overlapped genes) are reported in the heatmap provided (1) false discovery rate < 0.05, P < 0.001 and the number of overlapped genes ≥3 for GREAT analysis, (2) P < 0.05 for EWAS–TWAS and (3) P < 0.05 for EWAS–GWAS. Comprehensive results can be found in Supplementary Data 10, 12 and 13. Abbreviations: act., activity; deg., degeneration; AgeAccelGrim, epigenetic age acceleration derived from the mortality clock: GrimAge; DNAmGran, DNAm granulocyte (Supplementary Note 5); GIANT, Genetic Investigation of ANthropometric Traits; GTEx, Genotype–Tissue Expression; HD, Huntington’s disease; hipp., hippocampal; LTL, leukocyte telomere length; MSigDB, Molecular Signatures Database; mus., muscle; OPCs, oligodendrocyte precursor cells; reg., regulation; TACs, transiently amplifying progenitor cells; WHR, waist-to-hip ratio.
Fig. 8
Fig. 8. scATAC-seq analysis in human bone marrow and mouse HSCs.
ai, Results using human BMNCs. j, Murine HSCs. a, scATAC-seq results for 17 of the 35 genes (listed in Supplementary Table 3) that show a called ATAC peak in the region overlapping with our top CpG sites with positive age correlation. The y axis lists the gene symbol. The x axis reports the Pearson correlation between chronological age and the percentage of cells with an scATAC-seq signal overlapping the respective CpG site (labeled by the adjacent gene). The genes are ordered by correlation estimate (from the most negative). A negative correlation estimate indicates that the accessibility of the CpG site decreases with chronological age. Each dot presents a gene. Seven genes with P < 0.05 are marked with a solid shape. b, scATAC-seq analysis results for LHFPL4. The y axis depicts chronological age, and the x axis shows the percentage of cells with an scATAC-seq signal. c, Percentage of cells identified containing scATAC-seq signal in one of the seven significantly associated genes averaged across all samples. Cells are split into the called identities using the scRNA-seq measurement including HSCs, the various progenitors and differentiated cells. DC, dendritic cell; mono, monocyte; MK/E prog, megakaryocyte-erythroid progenitor; G/M prog, granulocyte-monocyte progenitor; NK, natural killer; prog, progenitor; RBC, red blood cell. df, The percentage of these three cell populations (HSC (d), progenitor (e) and differentiated cell type (f)) that contain at least one ATAC-seq signal in any of the seven significant genes, plotted against the age of each individual (y axis). gi, The percentage of these three cell populations per individual (HSC (g), progenitor (h) and differentiated cell type (i)), plotted against the age of each individual. j, The percentage of cells with called ATAC peaks overlapping with our mammalian CpG sites in young mouse (10-week) versus old mouse (20-month) HSCs. The red dots denote 33 of the top 35 positively age-related CpG sites (listed in Supplementary Table 3) that map to the mouse genome. The red dashed line corresponds to the diagonal line (y=x). All P values reported are unadjusted and two sided.
Extended Data Fig. 1
Extended Data Fig. 1. Transformed age in universal clocks.
The plot displays transformed age in universal Clock 2 (ac) and universal Clock 3 (df). (a, b) Loglog transformation of Relative Age (y-axis) versus age in universal Clock 2 and (d, e) log-linear age (y-axis) versus age in our universal Clock 3. Of the 969 mammalian species with available gestation time, age at sexual maturity and maximum lifespan in AnAge database, 339 species are available in our collection. We multiplied the reported maximum lifespan of non-human or non-mouse species by 1.3. Transformed ages were calculated for all the 969 species with simulated age ranging from gestation time through the modified maximum lifespan. The columns (a, d) display all the 969 species with the simulated ages. In panel d, we proposed the log-linear age with the parameter m formulated with maximum lifespan as the information is available for all species (m*=c1*MaxLifespan+GestationTASM+GestationT in Methods). Of the 339 species, 185 species with age information of high confidence and known tissue types were used in training universal clocks. The columns (b, e) empirically display these 185 species with the age variable (x-axis) based on the observed ages from all the samples in our collection (N = 11,754). In panel e, we applied the log-linear age formulated without knowing maximum lifespan to train Clock 3 (formula (5) in Methods). Each line represents a species marked by gray for non-profiled and marked by black or pink for profiled species in our collection, as listed in the legend. Some species such as lemurs with relatively short gestation time in regressing m* (formula (7) in Methods) exhibiting high log-linear ages in (e) are marked in pink. Each panel reports the Pearson correlation coefficient. (c, f) display the histograms of transformed ages based on all samples from the 185 species with vertical lines presenting at means.
Extended Data Fig. 2
Extended Data Fig. 2. Basic universal clock for log-transformed age.
a, b, Chronological age (x-axis) versus DNAmAge estimated using a, leave-one-fraction-out (LOFO) and b, leave-one-species-out (LOSO) analysis. The gray and black dashed lines correspond to the diagonal line (y = x) and the regression line, respectively. Each sample is labeled by the mammalian species index (legend). The species index corresponds to the taxonomic order, for example 1 = primates, 2 = elephants (Proboscidea) etc. (legend). The numbers after the first and second decimal points enumerate the taxonomic family and species, respectively. Points are colored by tissue type (Supplementary Data 1.4). The heading of each panel reports the Pearson correlation (cor) across all samples. Here med.Cor denotes the median value across species that contain at least 15 samples. cf, The y-axis reports the mean difference between the LOSO estimate of DNAm age and chronological age evaluated at a fixed age defined as half the maximum lifespan (denoted as Mean Delta.Age). The scatter plots depict mean delta half lifespan per species (y-axis) versus c, maximum lifespan observed in the species, d, average age at sexual maturity e, gestational time (in units of years), and f, (log-transformed) average adult body mass in units of grams. All P-values reported are unadjusted and are based on two-sided tests.
Extended Data Fig. 3
Extended Data Fig. 3. Universal clocks applied to species with fewer than 15 samples.
The title of each panel lists the type of universal clock: a, Clock 1 = basic universal clock based on log(Age + 2), b, d, Clock 2 = universal clock for relative age, c, Clock 3 =universal clock for log-linear age. Leave-one-fraction-out (LOFO) methylation estimates versus a–c, chronological age or d, relative age for clock 2. The respective inverse transformations were applied to arrive at DNA methylation-based estimates of chronological age in years or relative age (y-axis).
Extended Data Fig. 4
Extended Data Fig. 4. Universal clocks for specific tissues (blood, skin).
These tissue-specific universal clocks were constructed in an analogous fashion to the pan-tissue clocks described in the main text. The panels show leave-one-fraction-out (LOFO) estimates (y-axis) of four clocks: universal blood clock 2 (Universal BloodClock 2) which estimates relative age, universal blood clock 3 (Universal BloodClock 3) which estimates log-linear transformation of age. Analogously, we defined Universal SkinClock2 and Universal SkinClock3. Relative age estimation incorporates maximum lifespan and gestational age and assumes values between 0 and 1. Log-linear age is formulated with age at sexual maturity and gestational time. a, c, e, g, LOFO estimates of DNAm age (y-axis, in units of years) based on transforming relative age (Clock 2) or log-linear age (Clock 3). b, f, d, h, transformed age (x-axis) versus corresponding DNAm estimates (y-axis). The title of each panel reports the Pearson correlation coefficient across all data points and the median correlation (med.Cor) and median of median absolute error (med.MAE) across all species. Each sample is labeled by mammalian species index (explained in Fig. 2) and colored by taxonomic order. The legend reports the taxonomic order and the mammalian order index as a prefix.
Extended Data Fig. 5
Extended Data Fig. 5. Universal clock for relative age applied to specific tissues.
ap, DNA methylation-based estimates of relative age (y-axis) versus actual relative age (x-axis). The specific tissue or cell type is reported in the title of each panel. Each sample is labeled by mammalian species index and colored by tissue type (Supplementary Data 1.3–1.4). The analysis is restricted to tissues that have at least 15 samples available. Leave-one-fraction-out cross-validation (LOFO) was used to arrive at unbiased estimates of predictive accuracy measures: median absolute error (MAE) and age correlation based on relative age. ‘Cor’ denotes the Pearson correlation coefficient based on all available samples. ‘med.Cor’ denotes the median values across all species for which at least 15 samples were available. Title is marked in blue if a tissue type was collected from a single species.
Extended Data Fig. 6
Extended Data Fig. 6. Meta-analysis of chronological age in mammalian samples across specific tissue types.
Meta-analysis p-value (-log base 10 transformed) versus chromosomal location (x-axis) according to human genome assembly 38 (hg38) in (a), brain tissues (across multiple brain regions), (b) cerebral cortex, (c) blood, (d) liver, (e) muscle and (f) skin tissues. The upper and lower panels of the Manhattan plot depict the CpG sites that gain/lose methylation with age. In panel a, P values were calculated via two-stage meta-analysis that combined EWAS results across strata formed by species/brain-tissue (with n ≥ 15 samples, Methods). CpGs are colored in red and blue if they exhibit highly significant positive and negative age correlations according to a meta analysis P < 1.0 × 10−40, 1.0 × 10−30, 1.0 × 10−250, 1.0 × 10−50, 1.0 × 10−20 and 1.0 × 10−150 for a–f, respectively. Red dashed horizontal lines denote Bonferroni correction. Gene names are annotated for the top 20 CpGs with positive and negative associations, respectively. CpGs are labeled by adjacent genes. Purple color and diamond shapes mark CpGs of particular interest: cg12841266 and cg11084334 in LHFPL4 and cg09710440 in LHFPL3. All P-values presented in this figure are unadjusted and computed using two-sided tests.
Extended Data Fig. 7
Extended Data Fig. 7. Chromatin state analysis of age-related CpGs.
The heatmap color-codes the hypergeometric overlap analysis between age-related CpGs (columns) and two groupings of CpGs (1) universal chromatin states analysis and (2) binding by polycomb repressive complex 1 and 2 (PRC1, PRC2) defined based on ChIP-Seq datasets in ENCODE, see the last two rows. The first column shows a bar plot that reports the proportion of CpGs that are known to be bounded by PRC2 that ranges from zero to one (PRC2). Note that chromatin states that contain a high proportion of PRC2 bound CpGs overlap significantly with the top 1,000 CpGs that increased with age across tissues and mammal species. For each row (chromatin state or PRC annotation), the table reports odds ratios (OR) from hypergeometric test results for the top 1,000 CpGs that increased/decreased with age from meta-EWAS of age across all, blood, skin, liver, muscle, brain and cerebral cortex tissues, respectively. Unadjusted hypergeometric P values based on one-sided are listed in Supplementary Data 8.3–8.9. The heatmap color gradient is based on −log10 (unadjusted hypergeometric P value) multiplied by the sign of OR greater than one. Red colors denote OR greater than one in contrast with blue colors for OR less than one. Legend lists states based on their group category and PRC group. The y-axis lists state or PRC name and number of mammalian array CpGs inside parentheses. The left/right panel lists the results based on the top 1,000 CpGs with positive/negative age correlation. We displayed 63 universal chromatin states that show significant enrichment/depletion at P < 0.001 in any of the tissues. HET, heterochromatin; exon, transcription and exons; weak promoters, bivalent promoters; promoters, promoter flanking.
Extended Data Fig. 8
Extended Data Fig. 8. Overlap with late-replicating domains.
The heatmap color-codes the hypergeometric overlap analysis between age-related CpGs (columns) and CpGs related to late-replicating domains in hg19 and mm10 assembly, respectively. Two groups of late-replicating domains were analyzed (1) common PMD/HMD structures: highly methylated domains (commonHMD), partially methylated domains (commonPMD), and neither (Neither), and (2) solo-WCGW structures: genome-wide (solo-WCGW) and those in the common PMD regions (solo-WCGW commonPMDs). The y-axis lists categories of late-replicating domains and number of mammalian array CpGs inside parentheses for Hg19 and mm10 genome, respectively. For each row, the table reports odds ratios (OR) from hypergeometric test results for the top 1,000 CpGs that increased/decreased with age from meta-EWAS of age across all, blood, skin, liver, muscle, brain, and cerebral cortex tissues, respectively. The heatmap color gradient is based on -log10 (unadjusted hypergeometric P value) multiplied by the sign of OR greater than one. Red colors denote OR greater than one in contrast with blue colors for OR less than one. The left/right panel lists the results based on the top 1,000 CpGs with positive/negative age correlation. Unadjusted P values are reported and derived from one-sided hypergeometric tests.
Extended Data Fig. 9
Extended Data Fig. 9. Enrichment with Transcription factor binding regions.
We studied the overlapping genomic regions between (1) the CpG sites located in the binding regions of 68 transcription factors (TF) in hg19 and (2) the top 1000 CpGs that increased/decreased with age from EWAS of age across mammalian tissues. TF results (y-axis, rows) versus mammalian EWAS of age are stratified by tissue type (x-axis, columns). The left/right panels of the x-axis list the top 1000 CpGs that increased/decreased with age from meta-EWAS of age across all tissues, blood only, skin only, liver, muscle, brain and cerebral cortex, respectively. The y-axis lists the names of transcription factors and number of mammalian array CpGs located in the binding sites. Background in hypergeometric tests was based on the genes present in our mammalian array. The bar plots in the first column report the total number of genes at each TF according to the background. The heatmap color codes -log10 (unadjusted hypergeometric P value). Unadjusted, one-sided hypergeometric P values (odds ratio) are listed on the heatmap provided P < 0.05.
Extended Data Fig. 10
Extended Data Fig. 10. EWAS-TWAS and EWAS-GWAS enrichment.
Panel (a) illustrates the overlap between genes identified in transcriptome-wide association studies (TWAS) across various cell types or species, and the top 1,000 CpGs that have increased/decreased with age in EWAS across mammalian tissues. TWAS results are stratified by tissue type, including all tissues, blood, skin, liver, muscle, brain, and cerebral cortex. Overlapping genes with P < 0.05 are reported. Similarly, Panel (b) demonstrates the overlaps between the top 2.5% genes implicated in genome-wide association studies (GWAS) of human complex traits, and the top 1,000 CpGs that have increased/decreased with age in EWAS across mammalian tissues. GWAS results are also stratified by tissue type, with significant overlaps reported where P < 0.05. Both panels utilize unadjusted, one-sided hypergeometric P values, with a background for hypergeometric tests derived from genes (panel a) or genomic regions (panel b) in our mammalian array. The heatmap color encodes -log10 P values. The right-side annotation indicates (a) the species categories for TWAS collections and (b) phenotype categories for GWAS collections. Further details for TWAS and GWAS indices are available in Supplementary Data 12 & 13. Abbreviations: (a) hipp.=hippocampus, MPNST = malignant peripheral nerve sheath tumor, mus.=muscle, TACs = transiently amplifying progenitor cells. (b) All = All ancestries, EUR = European ancestry, AFR = African American ancestry, FTD = frontotemporal dementia, WHR = waist to hip ratio.

References

    1. Ferrucci L, et al. Measuring biological aging in humans: a quest. Aging Cell. 2020;19:e13080. doi: 10.1111/acel.13080. - DOI - PMC - PubMed
    1. Bell CG, et al. DNA methylation aging clocks: challenges and recommendations. Genome Biol. 2019;20:249. doi: 10.1186/s13059-019-1824-y. - DOI - PMC - PubMed
    1. Field AE, et al. DNA methylation clocks in aging: categories, causes, and consequences. Mol. Cell. 2018;71:882–895. doi: 10.1016/j.molcel.2018.08.008. - DOI - PMC - PubMed
    1. Horvath S. DNA methylation age of human tissues and cell types. Genome Biol. 2013;14:R115. doi: 10.1186/gb-2013-14-10-r115. - DOI - PMC - PubMed
    1. Petkovich DA, et al. Using DNA methylation profiling to evaluate biological age and longevity interventions. Cell Metab. 2017;25:954–960. doi: 10.1016/j.cmet.2017.03.016. - DOI - PMC - PubMed

Publication types