. 2023 Sep;25(9):1303-1318.
doi: 10.1038/s41556-023-01198-6. Epub 2023 Aug 10.

Malonyl-CoA is a conserved endogenous ATP-competitive mTORC1 inhibitor

Affiliations

Malonyl-CoA is a conserved endogenous ATP-competitive mTORC1 inhibitor

Raffaele Nicastro et al. Nat Cell Biol. 2023 Sep.

Abstract

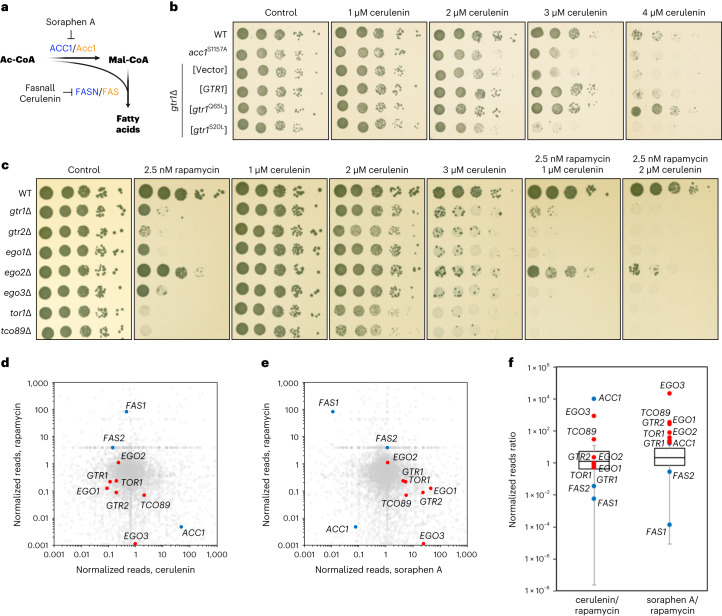
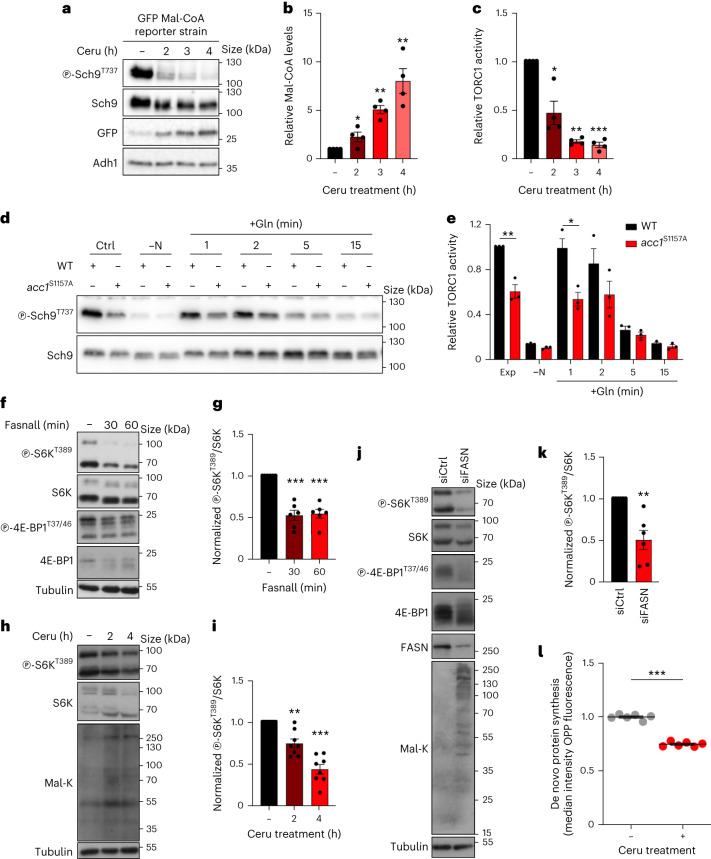
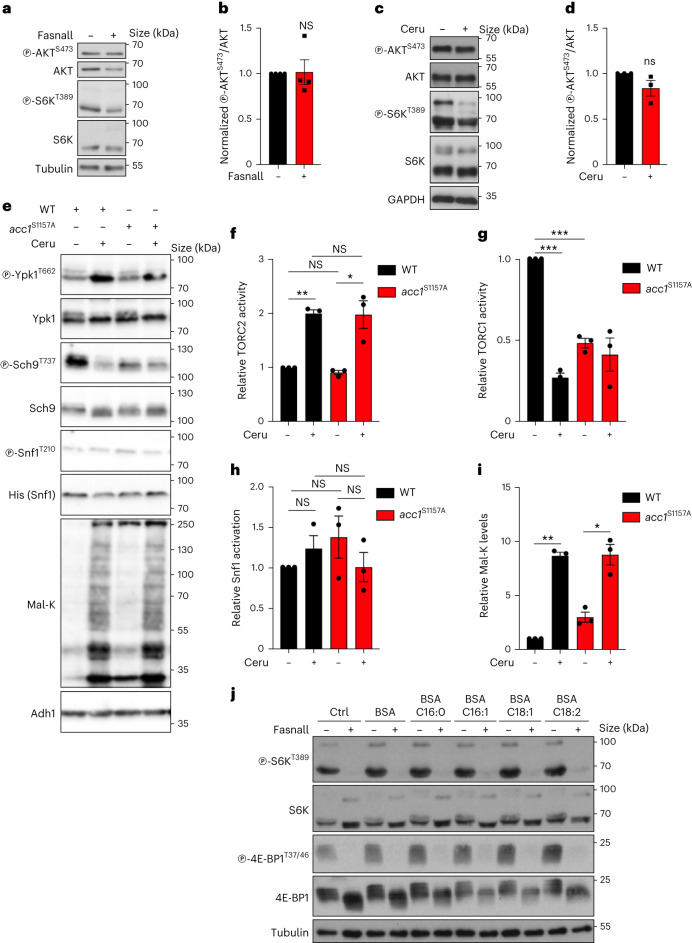
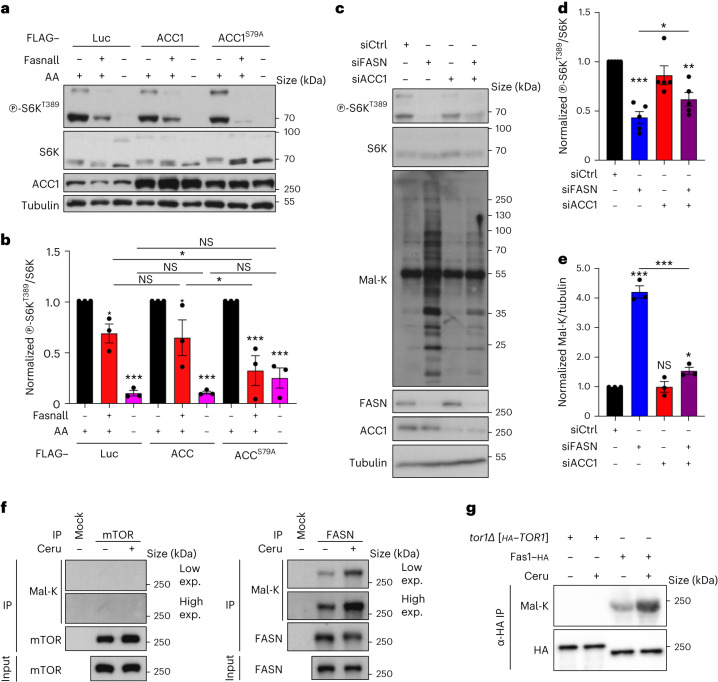
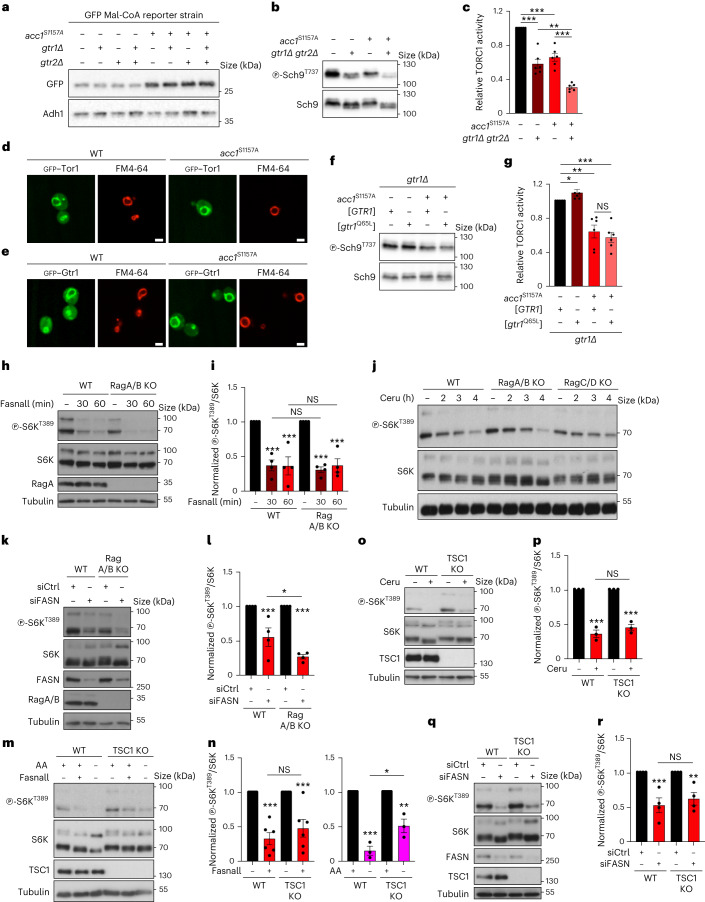
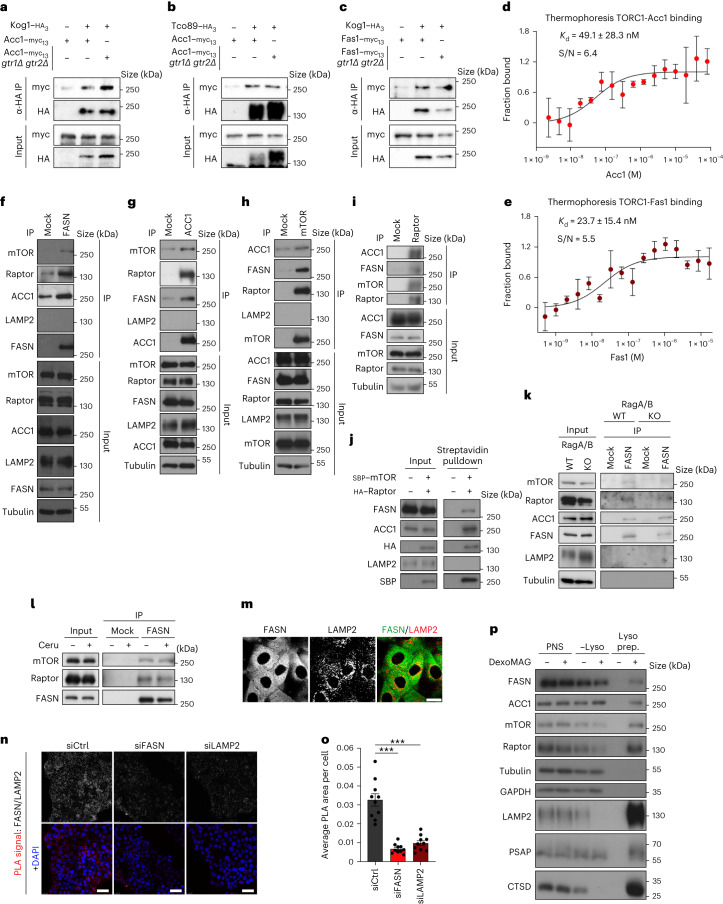
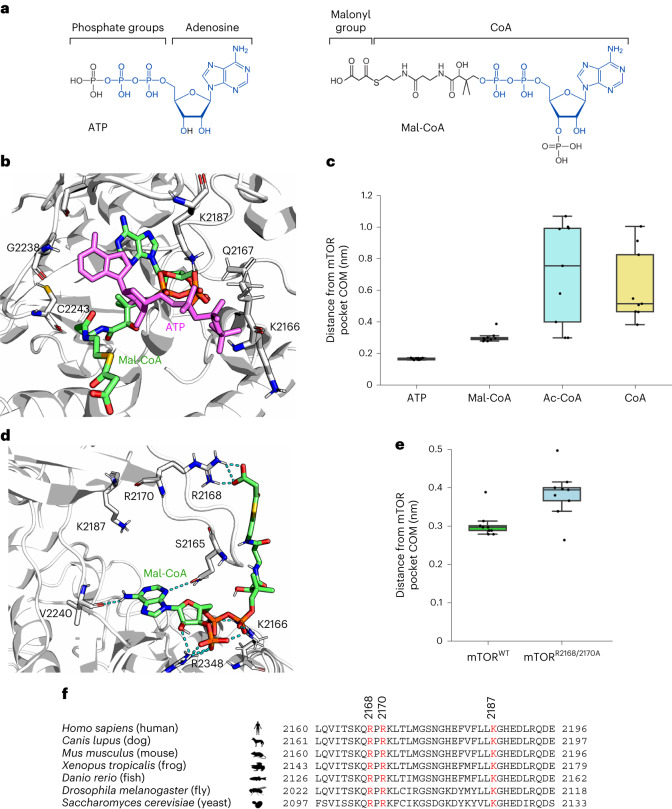
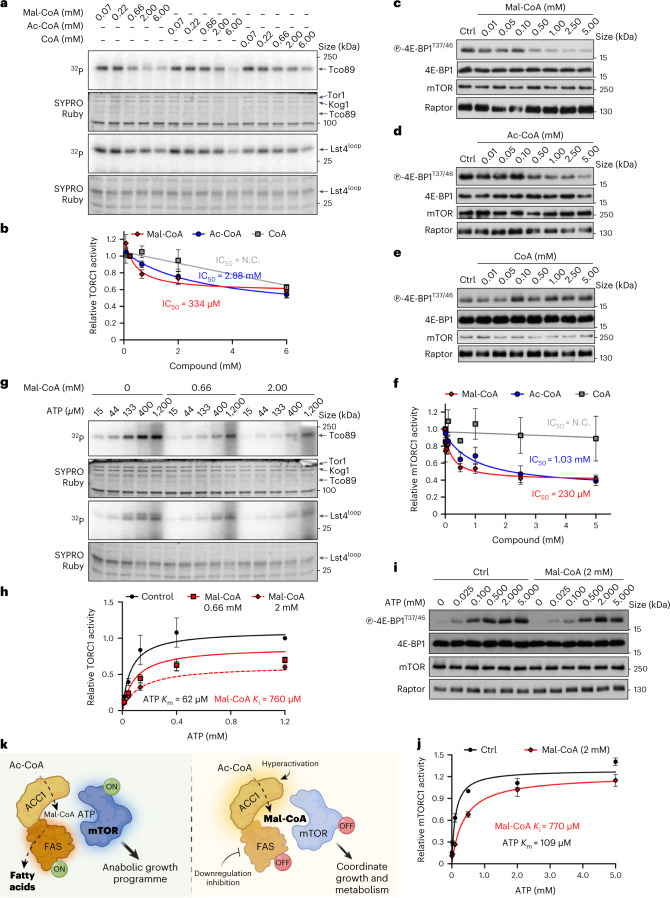
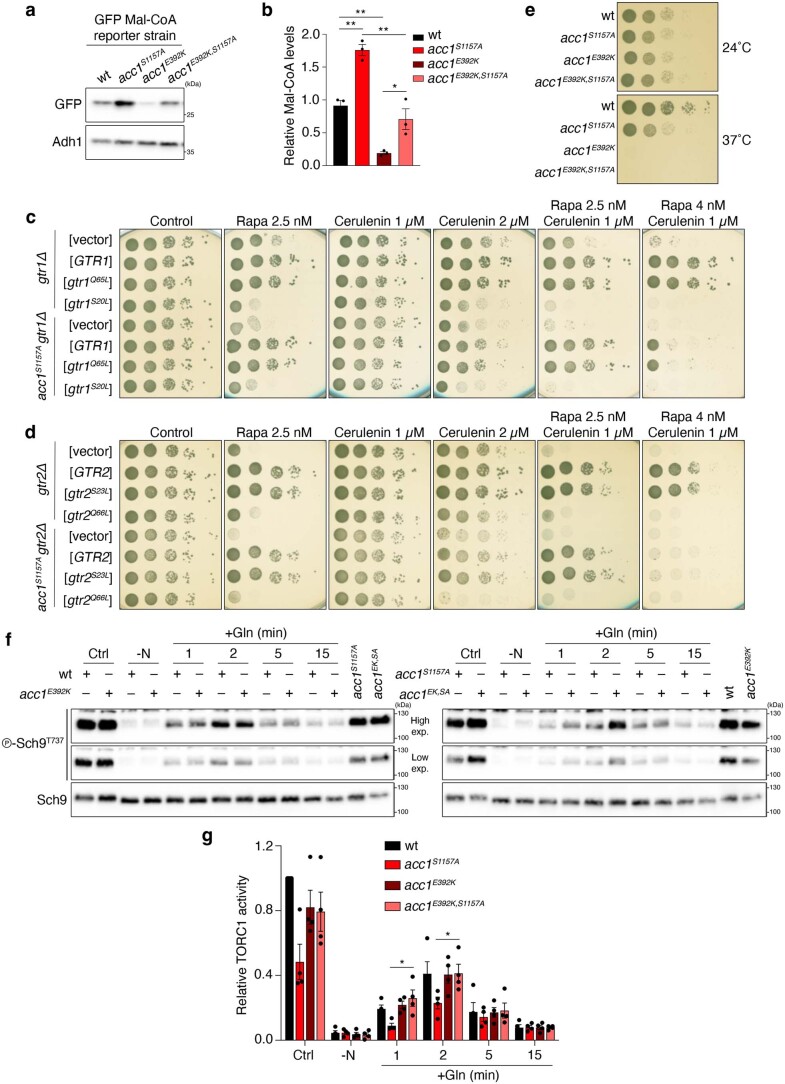
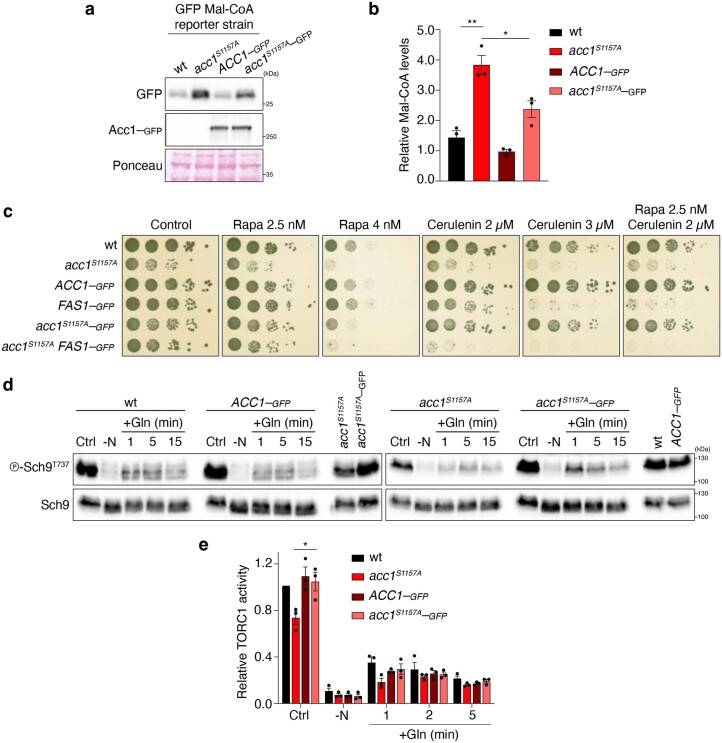
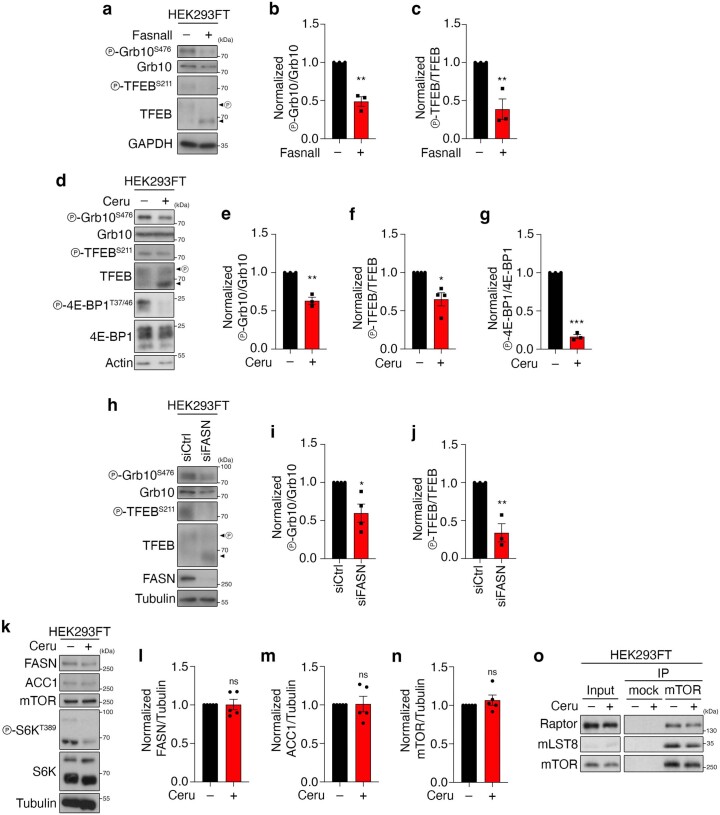
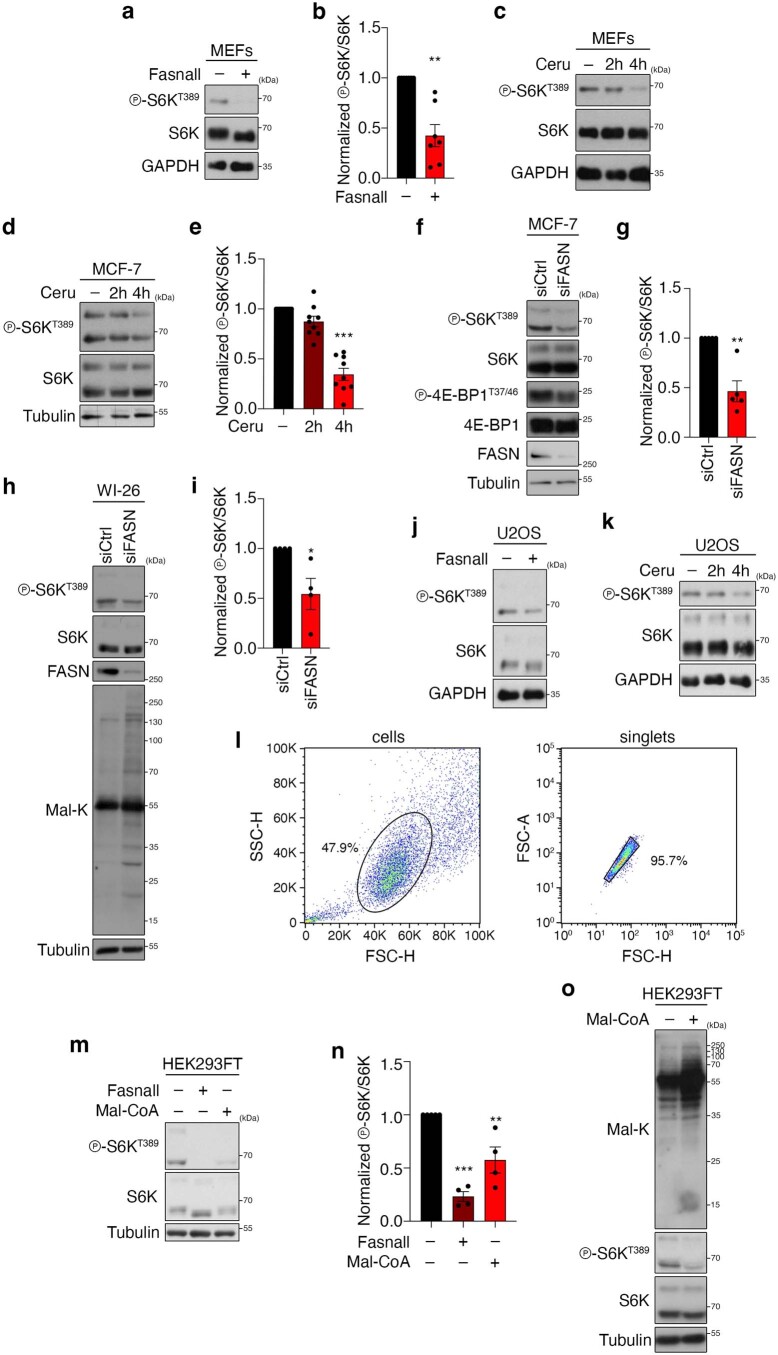
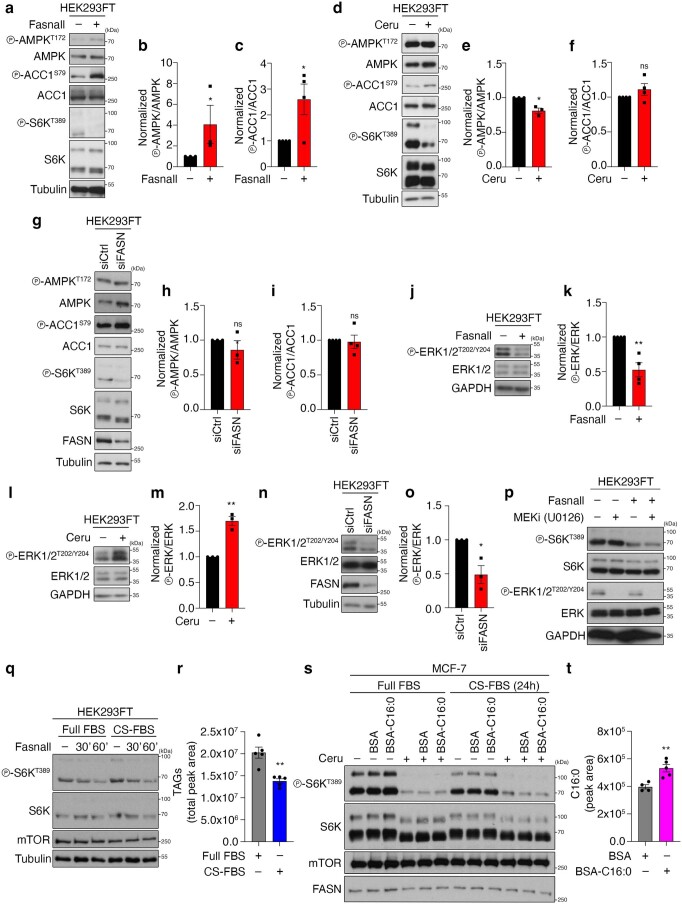
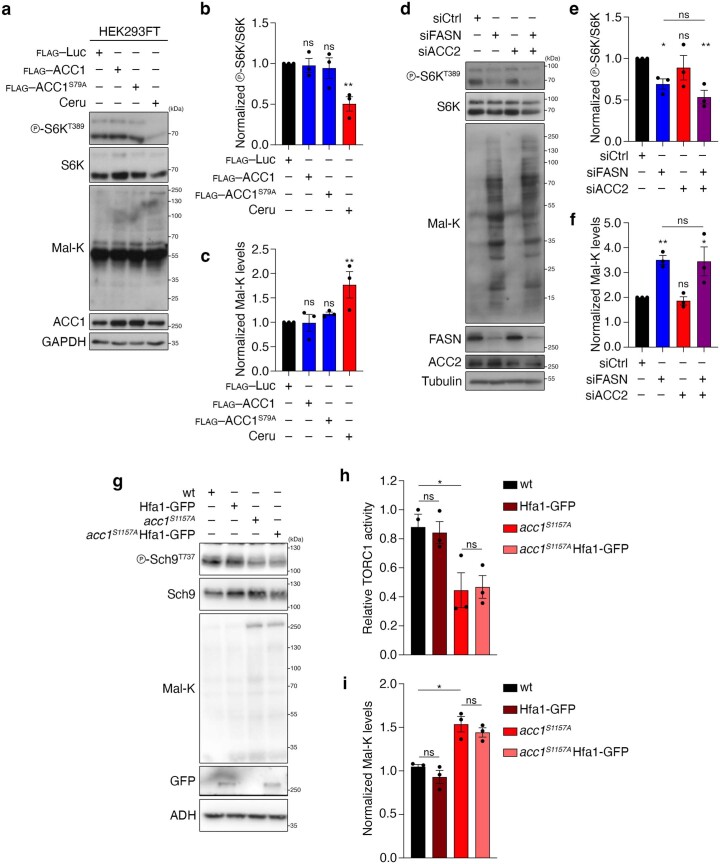
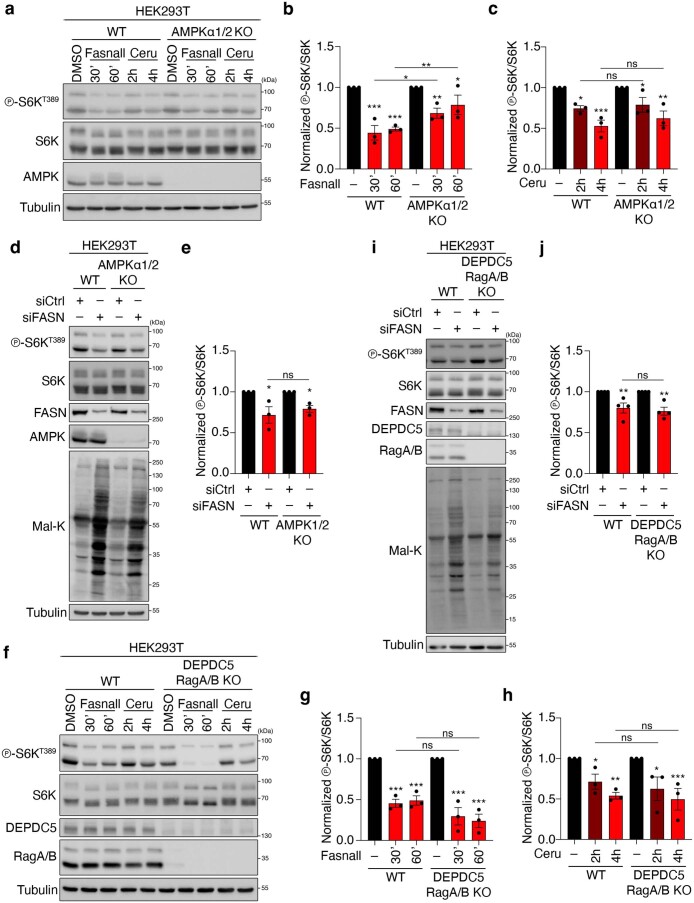
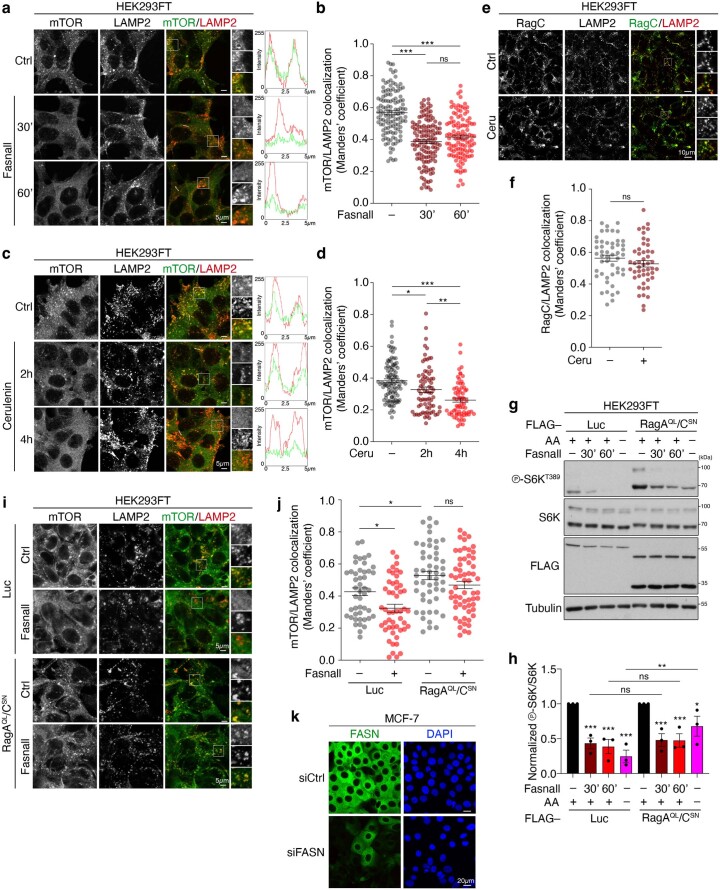
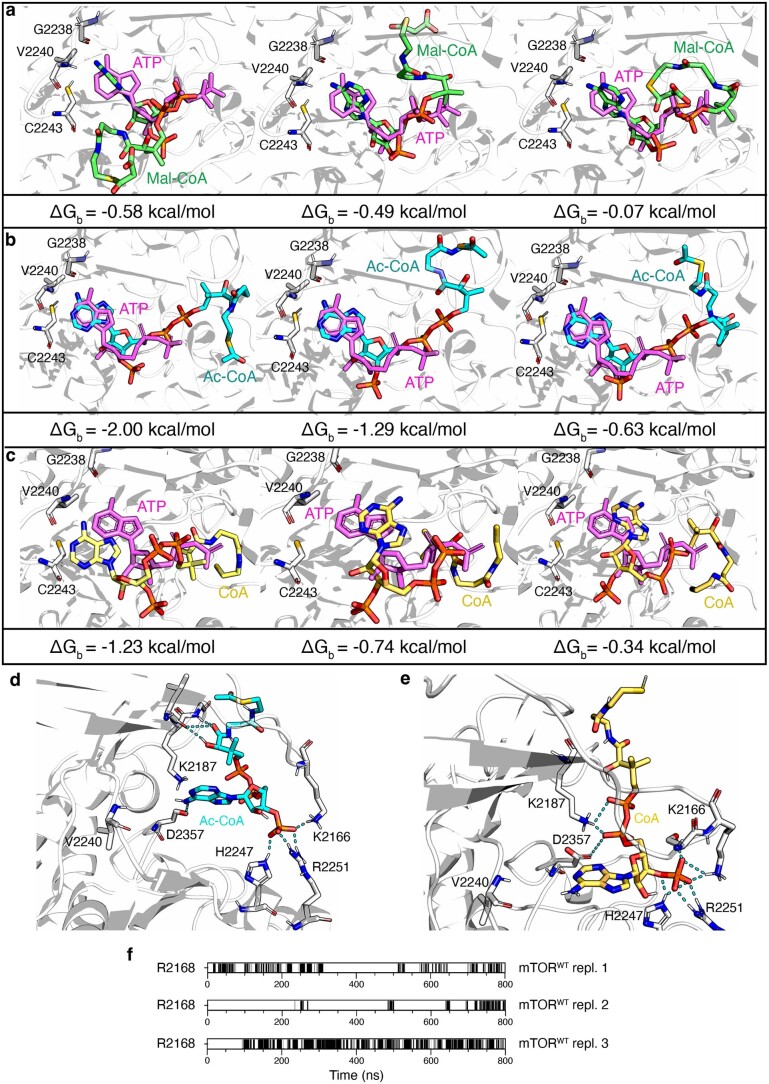
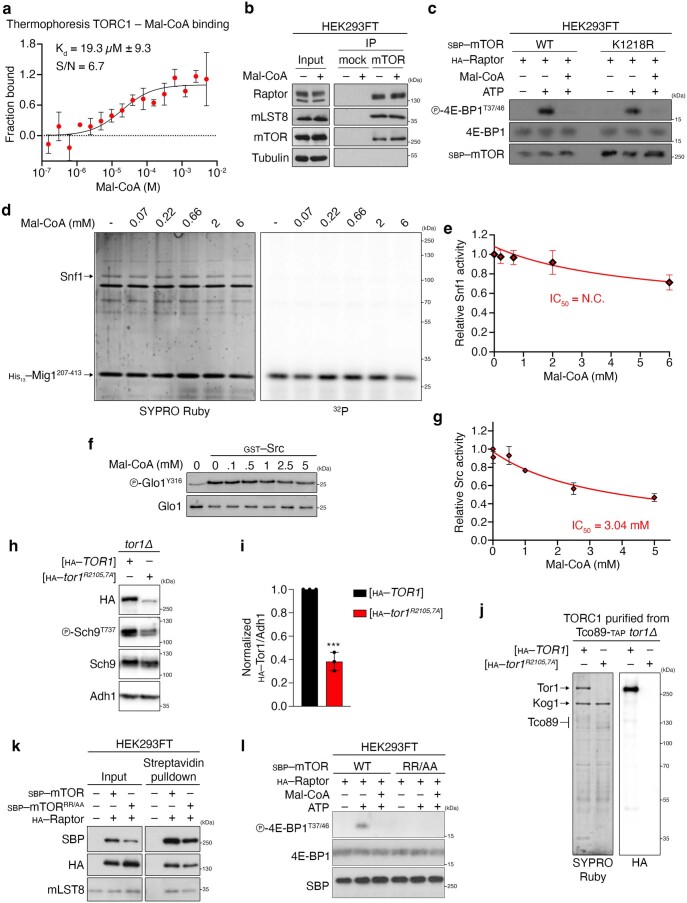
Cell growth is regulated by the mammalian/mechanistic target of rapamycin complex 1 (mTORC1), which functions both as a nutrient sensor and a master controller of virtually all biosynthetic pathways. This ensures that cells are metabolically active only when conditions are optimal for growth. Notably, although mTORC1 is known to regulate fatty acid biosynthesis, how and whether the cellular lipid biosynthetic capacity signals back to fine-tune mTORC1 activity remains poorly understood. Here we show that mTORC1 senses the capacity of a cell to synthesise fatty acids by detecting the levels of malonyl-CoA, an intermediate of this biosynthetic pathway. We find that, in both yeast and mammalian cells, this regulation is direct, with malonyl-CoA binding to the mTOR catalytic pocket and acting as a specific ATP-competitive inhibitor. When fatty acid synthase (FASN) is downregulated/inhibited, elevated malonyl-CoA levels are channelled to proximal mTOR molecules that form direct protein-protein interactions with acetyl-CoA carboxylase 1 (ACC1) and FASN. Our findings represent a conserved and unique homeostatic mechanism whereby impaired fatty acid biogenesis leads to reduced mTORC1 activity to coordinately link this metabolic pathway to the overall cellular biosynthetic output. Moreover, they reveal the existence of a physiological metabolite that directly inhibits the activity of a signalling kinase in mammalian cells by competing with ATP for binding.


Conflict of interest statement

The authors declare no competing interests.

Figures

Fig. 1
Fig. 1. Functional pharmacogenetic interactions between TOR-pathway genes, and Acc1 and Fas1 activity in yeast.
a, Schematic diagram of de novo FA biosynthesis. Yeast and mammalian proteins are shown in orange and blue, respectively. b, Yeast Rag GTPase mutants that impair or promote TORC1 activity are cerulenin-sensitive or cerulenin-resistant, respectively. Tenfold serial dilutions of wild-type (WT), hyperactive Acc1S1157A-expressing (acc1S1157A) and gtr1Δ cells expressing plasmid-encoded WT GTR1, gtr1Q65L (TORC1-activating) or gtr1S20L (TORC1-inactivating), or containing an empty vector were spotted on plates with the indicated concentrations of cerulenin or vehicle (control) and cultured at 30 °C for 2 d. c, TORC1 and EGOC mutants are sensitive to cerulenin and hypersensitive to combined cerulenin and rapamycin treatment. Drop spot assays were performed as in b using the indicated cell strains and plates containing the indicated concentrations of rapamycin and/or cerulenin. d, Positive correlation between rapamycin- and cerulenin-induced SATAY transposition profiles in TORC1 and EGOC genes. e, Negative correlation between rapamycin- and soraphen A-induced SATAY transposition profiles in TORC1 and EGOC genes. d,e, The dot plots show the ratio of transposition events (reads) per coding gene in rapamycin- and cerulenin-treated (d), and rapamycin- and soraphen A-treated (e) versus previously published untreated SATAY libraries,. f, Summary of the pairwise correlations of the transposon profiles of TORC1, EGOC (red dots) and FA biosynthesis (blue dots) genes shown in d,e. Boxplots: central line, median; box, interquartile range (IQR; 25th (Q1)–75th (Q3) percentile); and whiskers, Q3 + 1.5 × IQR and Q1 − 1.5 × IQR. Source numerical data are provided. Source data
Fig. 2
Fig. 2. Mal-CoA level increase through genetic or pharmacological perturbation to Fas1 and Acc1 activity reduces mTORC1 activity in yeast and mammalian cells.
ac, Cerulenin boosts Mal-CoA levels and inhibits TORC1 activity (n = 4 independent experiments). a, Immunoblots of the lysates of yeast cells expressing the fapR/fapOp-yeGFP Mal-CoA reporter system treated with 20 μM cerulenin for the indicated times. GFP expression serves as an indicator of the Mal-CoA levels. Phosphorylation at T737 of Sch9 (p-Sch9T737) was used to assess TORC1 activity. b,c, Calculated relative Mal-CoA levels (GFP/Adh1 ratio; b) and relative TORC1 activity (p-Sch9T737/Sch9 ratio; c). d, Immunoblots of the lysates of wild-type (WT) and Acc1S1157A-expressing yeast cells that were cultured to the exponential phase (Ctrl), starved of nitrogen (–N), or starved and restimulated with Gln for the indicated times (n = 3 independent experiments). TORC1 activity was assessed by Sch9 phosphorylation. e, Levels of the relative TORC1 activity (p-Sch9T737/Sch9 ratio) in d. f,g, Pharmacological inhibition of FASN downregulates mTORC1. Phosphorylation of S6K at T389 and 4E-BP1 at T37 and T46 was used to assay mTORC1 activity (n = 6 independent experiments). f, Immunoblots of the lysates of HEK293FT cells treated with 25 μM Fasnall for the indicated times. g, Normalized p-S6KT389/S6K ratio. h,i, HEK293FT cells were treated with 50 μM cerulenin for the indicated times. The levels of p-S6KT389 were used to assay mTORC1 activity (n = 8 independent experiments). h, Mal-K immunoblots indicating total protein malonylation as a readout for Mal-CoA levels. i, Normalized p-S6KT389/S6K ratio. j,k, HEK293FT cells were treated with control siRNA (siCtrl) or siFASN (FASN knockdown). The levels of p-S6KT389 and p-4E-BP1T37/46 were used to assay mTORC1 activity (n = 6 independent experiments). j, Mal-K immunoblots showing total protein malonylation. k, Normalized p-S6KT389/S6K ratio. l, Effects of FASN inhibition on de novo protein synthesis. O-Propargyl-puromycin (OPP) incorporation assay for HEK293T cells treated with cerulenin (50 μM, 4 h) or dimethylsulfoxide (DMSO) as the control. Data represent the median fluorescence intensity of OPP Alexa Fluor 488; n = 6 biological replicates from two independent experiments. b,c,e,g,i,k,l, Data are the mean ± s.e.m. *P < 0.05, **P < 0.005, ***P < 0.0005. Ceru, cerulenin. Source numerical data and unprocessed blots are provided. Source data
Fig. 3
Fig. 3. Perturbations to the activity of FASN/Fas1 or yeast Acc1 specifically downregulate mTORC1, but not mTORC2, independently of FA availability.
a,b, Fasnall treatment does not influence mTORC2 activity in HEK293FT cells. Cells were treated with 25 μM Fasnall or DMSO (–) as the control for 30 min (n = 4 independent experiments). a, Immunoblotting for AKT phosphorylation at S473 was used to assess mTORC2 activity. b, Levels of mTORC2 activity (p-AKTS473/AKT). c,d, Effect of cerulenin treatment (50 μM, 4 h) on cells as in a,b (n = 3 independent experiments). d, Levels of mTORC2 activity (p-AKTS473/AKT). ei, Neither expression of the acc1S1157A allele nor treatment of yeast cells with cerulenin (20 μM, 2 h) downregulates TORC2 or Snf1 (yeast AMPK) activity. e, Lysates from control (−) or cerulenin-treated wild-type (WT) and acc1S1157A mutant cells were immunoblotted with the indicated antibodies (n = 3 independent experiments). Phosphorylation of Ypk1 was used as the TORC2 readout. Phosphorylation of Snf1 was used as the AMPK activation readout. Total Snf1 was detected with an antibody to a histidine (His) stretch in Snf1. Mal-K blots showing total protein malonylation, which is indicative of intracellular Mal-CoA levels. fi, Levels of TORC2 activity (p-Ypk1T662/Ypk1; f), TORC1 activity (p-Sch9T737/Sch9; g), Snf1 activation (p-Snf1T210/His; h) and lysine malonylation (Mal-K/Adh1; i). j, Inhibition of FASN downregulates mTORC1 activity independently of lipid availability. Immunoblots with lysates from control (−) or Fasnall-treated (25 μM, 30 min) HEK293FT cells supplemented with BSA-conjugated FAs, as indicated, or BSA as a control. Phosphorylation of S6K and 4E-BP1 was used to assay mTORC1 activity (n = 2 independent experiments). b,d,f,g,h,i, Data are the mean ± s.e.m. *P < 0.05; **P < 0.005; ***P < 0.0005; and NS, not significant. Ctrl, control; and Ceru, cerulenin. Source numerical data and unprocessed blots are provided. Source data
Fig. 4
Fig. 4. Mal-CoA accumulation following perturbations to ACC1 and FASN inhibits mTORC1 independently of mTOR malonylation.
a,b, Exogenous expression of a hyperactive ACC1 mutant (ACC1S79A) cooperates with FASN inhibition to downregulate mTORC1 in HEK293FT cells without influencing the response to amino-acid (AA) starvation. The cells were transfected with vectors expressing FLAG-tagged WT ACC1, ACC1S79A or Luciferase (Luc; as the control) and treated with Fasnall (25 μM, 30 min) or AA-starvation medium (1 h) as indicated (n = 3 independent experiments). a, Phosphorylation of S6K at T389 was used to assay mTORC1 activity. b, Levels of mTORC1 activity (p-S6KT389/S6K ratio). ce, ACC1 knockdown partially restores the increase in Mal-CoA levels and rescues the downregulation of mTORC1 caused by silencing of FASN. siCtrl, control siRNA; and siACC1, siRNA to ACC1. c, Immunoblots of HEK293T cell lysates. d, Calculated levels of mTORC1 activity (p-S6KT389/S6K ratio; n = 5 independent experiments). e, Levels of Mal-K (Mal-K/tubulin ratio; n = 3 independent experiments). f, Lack of detectable mTOR malonylation in HEK293FT cells. Endogenous mTOR (left) and FASN (right) proteins were immunoprecipitated from control (−) or cerulenin-treated (50 μM, 4 h) cells. g, Tor1 is not malonylated in yeast cells. Amino (N)-terminally HA-tagged Tor1 or C-terminally HA-tagged Fas1 was immunoprecipitated from control (−) or cerulenin-treated (10 μM, 2 h) cells cultured to the exponential phase; α-HA, anti-HA. f,g, Protein malonylation was assessed using anti-Mal-K (n = 3 independent experiments); IP, immunoprecipitate; and exp., exposure. b,d,e, Data are the mean ± s.e.m. *P < 0.05; **P < 0.005; ***P < 0.0005; and NS, not significant. Ceru, cerulenin. Source numerical data and unprocessed blots are provided. Source data
Fig. 5
Fig. 5. Perturbations to Acc1 and FASN/Fas1 downregulate mTORC1 independently of key upstream regulators.
a, Immunoblots with lysates from the indicated yeast strains analysed as in Fig. 2a (n = 3 independent experiments). b, Immunoblots of the lysates of the indicated yeast strains assayed for TORC1 activity as in Fig. 2a. c, The level of phosphorylation at T737 of Sch9 (p-Sch9T737/Sch9) was used to assay the TORC1 activity levels in b (n = 6 independent experiments). d,e, Constitutive activation of Acc1 (acc1S1157A) does not alter vacuolar morphology or the subcellular localization of GFP–Tor1 (d) or GFP-Gtr1 (e). Vacuoles were stained with FM4-64. Scale bars, 5 μm; n = 3 independent experiments. f,g, Expression of the GTP-locked Gtr1Q65L allele does not suppress the TORC1 inhibition mediated by the Acc1S1157A allele. g, Levels of TORC1 activity (p-Sch9T737/Sch9; n = 6 independent experiments). h,i, FASN inhibition downregulates mTORC1 activity independently of the Rags. h, RagA/B-knockout and WT HEK293FT were treated with 25 μM Fasnall for the indicated times and their lysates were immunoblotted. i, Levels of mTORC1 activity (p-S6KT389/S6K) normalized to the respective DMSO-treated control (n = 4 independent experiments). j, RagA/B-knockout, RagC/D-knockout and WT HEK293FT cells were treated with 50 μM cerulenin for the indicated times (n = 4 independent experiments). k,l, RagA/B-knockout and WT HEK293FT were treated as in h but with FASN knockdown. Levels of mTORC1 activity (p-S6KT389/S6K) normalized to the respective DMSO-treated control (n = 4 independent experiments). m,n, FASN inhibition downregulates mTORC1 activity independently of the TSC complex. m, TSC1-knockout and WT HEK293FT cells were treated with 25 μM Fasnall (30 min) or amino-acid-starvation medium (AA; 1 h). n, Levels of mTORC1 activity (p-S6KT389/S6K) normalized to the respective DMSO-treated control (nFasnall = 6 (left) and nAA = 3 independent experiments (right)). o,p, TSC1-knockout and WT HEK293FT cells were treated with cerulenin (50 μM, 4 h) as in m,n. p, Levels of mTORC1 activity (p-S6KT389/S6K) normalized to the respective DMSO-treated control (n = 3 independent experiments). q,r, TSC1-knockout and WT HEK293FT cells were treated as in m,n but with FASN knockdown. Levels of mTORC1 activity (p-S6KT389/S6K) normalized to the respective control knockdown (n = 4 independent experiments). c,g,i,l,n,p,r, Data are the mean ± s.e.m. *P < 0.05; **P < 0.005; ***P < 0.0005; and NS, not significant. Ceru, cerulenin; and KO, knockout. Source numerical data and unprocessed blots are provided. Source data
Fig. 6
Fig. 6. The mTORC1–FASN–ACC1 proteins form reciprocal interactions in yeast and mammalian cells.
a,b, Acc1 physically interacts with TORC1 in a Rag-independent manner. Wild-type and gtr1Δ gtr2Δ cells expressing genomically tagged Acc1–myc13 and untagged (−) or genomically tagged (+) TORC1 subunits Kog1–HA3 (a) or Tco89–HA3 (b) were cultured to the exponential phase. The input and anti-HA IPs were analysed by immunoblotting (n = 3 independent experiments). c, As in a,b but with genomically tagged Fas1–myc13 and untagged or genomically tagged Kog1–HA3 (n = 3 independent experiments). d,e, Acc1 (d) and Fas1 (e) titration curves in MST binding affinity assays using fluorescent TORC1 as the target (n = 3 independent experiments). Data are the mean ± s.d.; S/N, signal-to-noise ratio. f, FASN interacts with mTOR, Raptor and ACC1 directly. Endogenous FASN was immunoprecipitated from HEK293FT cell lysates and the co-immunoprecipitated proteins were identified by immunoblotting as indicated. LAMP2 was used as the negative control (n = 8 independent experiments). g, As in f but with ACC1 immunoprecipitation (n = 4 independent experiments). h, As in f but with mTOR immunoprecipitation (n = 6 independent experiments). i, As in f but with Raptor immunoprecipitation (n = 3 independent experiments). j, Streptavidin pulldown experiments with HEK293FT cells expressing SBP–mTOR and HA–Raptor exogenously (n = 2 independent experiments). k, The interaction between FASN, mTOR/Raptor and ACC1 is independent of the Rags (n = 3 independent experiments using HEK293FT cells). l, The stability of the mTORC1–FASN interaction is not affected by FASN inhibition (n = 2 independent experiments using HEK293FT cells). m, Immunofluorescence of FASN and LAMP2 in MCF-7 cells. Scale bar, 10 μm (n = 3 independent experiments). n,o, FASN was detected in proximity to lysosomes. Antibodies to FASN and LAMP2 were used in PLA assays in MCF-7 cells. n, The specificity of the PLA signal (red dots) was verified by FASN and LAMP2 knockdown using siRNA. Scale bars, 25 μm; siCtrl, control siRNA; and siLAMP2, siRNA to LAMP2; and DAPI, 4,6-diamidino-2-phenylindole. o, Quantification of PLA signal intensity (n = 10 randomly selected fields from one representative experiment of four independent replicates). Data are the mean ± s.e.m. ***P < 0.0005. p, Lysosome enrichment assay with DexoMAG for the presence of the indicated proteins in the post-nuclear supernatant (PNS), non-lysosomal fraction (–Lyso) and lysosomal fraction (Lyso prep; n = 5 independent experiments). IP, immunoprecipitate; α-HA, anti-HA. Source numerical data and unprocessed blots are provided. Source data
Fig. 7
Fig. 7. Molecular dynamics simulation of Mal-CoA binding to the mTOR catalytic pocket.
a, Chemical structures of ATP (left) and Mal-CoA (right) highlighting structural similarities between the two molecules. Identical parts are marked in blue. b, Structural alignment of representative snapshots of Mal-CoA (green; initial conformation shown) and ATP (magenta) bound to the mTOR catalytic pocket (top view). c, Distances of the indicated ligands from the mTOR binding pocket during the molecular dynamics simulations. The distances were computed between the centre of mass (COM) of the adenine ring and the COM of the amino-acid residues defining the pocket (n = 9 measurements from three independent replicate runs, with three data points extracted per run for each compound). Individual data points represent the average over 100 ns of molecular dynamics simulation; Ac-CoA, acetyl-CoA. d, The malonyl group of Mal-CoA forms salt bridges with charged residues at the edge of the mTOR catalytic pocket (lateral view). Representative Mal-CoA (green) conformation sampled by molecular dynamics simulations. The hydrogen bonds established between Mal-CoA (final conformation in the simulation) and the amino-acid residues of the mTOR pocket are shown as cyan dotted lines. Note that only a snapshot is shown, with multiple residues participating in the formation of dynamic interactions with the malonyl group and R2168 being the most frequent. e, In silico mutagenesis of key mTOR residues weakens the interaction between Mal-CoA and mTOR. Distances of Mal-CoA from the mTOR binding pocket during the molecular dynamics simulations as in c comparing mTORWT and mTORR2168A/R2170A molecules (n = 9 measurements from three independent replicate runs, with three data points extracted per run). Individual data points represent the average over 100 ns of molecular dynamics simulation. f, Amino-acid sequence alignment of amino-acid residues 2160–2196 of human mTOR with the respective orthologous sequences from other organisms. Key conserved residues that participate in interactions with Mal-CoA are shown in red. c,e, Boxplots: central line, median; box, IQR (25th (Q1)–75th (Q3) percentile); and whiskers, Q3 + 1.5 × IQR and Q1 − 1.5 × IQR. Source numerical data are provided. Source data
Fig. 8
Fig. 8. Mal-CoA is a direct ATP-competitive inhibitor of mTORC1.
a,b, Mal-CoA, and to a lesser extent acetyl-CoA (Ac-CoA), inhibits TORC1 activity in vitro. TORC1 purified from yeast was used in IVK assays with recombinant Lst4Loop and co-purified Tco89 proteins as substrates in the presence of increasing concentrations of Mal-CoA, Ac-CoA or CoA. a, Substrate phosphorylation was detected using autoradiography (32P). Total protein was detected by SYPRO Ruby staining. b, Calculated levels of TORC1 activity (Lst4Loop phosphorylation; n = 3 independent experiments). cf, mTORC1 purified from HEK293FT cells was used in IVK assays as in a with recombinant 4E-BP1 protein as the substrate in the presence of increasing concentrations of Mal-CoA (c), Ac-CoA (d) or CoA (e). ce, Phosphorylation of 4E-BP1 was detected by immunoblotting. f, Levels of mTORC1 activity (nMal-CoA = 9, nAc-CoA = 6 and nCoA = 4 independent experiments). g,h, Mal-CoA inhibits TORC1 in an ATP-competitive manner. Increasing ATP concentrations with or without Mal-CoA were used in IVK assays performed as in a. h, Levels of TORC1 activity (Lst4Loop phosphorylation; n = 3 independent experiments). i,j, Increasing ATP concentrations in the presence or absence of 2 mM Mal-CoA were used in IVK assays performed as in c. j, Levels of mTORC1 activity (n = 4 independent experiments). k, Model of mTOR inhibition by Mal-CoA. When the FA biosynthesis machinery is active, ACC1 converts Ac-CoA to Mal-CoA, which is in turn rapidly converted to palmitate by FASN (left). In contrast, when ACC1 is hyperactive or FASN is downregulated, accumulating Mal-CoA competes with ATP for binding to proximal mTOR molecules, causing their inactivation. Hence, by complexing with ACC1 and FASN, mTORC1 functions as a direct sensor for Mal-CoA to adjust growth and coordinate cellular metabolic activity in response to decreased cellular FA biosynthesis capacity (right). b,f,h,j, Data are the mean ± s.e.m. Ctrl, control; N.C., not calculated. Source numerical data and unprocessed blots are provided. Source data
Extended Data Fig. 1
Extended Data Fig. 1. Perturbations to Acc1 influence Mal-CoA levels and TORC1 activity in yeast cells.
a,b, Mal-CoA levels in WT and hyperactive acc1S1157A cells are significantly reduced by introduction of the hypomorphic acc1E392K mutation. Mal-CoA levels were assessed by GFP blots in cells grown at 24 °C (a) and quantified (b) as in Fig. 2a,b, respectively; n = 3 independent experiments. c,d, Pharmacogenetic interactions of rapamycin and cerulenin indicate a potential inhibitory role of Mal-CoA in TORC1 signalling. c, gtr1Δ and acc1S1157Agtr1Δ mutant strains containing an empty vector or expressing plasmid-encoded wild-type GTR1, gtr1Q65L or gtr1S20L were spotted and cultured on plates with the indicated concentrations of rapamycin and/or cerulenin. d, The respective gtr2Δ and acc1S1157Agtr2Δ mutant strains expressing plasmid-encoded wild-type GTR2, gtr2S23L or gtr2Q66L are shown; n = 3 independent experiments. e, The acc1E392K mutation causes temperature-sensitive growth even when combined with the acc1S1157A mutation. Exponentially growing cells with the indicated genotypes were spotted on plates (tenfold serial dilutions) and cultured for 3 d at 24 °C or 37 °C; n = 3 independent experiments. f,g, Mutation of E392K in acc1S1157A suppresses the TORC1-inhibitory effect of acc1S1157A. Immunoblots (f) and quantifications of TORC1 activity (p-Sch9Thr737/Sch9; g) were carried out as in Fig. 2d,e, respectively. f, The samples derive from the same experiment and gels/blots were processed in parallel; n = 4 independent experiments. Data in graphs are shown as the mean ± s.e.m. *P < 0.05, **P < 0.005. Source numerical data and unprocessed blots are provided. Source data
Extended Data Fig. 2
Extended Data Fig. 2. Carboxy-terminal tagging of Acc1S1157A restrains its capacity to stimulate Mal-CoA levels and inhibit TORC1 in yeast.
a,b, Carboxy-terminal GFP tagging of endogenous Acc1S1157A significantly reduces Mal-CoA levels. See Fig. 2a,b for details. a, Ponceau staining as loading control. b, Quantification of relative Mal-CoA levels (GFP/Ponceau signal); n = 3 independent experiments. c, Carboxy-terminal GFP tagging of endogenous Acc1S1157A partially reverts its ability to render cells rapamycin- and cerulenin-sensitive. In control experiments, C-terminal GFP tagging of endogenous Fas1 rendered WT cells cerulenin-sensitive and further enhanced the cerulenin sensitivity of acc1S1157A cells, while marginally affecting the rapamycin-sensitivity of the respective cells. Spot assays with the indicated yeast genotypes and rapamycin and/or cerulenin concentrations performed as in Fig. 1b; n = 3 independent experiments. d,e, Carboxy-terminal GFP tagging of endogenous Acc1S1157A suppresses its ability to inhibit TORC1 in exponentially growing and Gln-restimulated cells. d, TORC1 activities assessed as in Fig. 2d. e, Quantification of relative TORC1 activity (p-Sch9Thr737/Sch9). d, The samples derive from the same experiment and gels/blots were processed in parallel; n = 3 independent experiments. Data in graphs are shown as the mean ± s.e.m. *P < 0.05, **P < 0.005. Source numerical data and unprocessed blots are provided. Source data
Extended Data Fig. 3
Extended Data Fig. 3. FASN inhibition/knockdown decreases mTORC1 activity towards multiple substrates, without affecting FASN/ACC1/mTOR levels or mTORC1 stability.
ac, Fasnall downregulates mTORC1 activity towards Grb10 and TFEB. Cells were treated for 30 min with 25 μM Fasnall or DMSO (−) as the control. b, Quantification of Grb10 phosphorylation (p-Grb10T389/Grb10). c, Quantification of TFEB phosphorylation (p-TFEBS211/TFEB); n = 3 independent experiments. dg, Cerulenin downregulates mTORC1 activity towards Grb10, TFEB and 4E-BP1. d, Cells were treated for 4 h with 50 μM cerulenin or DMSO (−) as the control. e, Quantification of Grb10 phosphorylation (p-Grb10T389/Grb10); n = 3 independent experiments. f, Quantification of TFEB phosphorylation (p-TFEBS211/TFEB); n = 4 independent experiments. g, Quantification of 4E-BP1 phosphorylation (p-4E-BP1T37/46/4E-BP1); n = 3 independent experiments. hj, As in ac, but with transient FASN knockdown. nGrb10 = 4 and nTFEB = 3 independent experiments. kn, FASN, ACC1 and mTOR total protein levels are not affected by short-term FASN inhibition (4 h cerulenin). k, Immunoblots for the indicated proteins. ln, Quantification of relative FASN (l), ACC1 (m) and mTOR levels (n); n = 5 independent experiments. o, Stability and composition of mTORC1 is not affected by FASN inhibition with cerulenin (4 h); n = 2 independent experiments. Data in graphs are shown as the mean ± s.e.m. *P < 0.05, **P < 0.005, ***P < 0.0005. Source numerical data and unprocessed blots are provided. Source data
Extended Data Fig. 4
Extended Data Fig. 4. FASN blockage or exogenous Mal-CoA downregulates mTORC1 in different mammalian cell lines.
a,b, Fasnall downregulates mTORC1 activity in mouse embryonic fibroblasts (MEFs.) a, Cells were treated for 30 min with 25 μM Fasnall or DMSO (−) as the control. b, Quantification of mTORC1 activity (p-S6KT389/S6K); n = 7 independent experiments. c, Cerulenin downregulates mTORC1 activity in MEFs. Cells treated for 2 or 4 h with 50 μM Cerulenin (Ceru) or DMSO (4 h) as the control (−); n = 3 independent experiments. d,e, Cerulenin downregulates mTORC1 activity in MCF-7. d, Cells were treated for 2 or 4 h with 50 μM cerulenin (Ceru) or DMSO (4 h) as the control (−). e, Quantification of mTORC1 activity (p-S6KT389/S6K); n = 9 independent experiments. f,g, FASN knockdown downregulates mTORC1 activity in MCF-7. g, Quantification of mTORC1 activity (p-S6KT389/S6K);. n = 5 independent experiments. h,i, FASN knockdown downregulates mTORC1 activity and increases Mal-CoA levels in WI-26 fibroblasts. h, Mal-K blots show total protein malonylation, indicative of intracellular Mal-CoA levels. i, Quantification of mTORC1 activity (p-S6KT389/S6K);. n = 4 independent experiments. j, Fasnall downregulates mTORC1 activity in U2OS. Cells treated for 30 min with 25 μM Fasnall or DMSO as control (−); n = 3 independent experiments. k, Cerulenin downregulates mTORC1 activity in U2OS. Cells were treated for 2 or 4 h with 50 μM cerulenin (Ceru) or DMSO (4 h) as the control (−); n = 2 independent experiments. l, Gating strategy for the flow-cytometry-based OPP incorporation assay shown in Fig. 2l. mo, Exogenous Mal-CoA addition is capable of downregulating mTORC1. m, HEK293FT cells were treated with 25 μM Fasnall or 250 μM Mal-CoA for 30 min. n, Quantification of mTORC1 activity (p-S6KT389/S6K). o, Total protein malonylation (Mal-K blots) indicates uptake of exogenously supplemented Mal-CoA ; n = 4 independent experiments. Data in graphs are shown as the mean ± s.e.m. *P < 0.05, **P < 0.005, ***P < 0.0005. Source numerical data and unprocessed blots are provided. Source data
Extended Data Fig. 5
Extended Data Fig. 5. FASN inhibition/knockdown downregulates mTORC1 activity independently from changes in AMPK or ERK signalling and from lipid availability.
ac, AMPK and ACC1 phosphorylation in cells treated with Fasnall. b, Quantification of AMPK phosphorylation; n = 3 independent experiments. c, Quantification of ACC1 phosphorylation; n = 4 independent experiments. df, As in ac, but for cerulenin treatment; np-AMPK = 3 independent experiments and np-ACC1 = 4 independent experiments. gi, As in ac, but for FASN knockdown; np-AMPK = 3 independent experiments and np-ACC1 = 4 independent experiments. j,k, ERK1/2 phosphorylation in cells treated with Fasnall. k, Quantification of ERK phosphorylation; n = 4 independent experiments. l,m, As in j,k, but for cerulenin treatment; n = 3 independent experiments. n,o, As in j,k, but for FASN knockdown; n = 4 independent experiments. p, Pharmacological inhibition of MEK–ERK signalling does not influence the effect of FASN inhibition on mTORC1; n = 2 independent experiments. q,r, Depletion of exogenous lipid sources does not influence the mTORC1 response to FASN inhibition. HEK293FT cells were cultured in full FBS- or charcoal-stripped FBS (CS-FBS)-containing media for 24 h, and then treated with 25 μM Fasnall for 30 or 60 min, or DMSO as the control (–). q, mTORC1 activity was assessed by phosphorylation of S6K. r, Measurement of intracellular TAG levels; n = 5 biological replicates. s,t, Immunoblots with lysates from control (−) or cerulenin-treated (50 μM, 4 h) MCF-7 cells, supplemented with BSA-conjugated palmitate (C16:0) or BSA as control. Cells were cultured in full FBS- or charcoal-stripped FBS (CS-FBS)-containing media for 24 h before the treatments. s, mTORC1 activity was assayed by phosphorylation of S6K. t, Measurement of intracellular C16:0 levels, indicating uptake of BSA-conjugated palmitate; nBSA = 4 and nC16:0 = 5 biological replicates. Data in graphs are shown as the mean ± s.e.m. *P < 0.05, **P < 0.005. Source numerical data and unprocessed blots are provided. Source data
Extended Data Fig. 6
Extended Data Fig. 6. Unlike ACC1/Acc1, ACC2/Hfa1 is not involved in the regulation of mTORC1/TORC1 by Mal-CoA.
ac, Unlike FASN inhibition by treatment with cerulenin, exogenous overexpression of WT or a hyperactive ACC1 mutant (ACC1S79A) is not able to significantly alter Mal-CoA levels and mTORC1 activity in mammalian cells. b,c, Quantification of S6K phosphorylation (b) and Mal-K levels (c); n = 3 independent experiments. df, Unlike ACC1 (see Fig. 4c–e), ACC2 knockdown does not restore the increase in Mal-CoA levels or rescue the downregulation of mTORC1 caused by silencing of FASN. e, Quantification of mTORC1 activity (p-S6KT389/S6K). f, Quantification of Mal-K levels (Mal-K/loading controls); n = 3 independent experiments. gi, C-terminal GFP tagging of the yeast ACC2 orthologue, Hfa1, does not affect TORC1 activity or cellular Mal-CoA levels. h,i, Quantification of Sch9 phosphorylation (h) and Mal-K levels (i); n = 3 independent experiments. Data in graphs are shown as the mean ± s.e.m. *P < 0.05, **P < 0.005. Source numerical data and unprocessed blots are provided. Source data
Extended Data Fig. 7
Extended Data Fig. 7. Blockage of FASN affects mTORC1 activity independently of AMPK and the GATOR1 complex.
ac, WT or AMPKα1/2 KO HEK293T cells were treated with 25 μM Fasnall (30, 60 min) or 50 μM Cerulenin (2, 4 h). b,c, Quantification of mTORC1 activity (p-S6KT389/S6K) for Fasnall (b), normalized to the respective DMSO-treated control, and cerulenin (c) treatment; n = 3 independent experiments. d,e, As in a, but for FASN knockdown. e, Quantification of mTORC1 activity (p-S6KT389/S6K), normalized to each siCtrl sample; n = 3 independent experiments. fh, As in ac, but in DEPDC5/RagA/RagC-triple-knockout cells. g,h, Quantification of mTORC1 activity (p-S6KT389/S6K) for Fasnall (g), normalized to the respective DMSO-treated control, and cerulenin (h) treatment; n = 3 independent experiments. i,j, As in fh, but for FASN knockdown. j, Quantification of mTORC1 activity (p-S6KT389/S6K), normalized to the respective siCtrl sample; n = 4 independent experiments. Data in graphs are shown as the mean ± s.e.m. *P < 0.05, **P < 0.005, ***P < 0.0005. Source numerical data and unprocessed blots are provided. Source data
Extended Data Fig. 8
Extended Data Fig. 8. Downregulation of mTORC1 activity following FASN inhibition occurs independently of its lysosomal localization.
a, Co-localization analysis, using confocal microscopy, of mTOR with LAMP2 (lysosomal marker) in HEK293FT cells treated with 25 μM Fasnall for the indicated times. Magnified insets and intensity plots for selected regions shown on the right. Scale bars, 5 μm. b, Quantification of co-localization from nDMSO = 124, nFasnall_30’ = 130 and nFasnall_60’ = 117 individual cells. Pooled data from four independent experiments. c,d, As in a,b, but inhibiting FASN with 50 μM cerulenin for the indicated times. c, Scale bars, 5 μm. d, Quantification from nDMSO = 103, nCeru_2h = 74 and nCeru_4h = 69 individual cells. Pooled data from three independent experiments. e,f, RagC stays lysosomal following FASN inhibition. As in c,d, but for RagC/LAMP2 co-localization. Scale bars, 10 μm. f, Quantification of co-localization from nDMSO = 49 and nCeru_4h = 48 individual cells. Data from a representative experiment of two independent replicates are shown. g,h, Constitutively active Rags that blunt the amino-acid-starvation response do not prevent mTORC1 downregulation by FASN inhibition. g, HEK293FT cells were transiently transfected with vectors expressing FLAG-tagged RagAQL and RagCSN mutants, or Luciferase (Luc) as the control and treated with 25 μM Fasnall for the indicated times, or amino-acid starvation media for 1 h. h, Quantification of mTORC1 activity (p-S6KT389/S6K), normalized to each DMSO-treated control; n = 3 independent experiments. i,j, Co-localization analysis of mTOR with LAMP2 in HEK293FT cells transiently expressing FLAG-tagged RagAQL and RagCSN mutants, or Luciferase (Luc) as control, and treated with 25 μM Fasnall. i, Scale bars, 5 μm. j, Quantification of co-localization from nLuc_DMSO = 47, nLuc_Fasnall = 50, nRag_DMSO = 52 and nRag_Fasnall = 60 cells. Data from a representative experiment of two independent replicates are shown. k, Specific staining of endogenous FASN shown by knockdown (siFASN) and immunofluorescence. Nuclei were stained with DAPI. Scale bars, 20 μm; n = 3 independent experiments. Data in graphs are shown as the mean ± s.e.m. *P < 0.05, **P < 0.005, ***P < 0.0005. Source numerical data and unprocessed blots are provided. Source data
Extended Data Fig. 9
Extended Data Fig. 9. Site-specific docking simulations for Mal-CoA, Ac-CoA and CoA in the catalytic pocket of mTOR.
a, The best three docking poses of Mal-CoA (shown in green) aligned to ATP (violet) in the mTOR catalytic pocket. The binding energy value (ΔGb) for each conformation is shown below the docking models. These conformations were selected as the starting point to perform all atom molecular dynamics simulations. b, As in a, but for acetyl-CoA (Ac-CoA), shown in cyan. c, As in a, but for Coenzyme A (CoA), shown in yellow. d, Representative acetyl-CoA (Ac-CoA) placement in the mTOR binding pocket (b). Hydrogen bonds between the compounds and the amino-acid residues of the mTOR catalytic pocket indicated by cyan dotted lines. e, As in d, but for Coenzyme A (CoA), shown in yellow. f, Time evolution of hydrogen bonds between the carbonyl group of Mal-CoA and the R2168 residue of wild-type mTOR are reported for the three replicates of the molecular dynamics simulations.
Extended Data Fig. 10
Extended Data Fig. 10. Mal-CoA binds and specifically inhibits mTORC1 without affecting complex composition and independently of mTOR malonylation, while mutant Tor1/mTOR in the Mal-CoA stabilization residues show decreased stability and/or activity.
a, Microscale thermophoresis experiment using purified TORC1 (containing GFP–Tor1) from yeast cells, confirming binding of Mal-CoA to TORC1; n = 3 independent experiments. b, Mal-CoA does not affect mTORC1 complex stability. Endogenous mTOR was immunoprecipitated in the presence or absence of 1 mM Mal-CoA (added directly in the lysates 5 min previous to addition of the antibody). Co-immunoprecipitation of Raptor and mLST8 assayed by immunoblotting; n = 2 independent experiments. c, Mal-CoA inhibits mTORC1 independently from mTOR malonylation. IVKs as in Fig. 8c using SBP-tagged WT or K1218R mutant mTOR and HA–Raptor in the presence or absence of 5 mM Mal-CoA. Reactions omitting ATP were used as negative controls; n = 2 independent experiments. d,e, Mal-CoA does not inhibit Snf1 in vitro. d, IVK assays as in Fig. 8a, but using purified Snf1 and His-tagged Mig1 as substrate, with the indicated concentrations of Mal-CoA. e, Quantification of Snf1 activity; n = 3 independent experiments. f,g, Src IVK assay as in Fig. 8c using Glo1 as a substrate, with the indicated amounts of Mal-CoA. g, Quantification of Src activity; n = 3 independent experiments. h,i, Stability of HA-tagged Tor1R2105/2107A mutant in vivo. i, Quantification of Tor1 protein levels normalized to Adh1; n = 3 independent experiments. j, In vitro stability of HA-tagged Tor1R2105/2107A mutant purified from yeast cells via TAP-mediated pulldown of Tco89; n = 2 independent experiments. k, The human SBP-tagged mTOR R2168A/R2170A mutant (mTORRR/AA) is relatively stable and binds other mTORC1 components similarly to WT mTOR. Streptavidin pulldown of WT or mTORRR/AA detecting binding to HA–Raptor and endogenous mLST8; n = 2 independent experiments. l, The mTORRR/AA mutant lacks catalytic kinase activity in vitro. IVKs as in Fig. 8c using SBP-tagged WT or mTORRR/AA and HA–Raptor in the presence or absence of 5 mM Mal-CoA. Reactions omitting ATP were used as negative controls; n = 2 independent experiments. Data are the mean ± s.d. (a) or mean ± s.e.m. (all other graphs). ***P < 0.0005. Source numerical data and unprocessed blots are provided. Source data

References

    1. Valvezan AJ, Manning BD. Molecular logic of mTORC1 signalling as a metabolic rheostat. Nat. Metab. 2019;1:321–333. doi: 10.1038/s42255-019-0038-7. - DOI - PubMed
    1. Fernandes SA, Demetriades C. The multifaceted role of nutrient sensing and mTORC1 signaling in physiology and aging. Front. Aging. 2021;2:707372. doi: 10.3389/fragi.2021.707372. - DOI - PMC - PubMed
    1. Kennedy BK, Lamming DW. The mechanistic target of rapamycin: the grand conducTOR of metabolism and aging. Cell Metab. 2016;23:990–1003. doi: 10.1016/j.cmet.2016.05.009. - DOI - PMC - PubMed
    1. Gonzalez A, Hall MN. Nutrient sensing and TOR signaling in yeast and mammals. EMBO J. 2017;36:397–408. doi: 10.15252/embj.201696010. - DOI - PMC - PubMed
    1. Castellano BM, et al. Lysosomal cholesterol activates mTORC1 via an SLC38A9–Niemann–Pick C1 signaling complex. Science. 2017;355:1306–1311. doi: 10.1126/science.aag1417. - DOI - PMC - PubMed

Publication types

MeSH terms