. 2023 Sep;26(9):1505-1515.
doi: 10.1038/s41593-023-01399-0. Epub 2023 Aug 10.

Modeling idiopathic autism in forebrain organoids reveals an imbalance of excitatory cortical neuron subtypes during early neurogenesis

Affiliations

Modeling idiopathic autism in forebrain organoids reveals an imbalance of excitatory cortical neuron subtypes during early neurogenesis

Alexandre Jourdon et al. Nat Neurosci. 2023 Sep.

Erratum in

Abstract

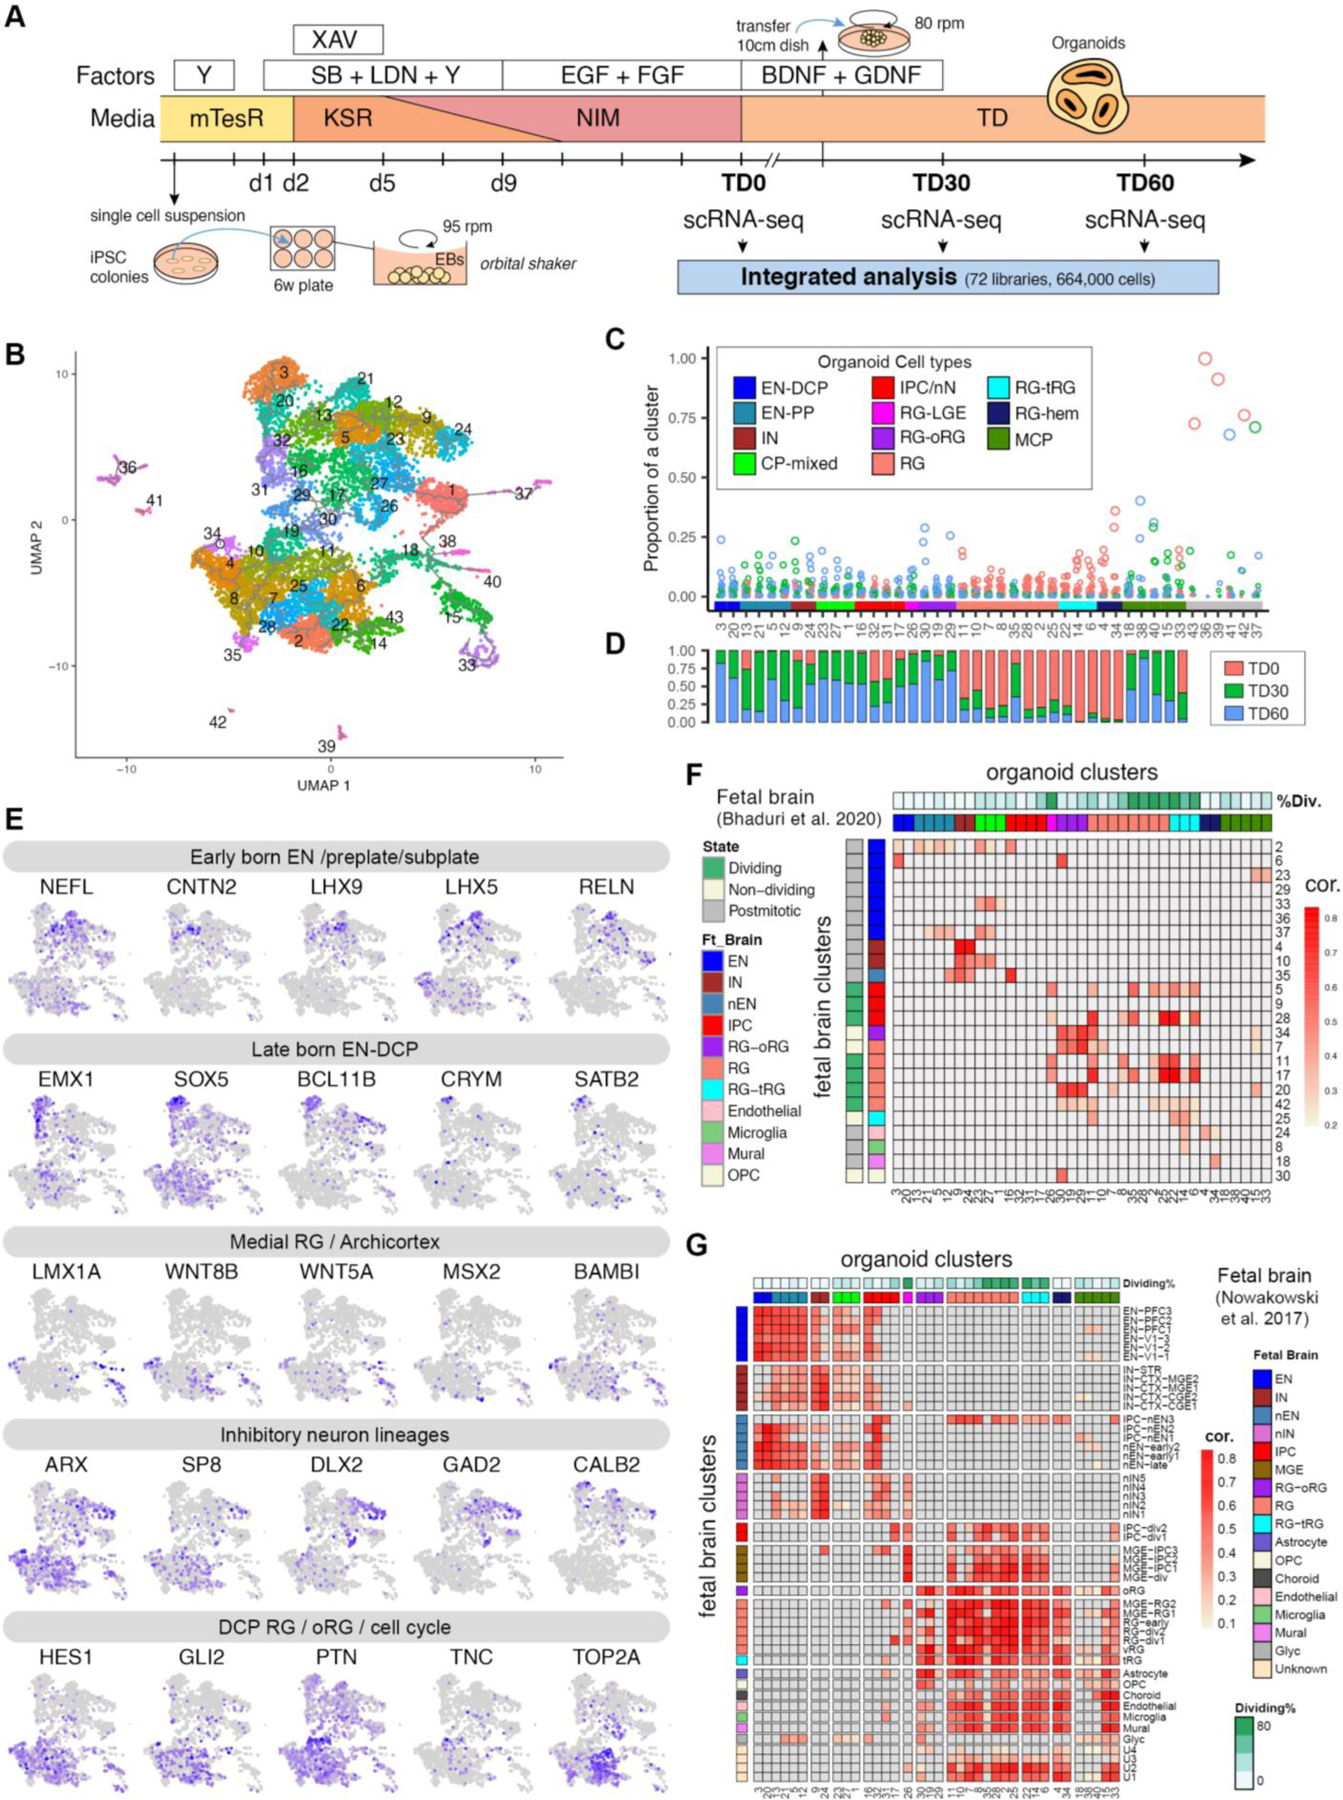
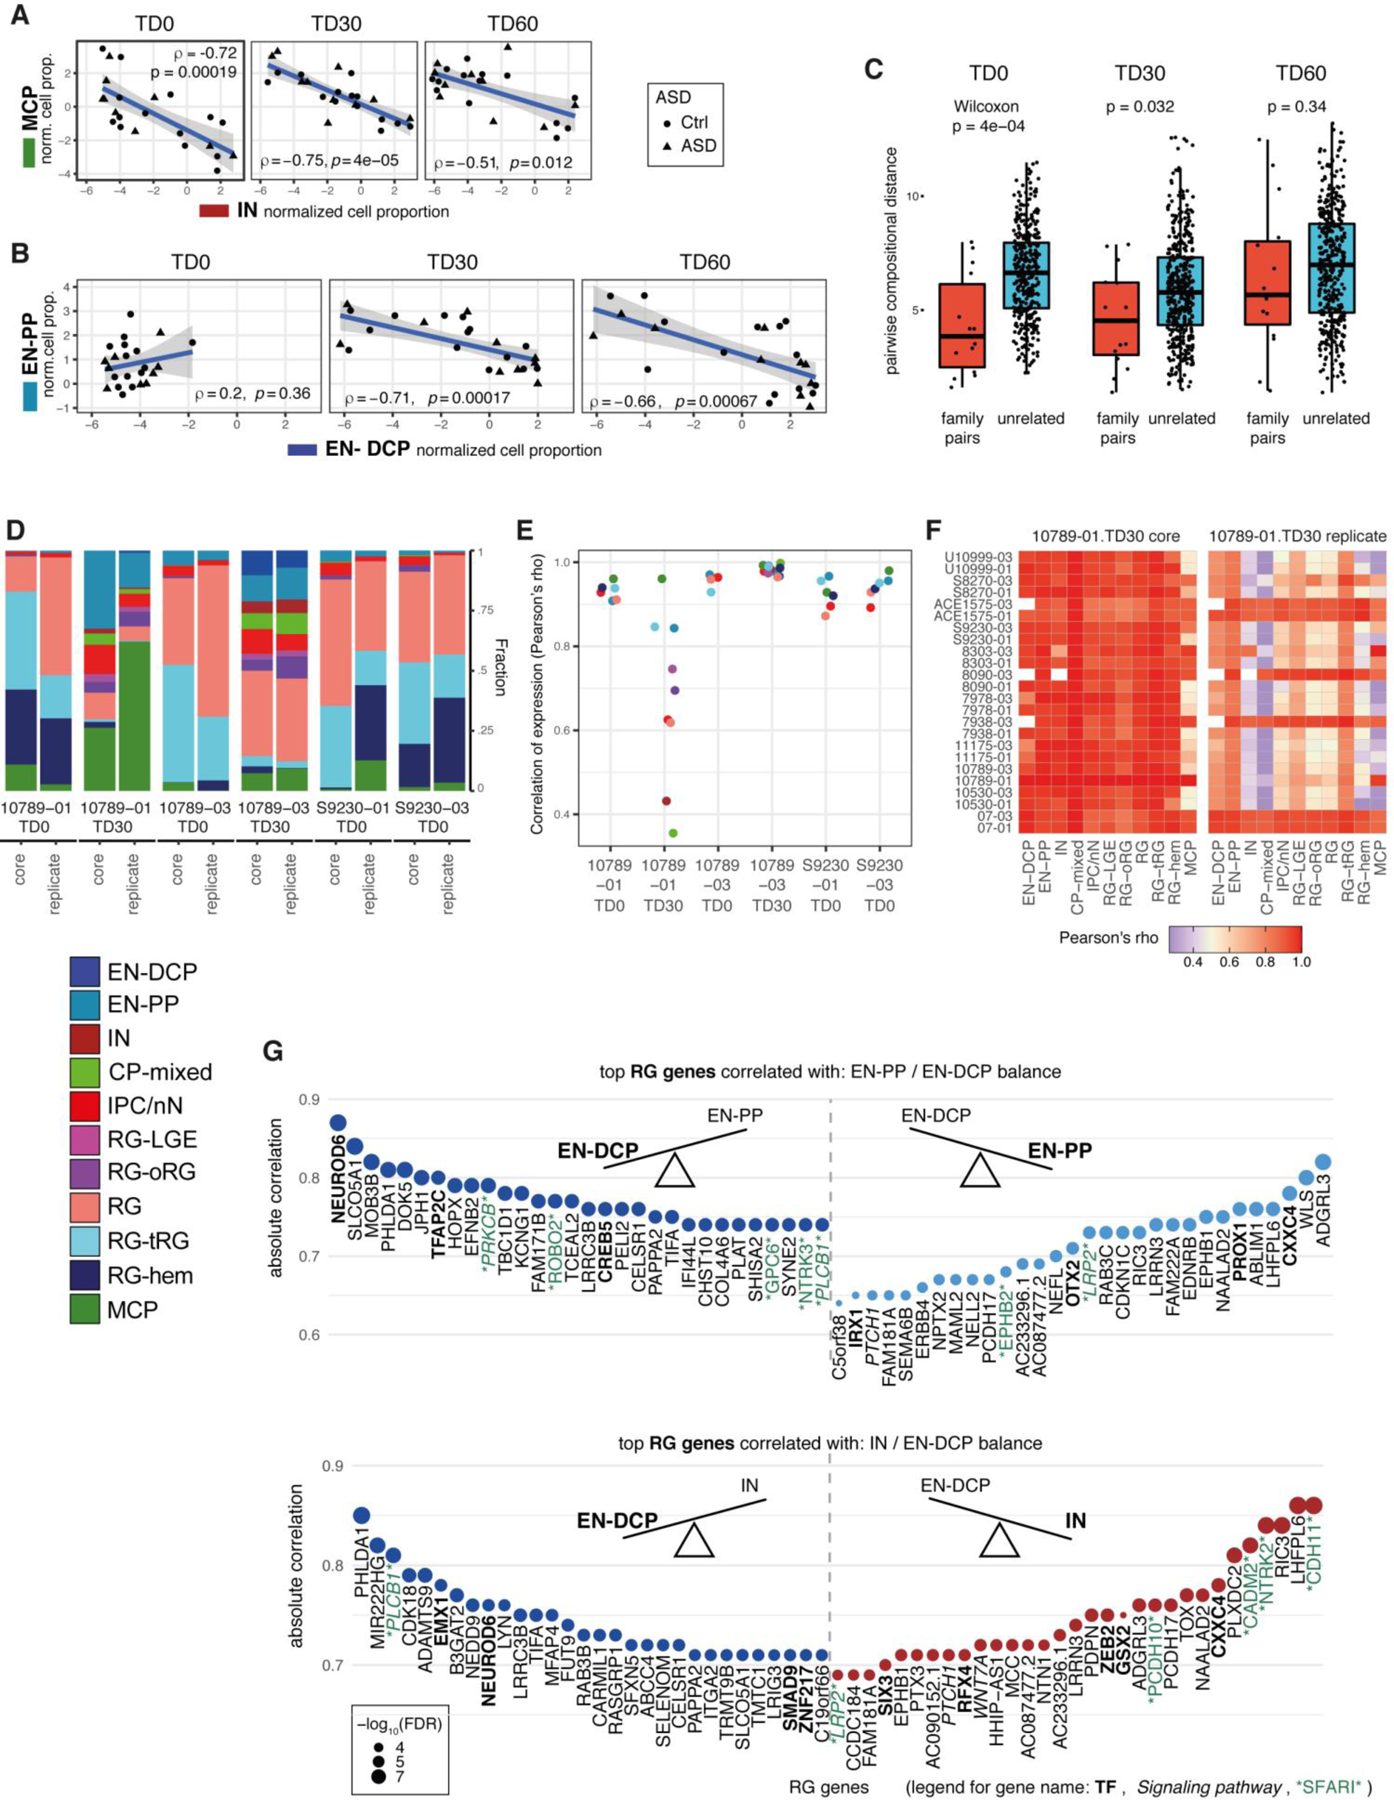
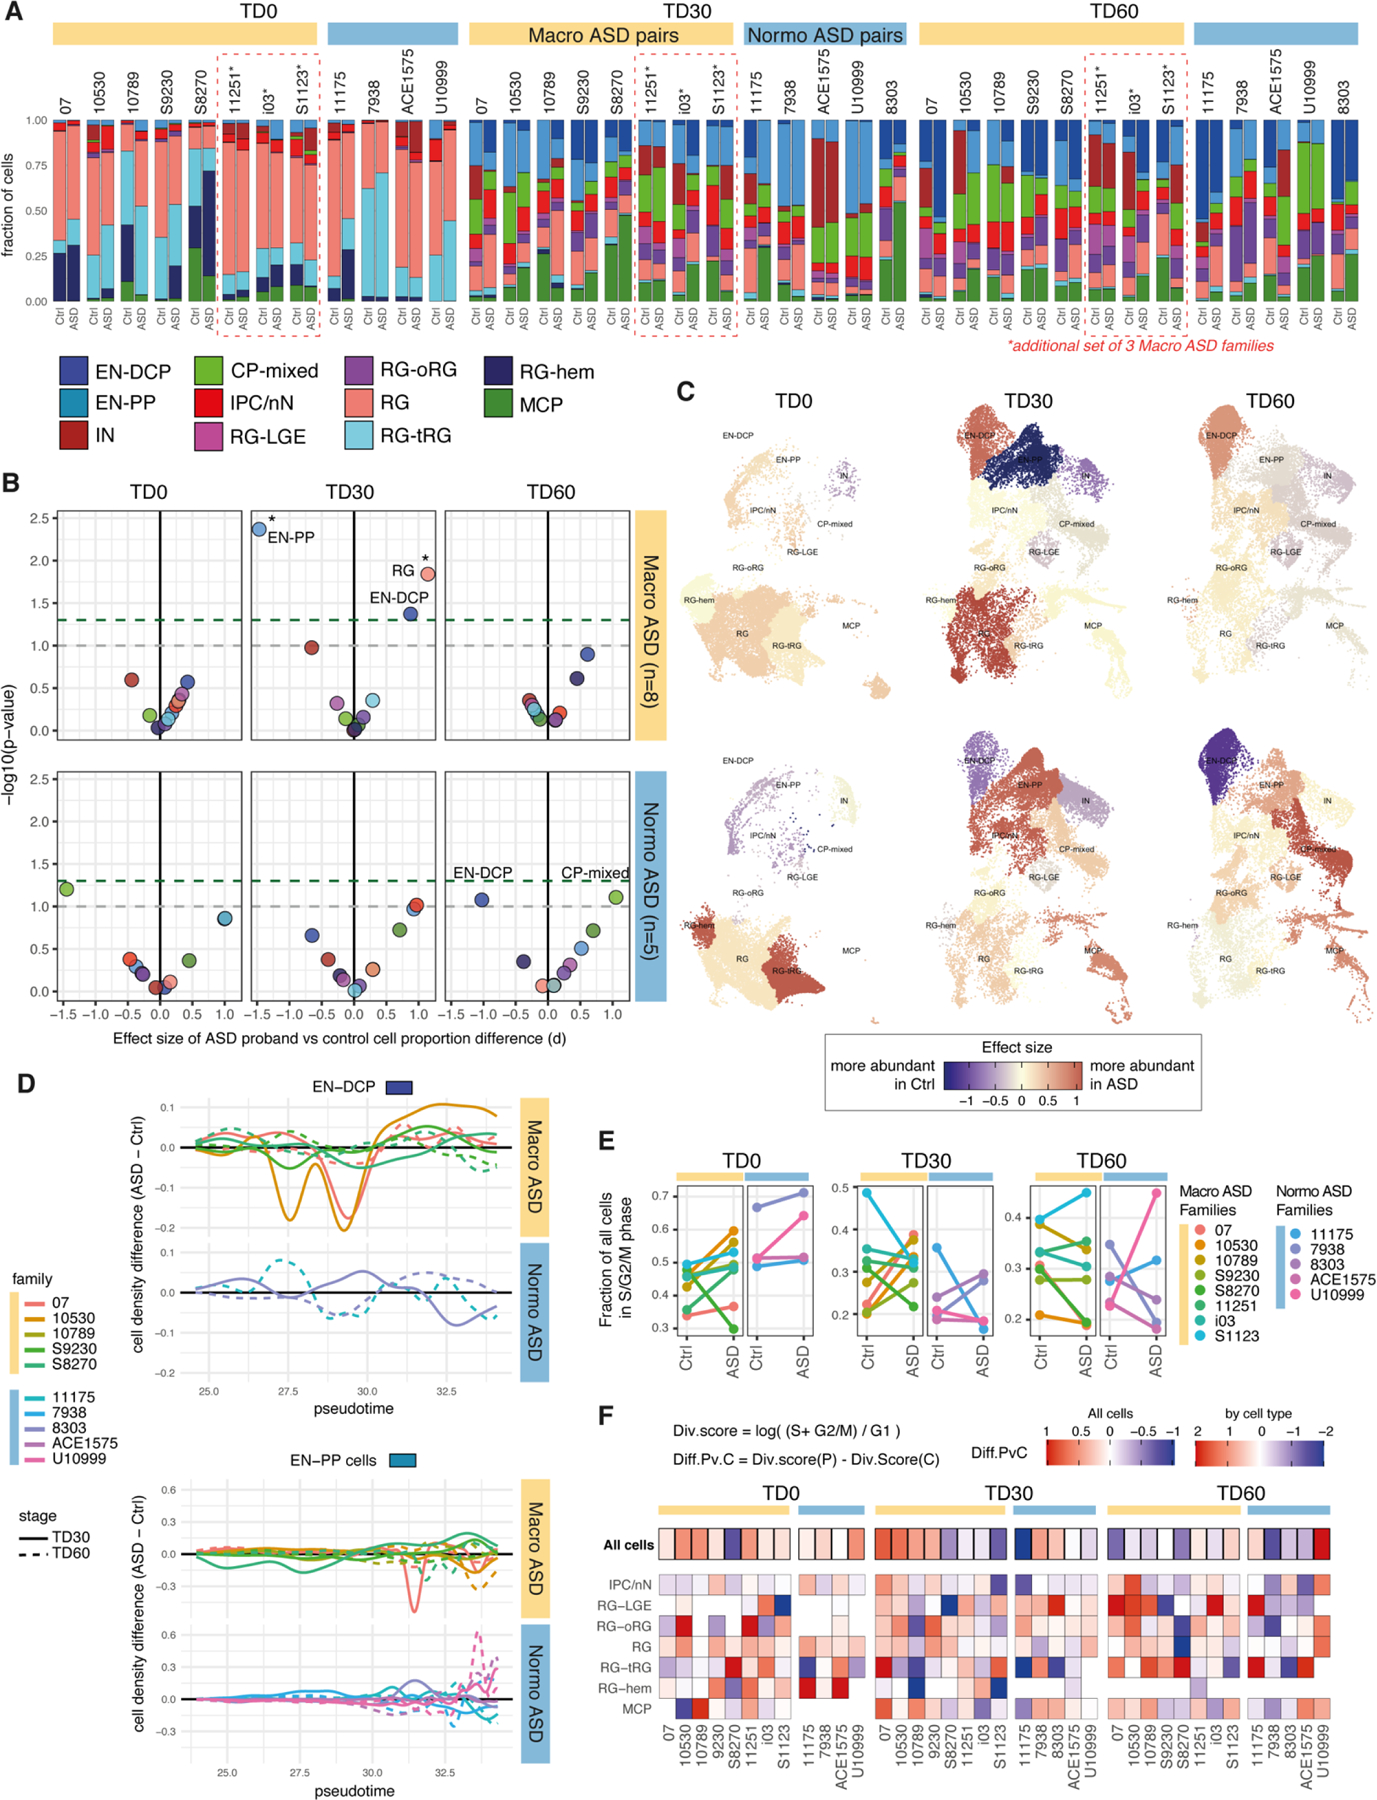
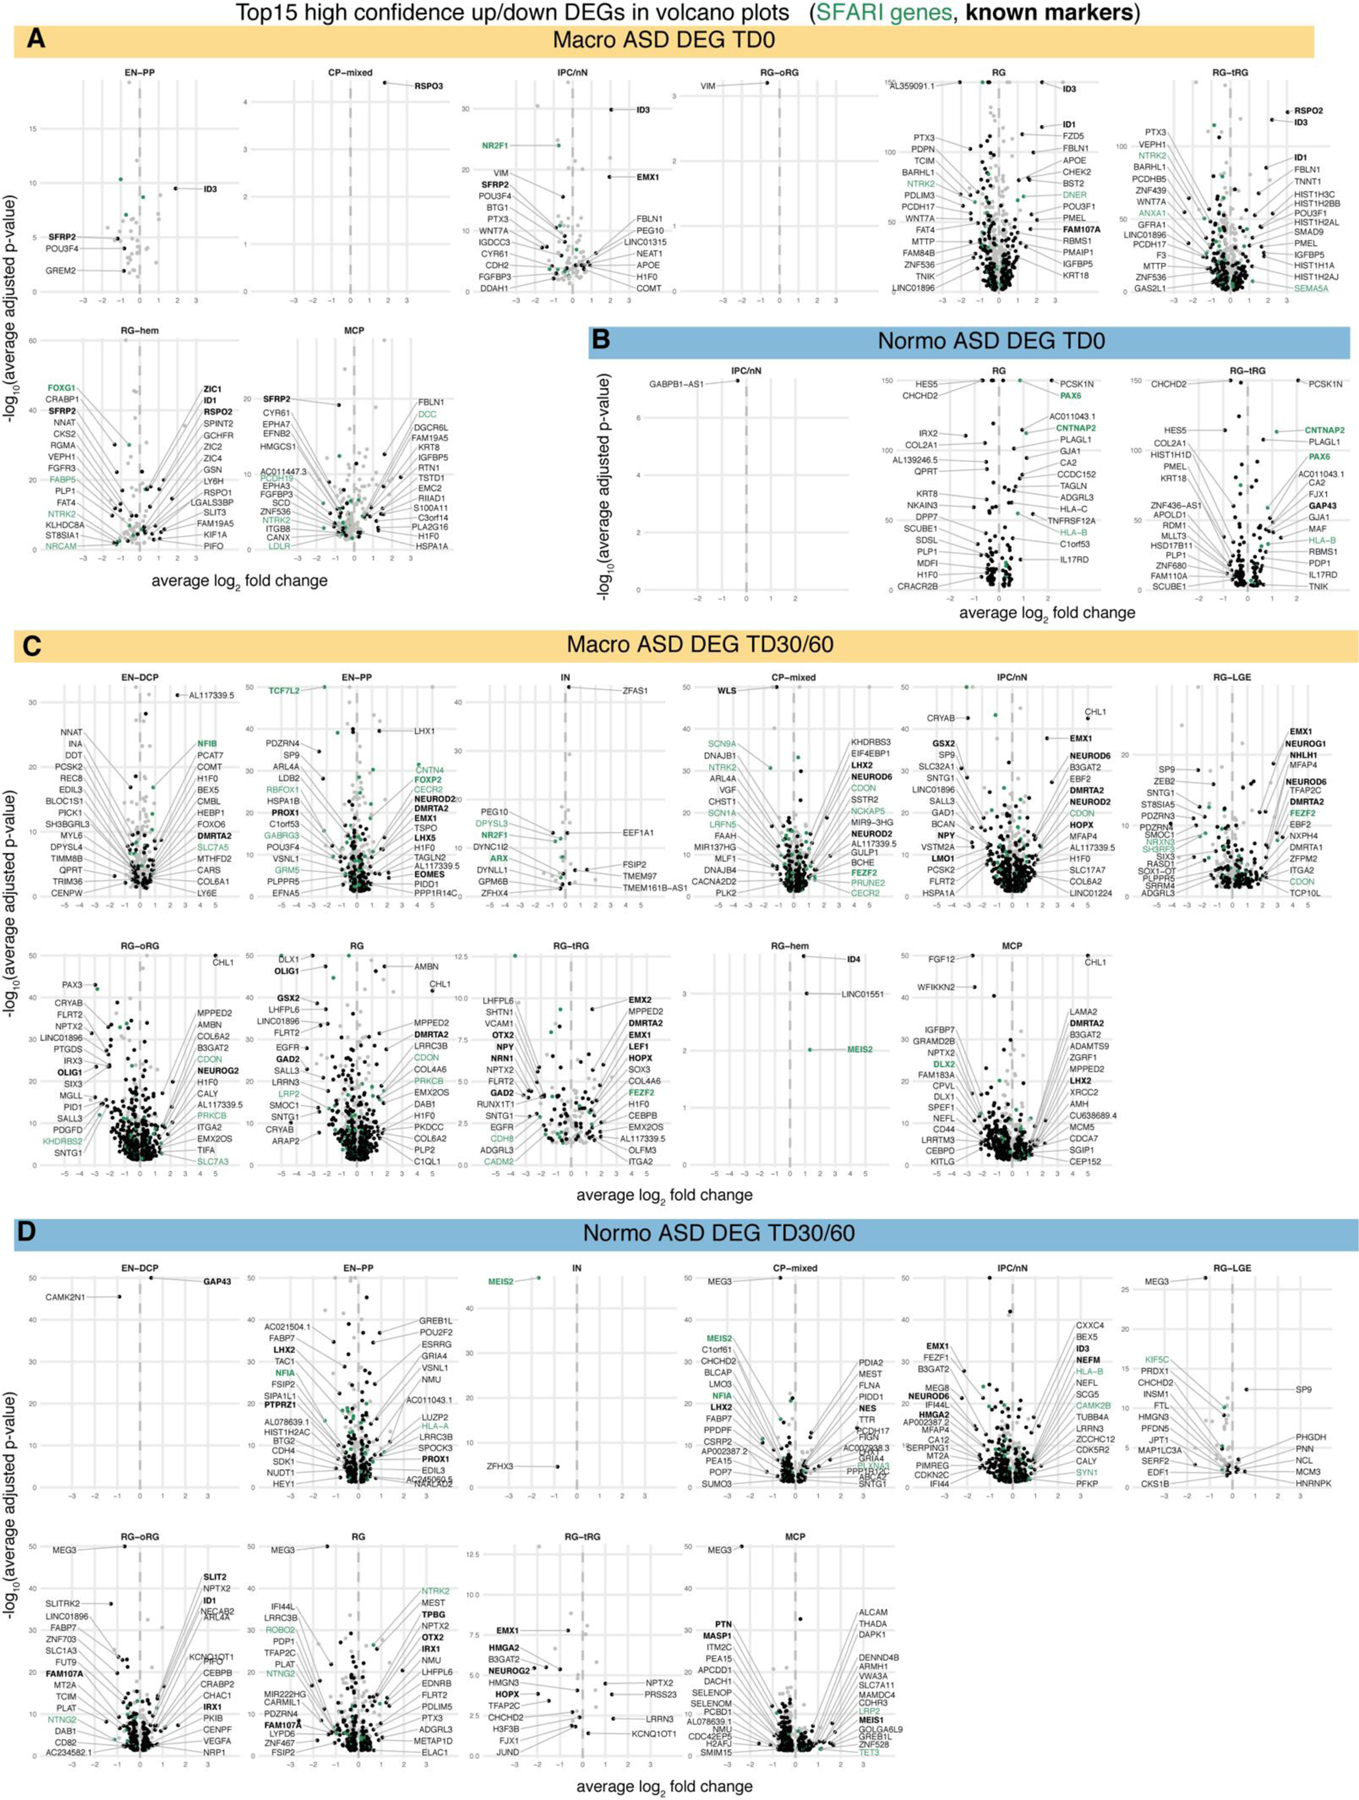
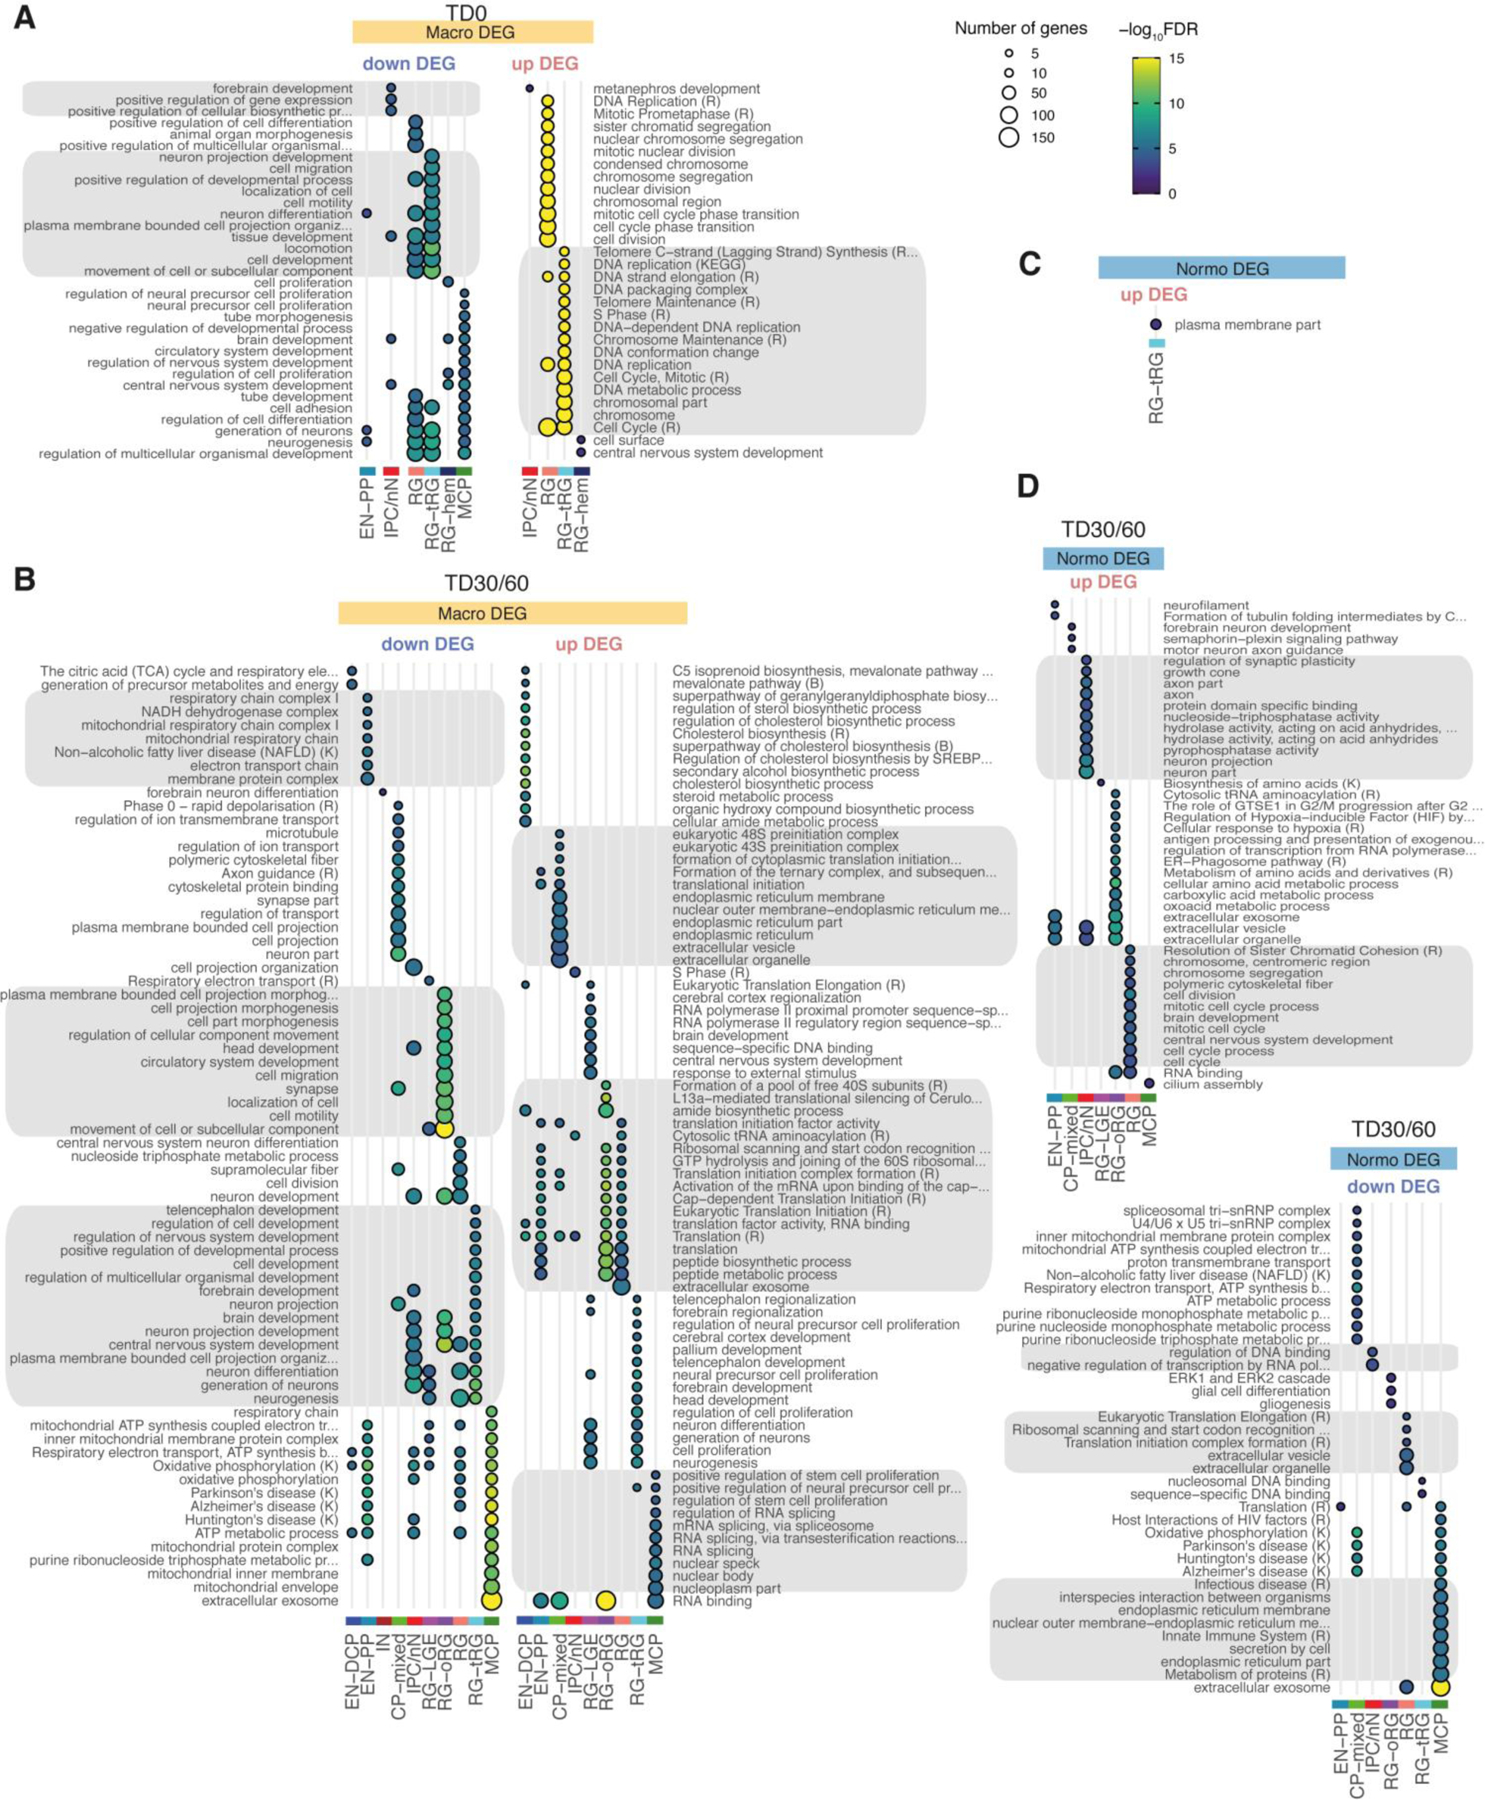
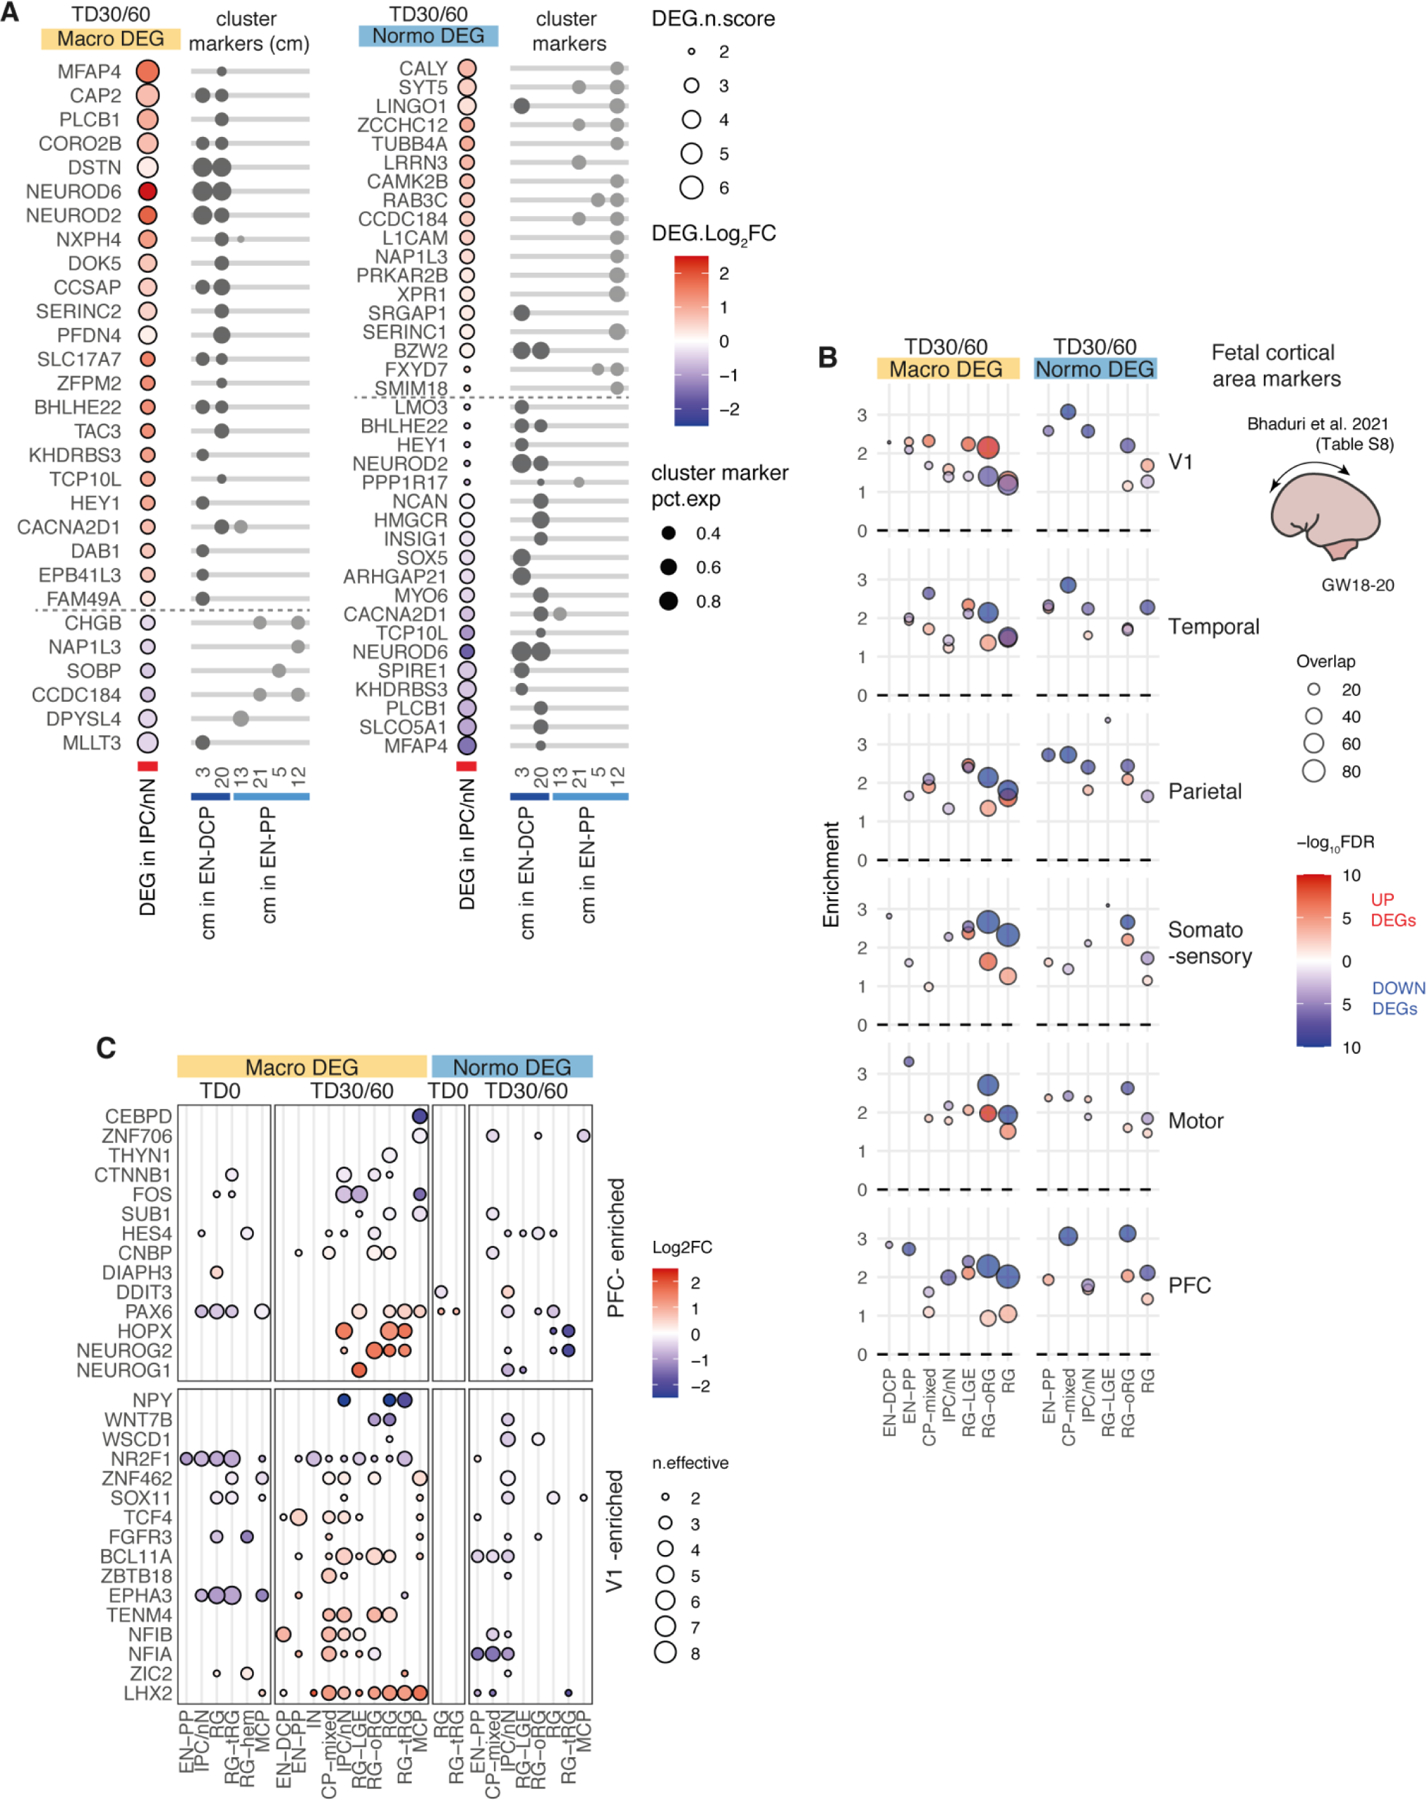
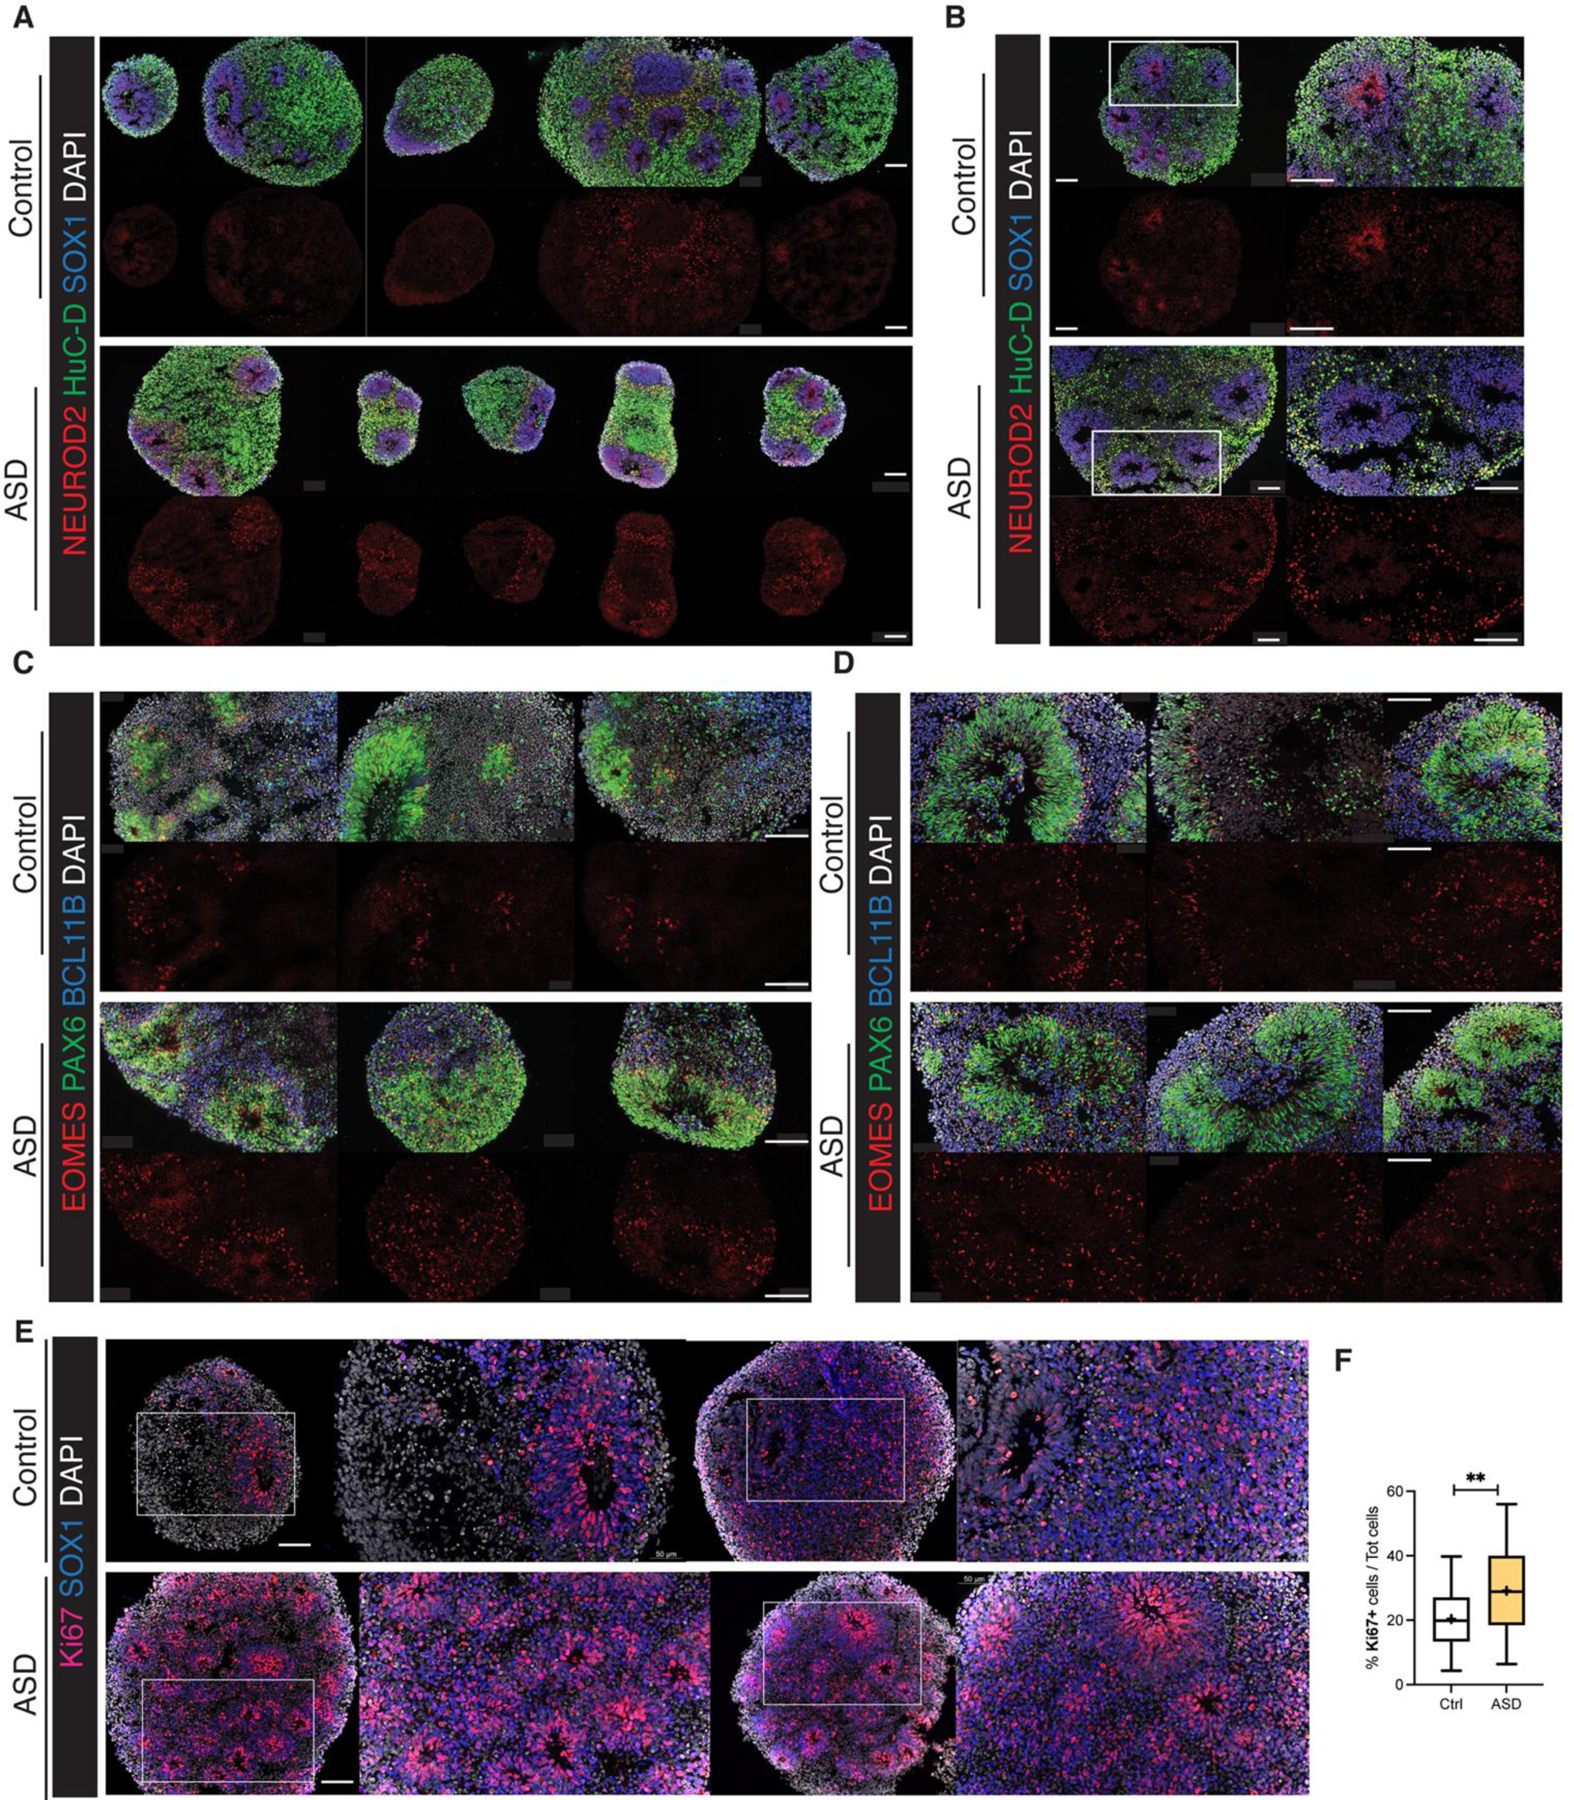
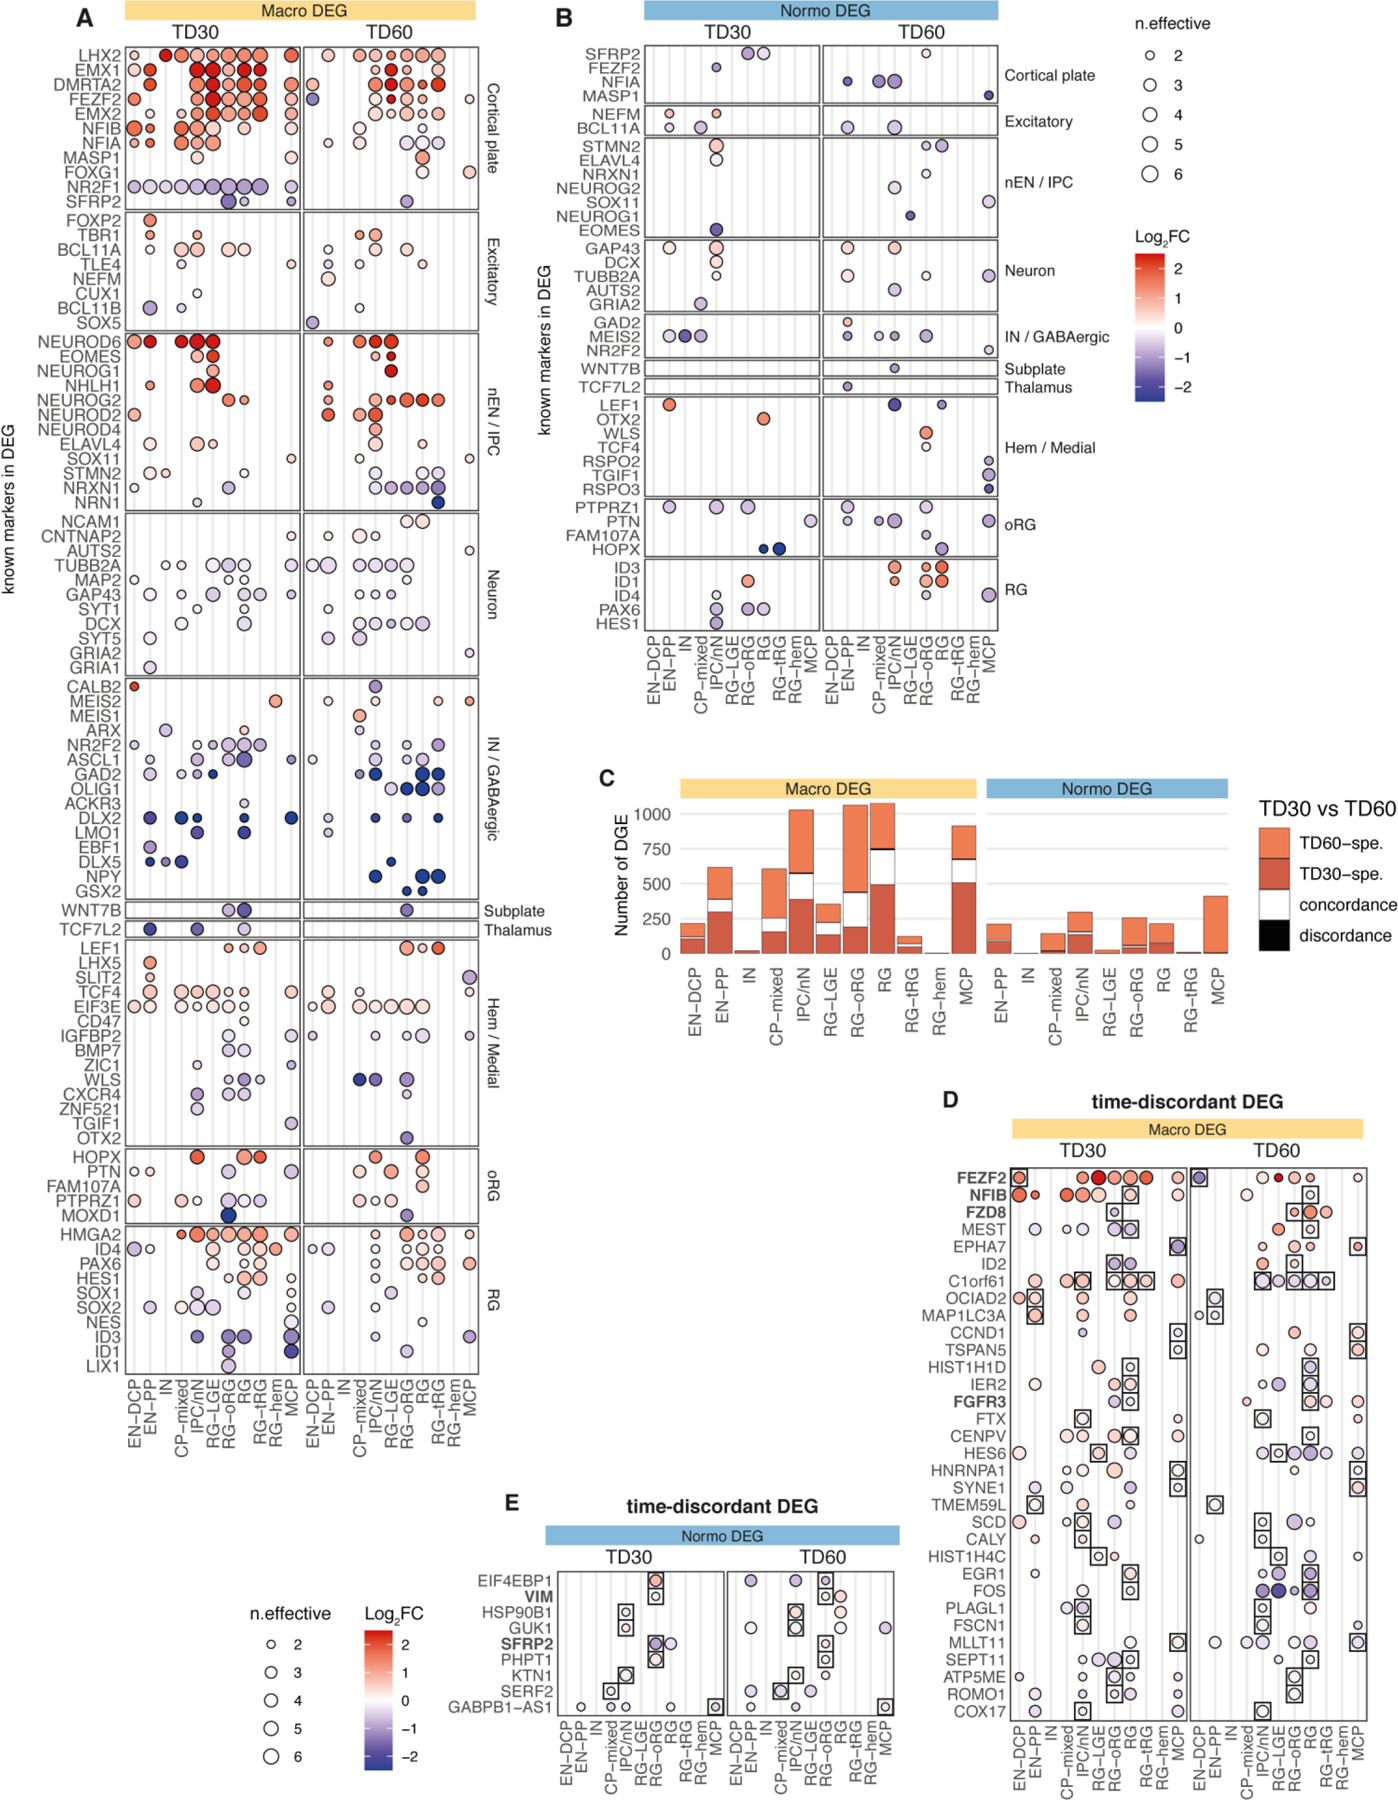
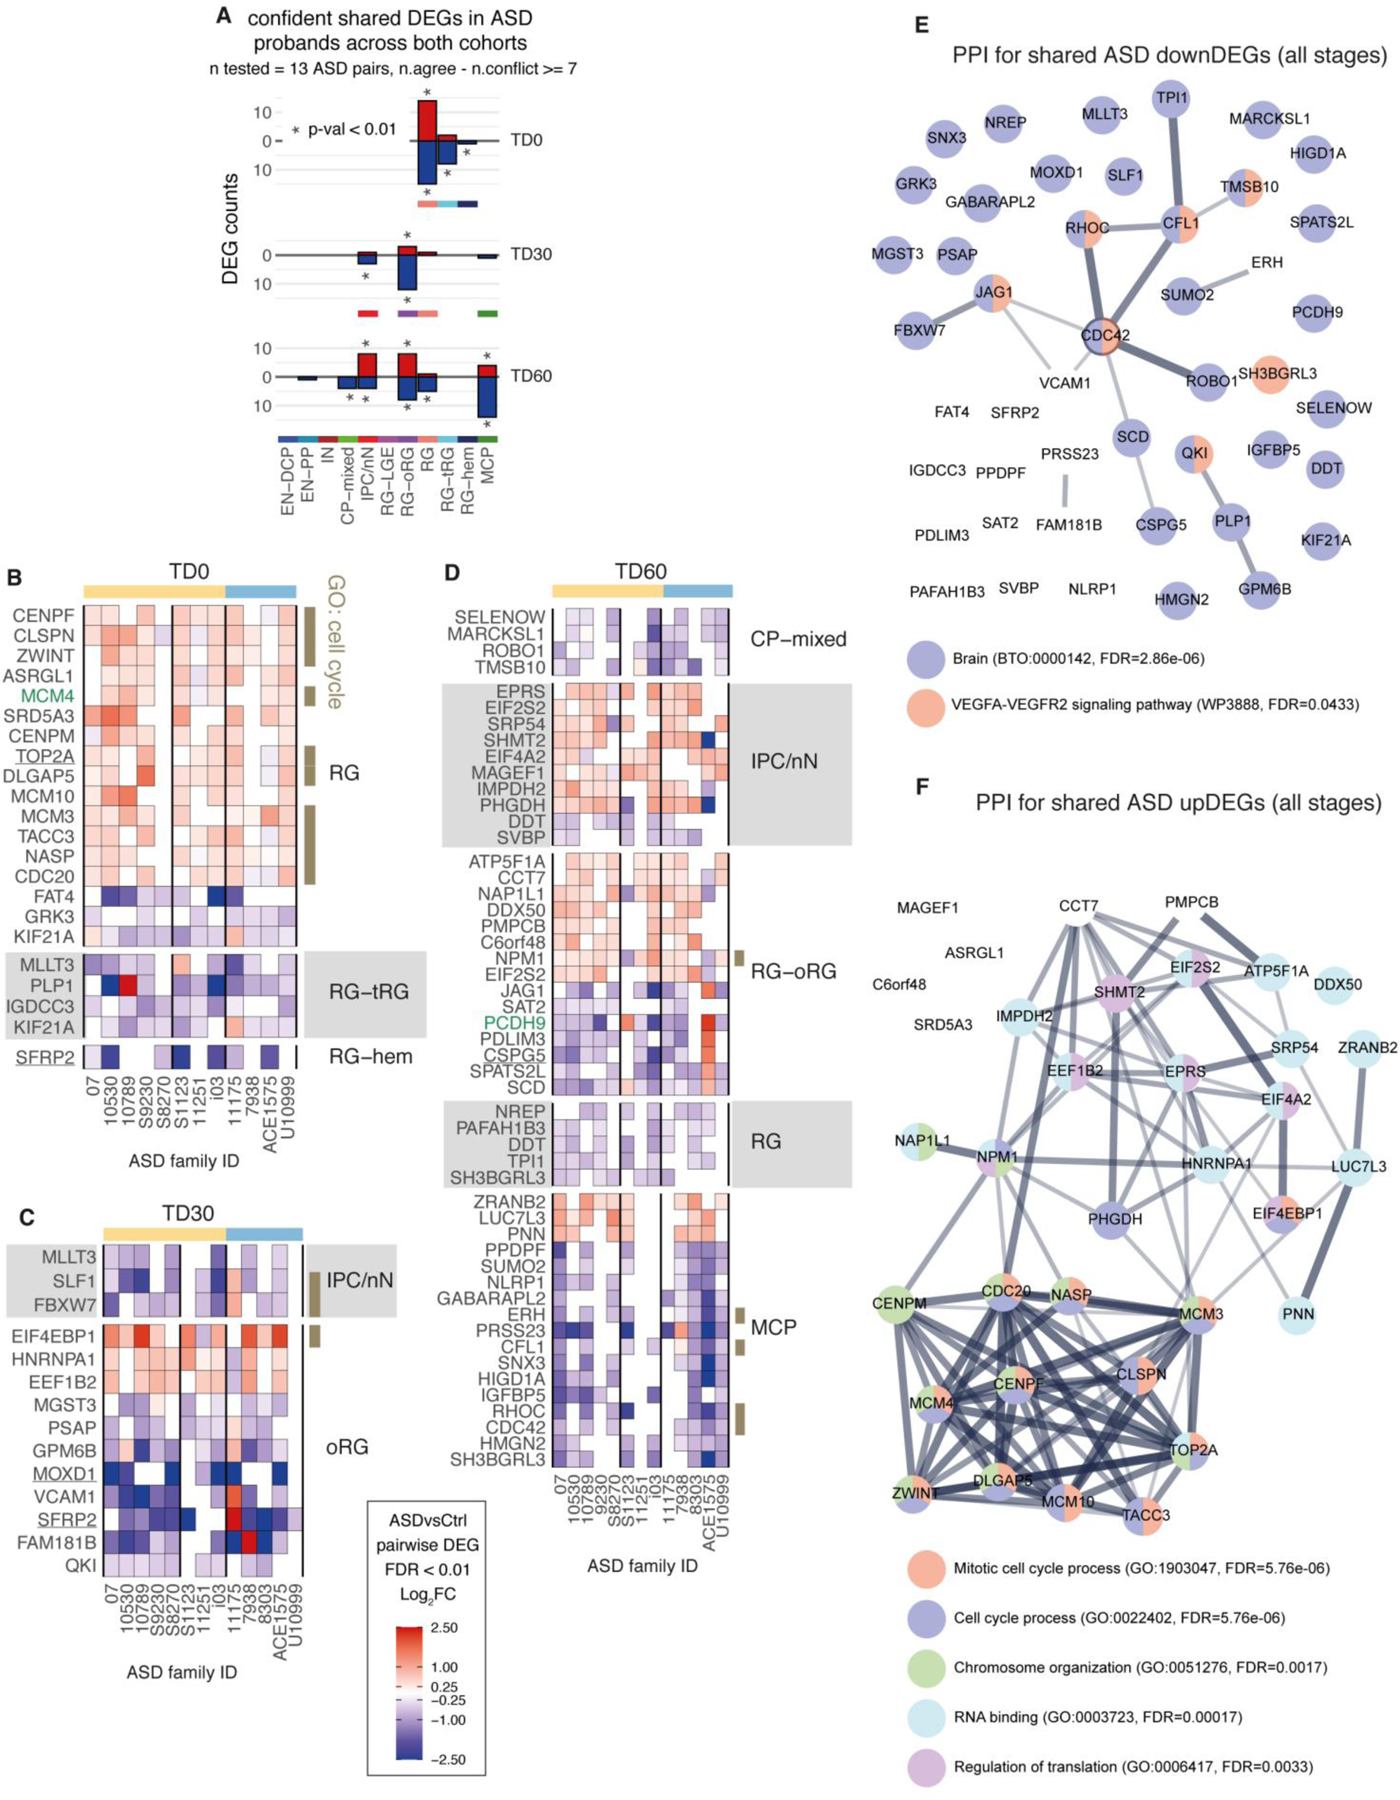
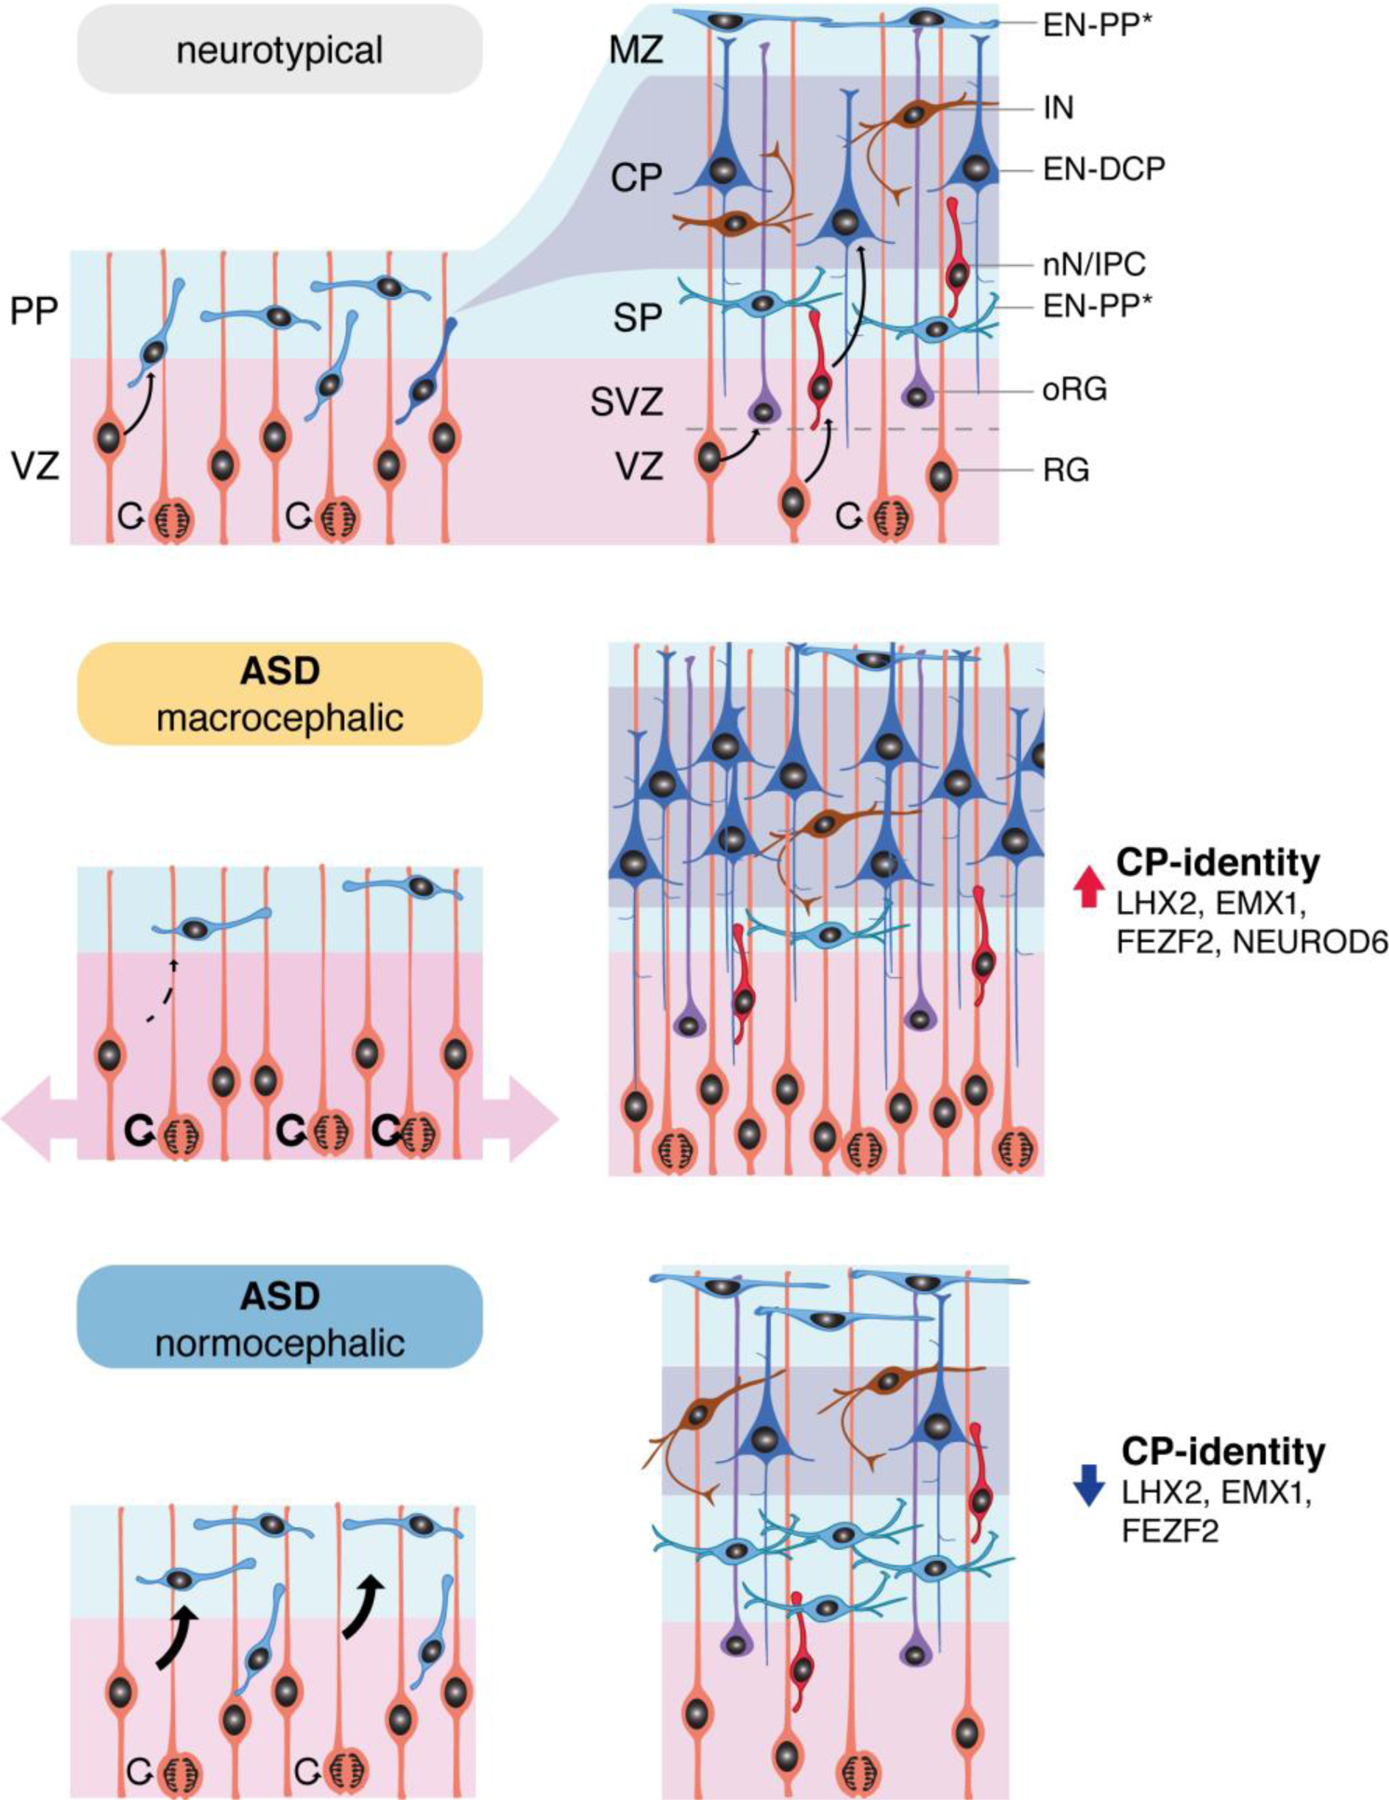
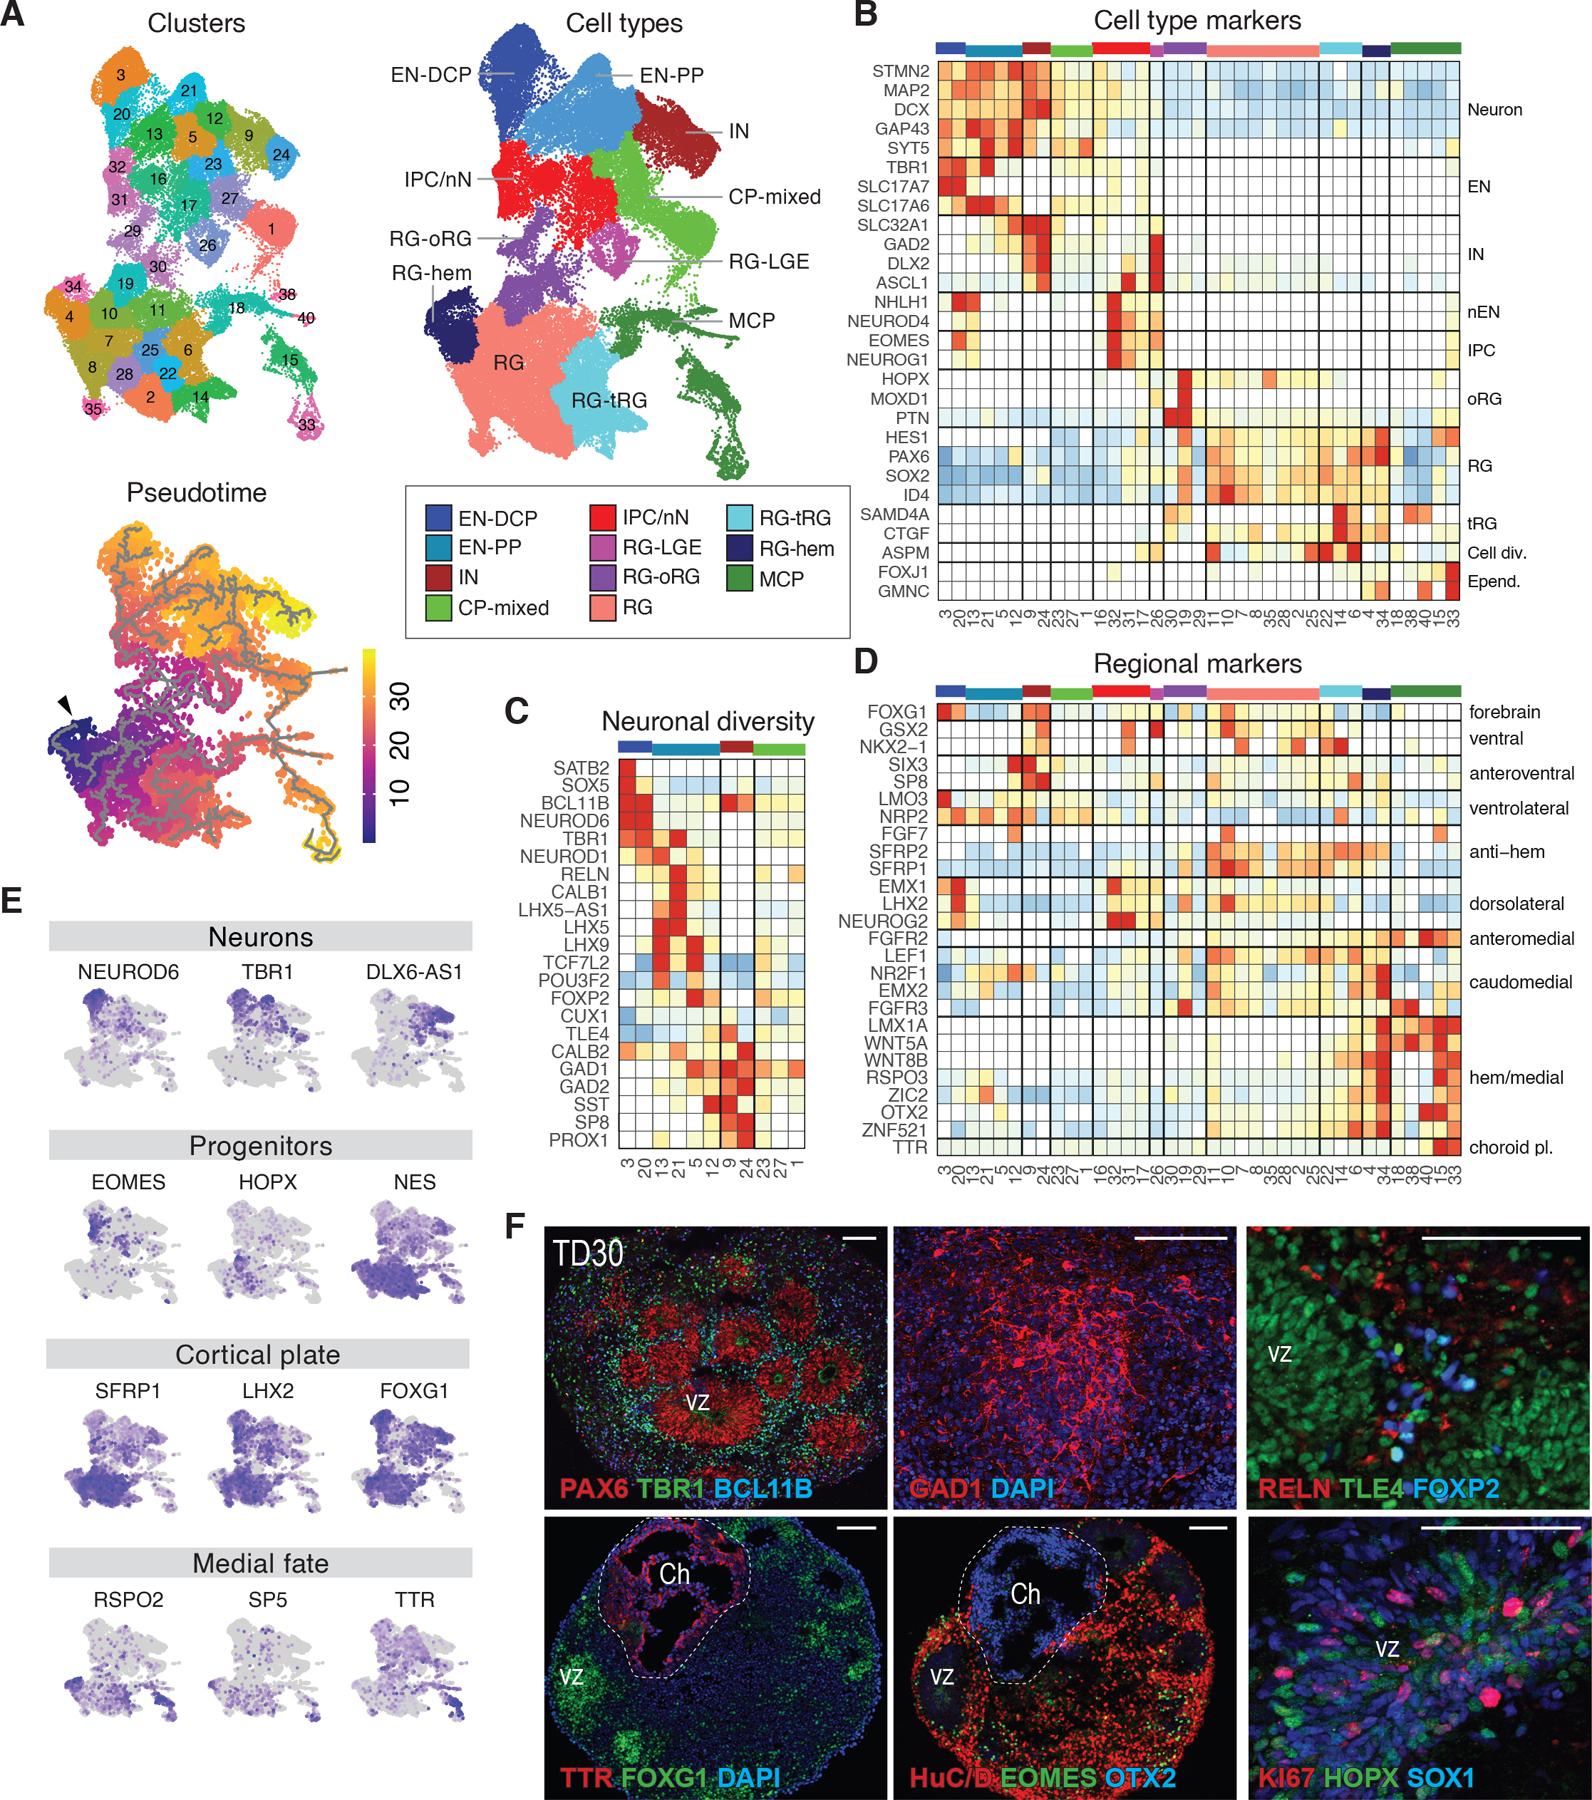
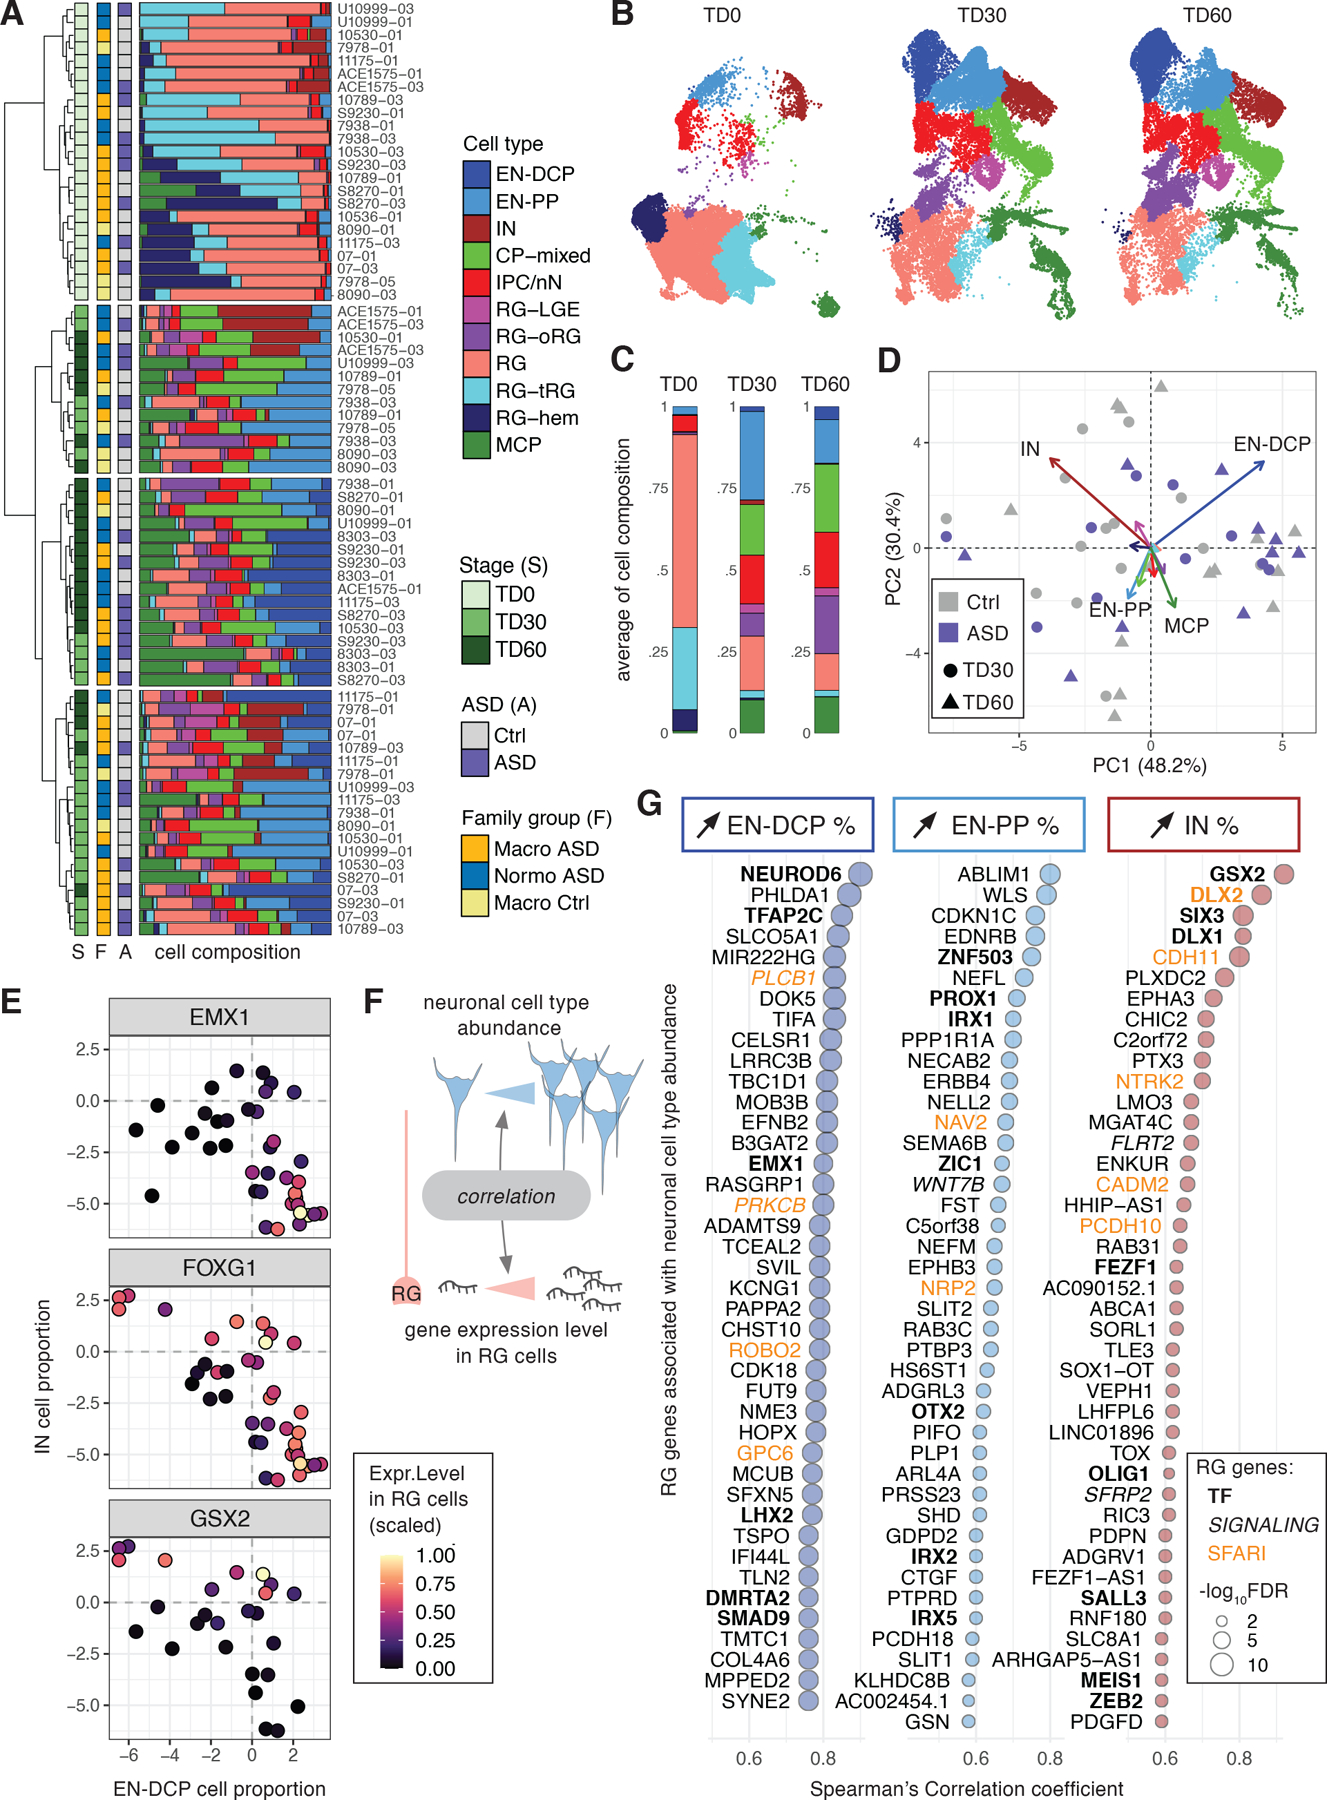
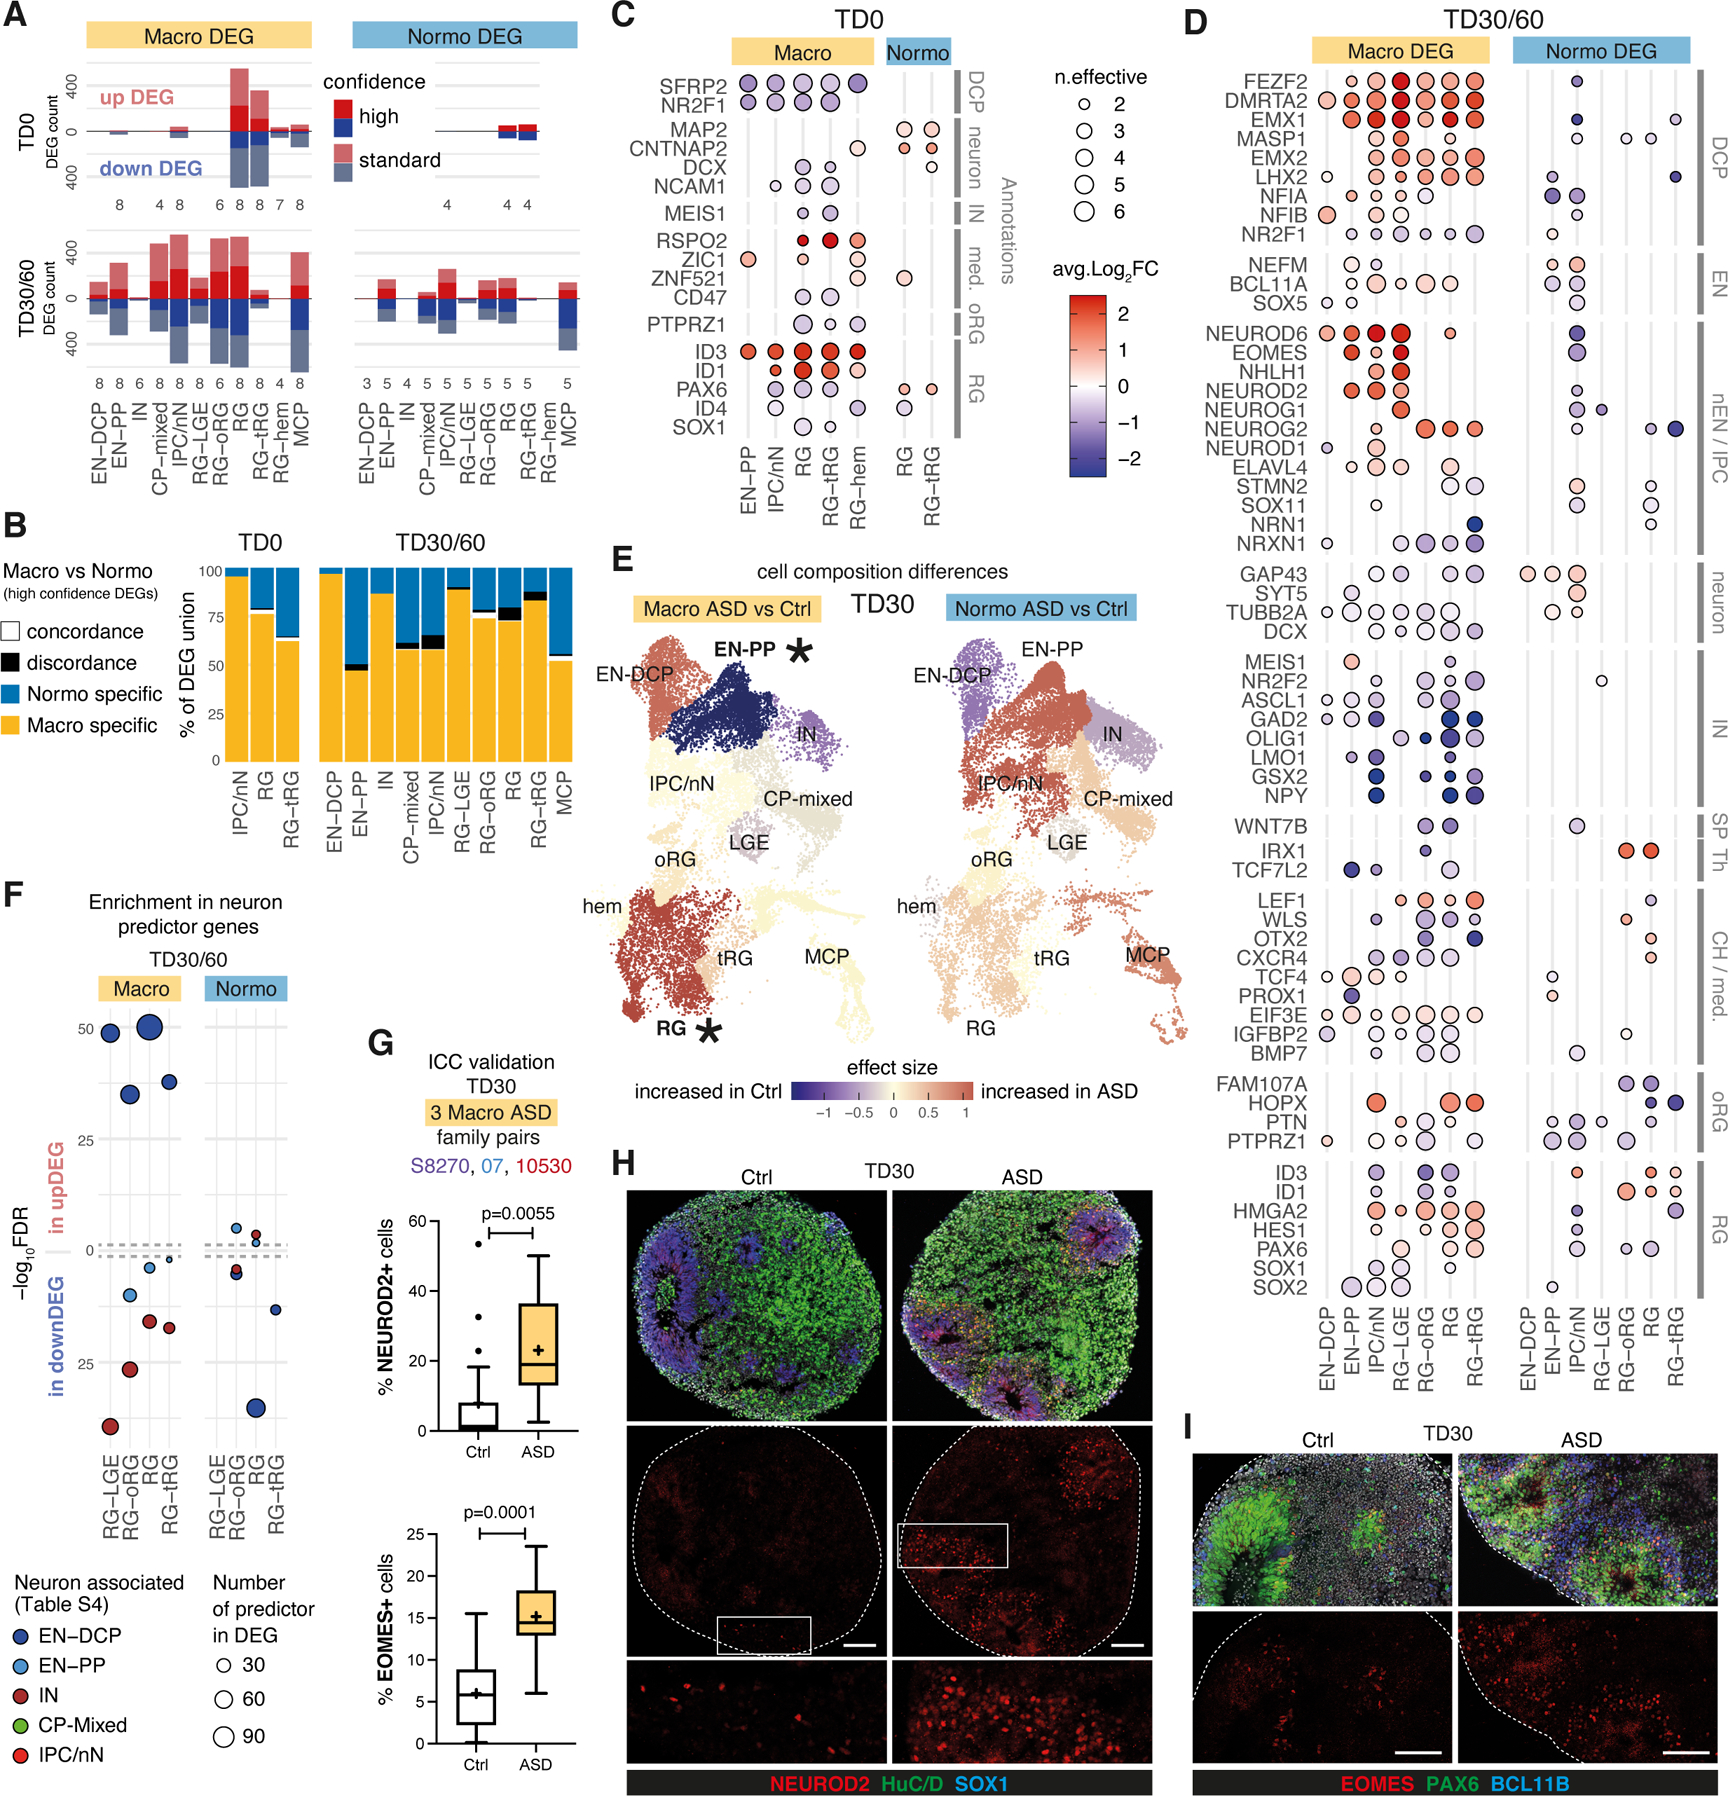
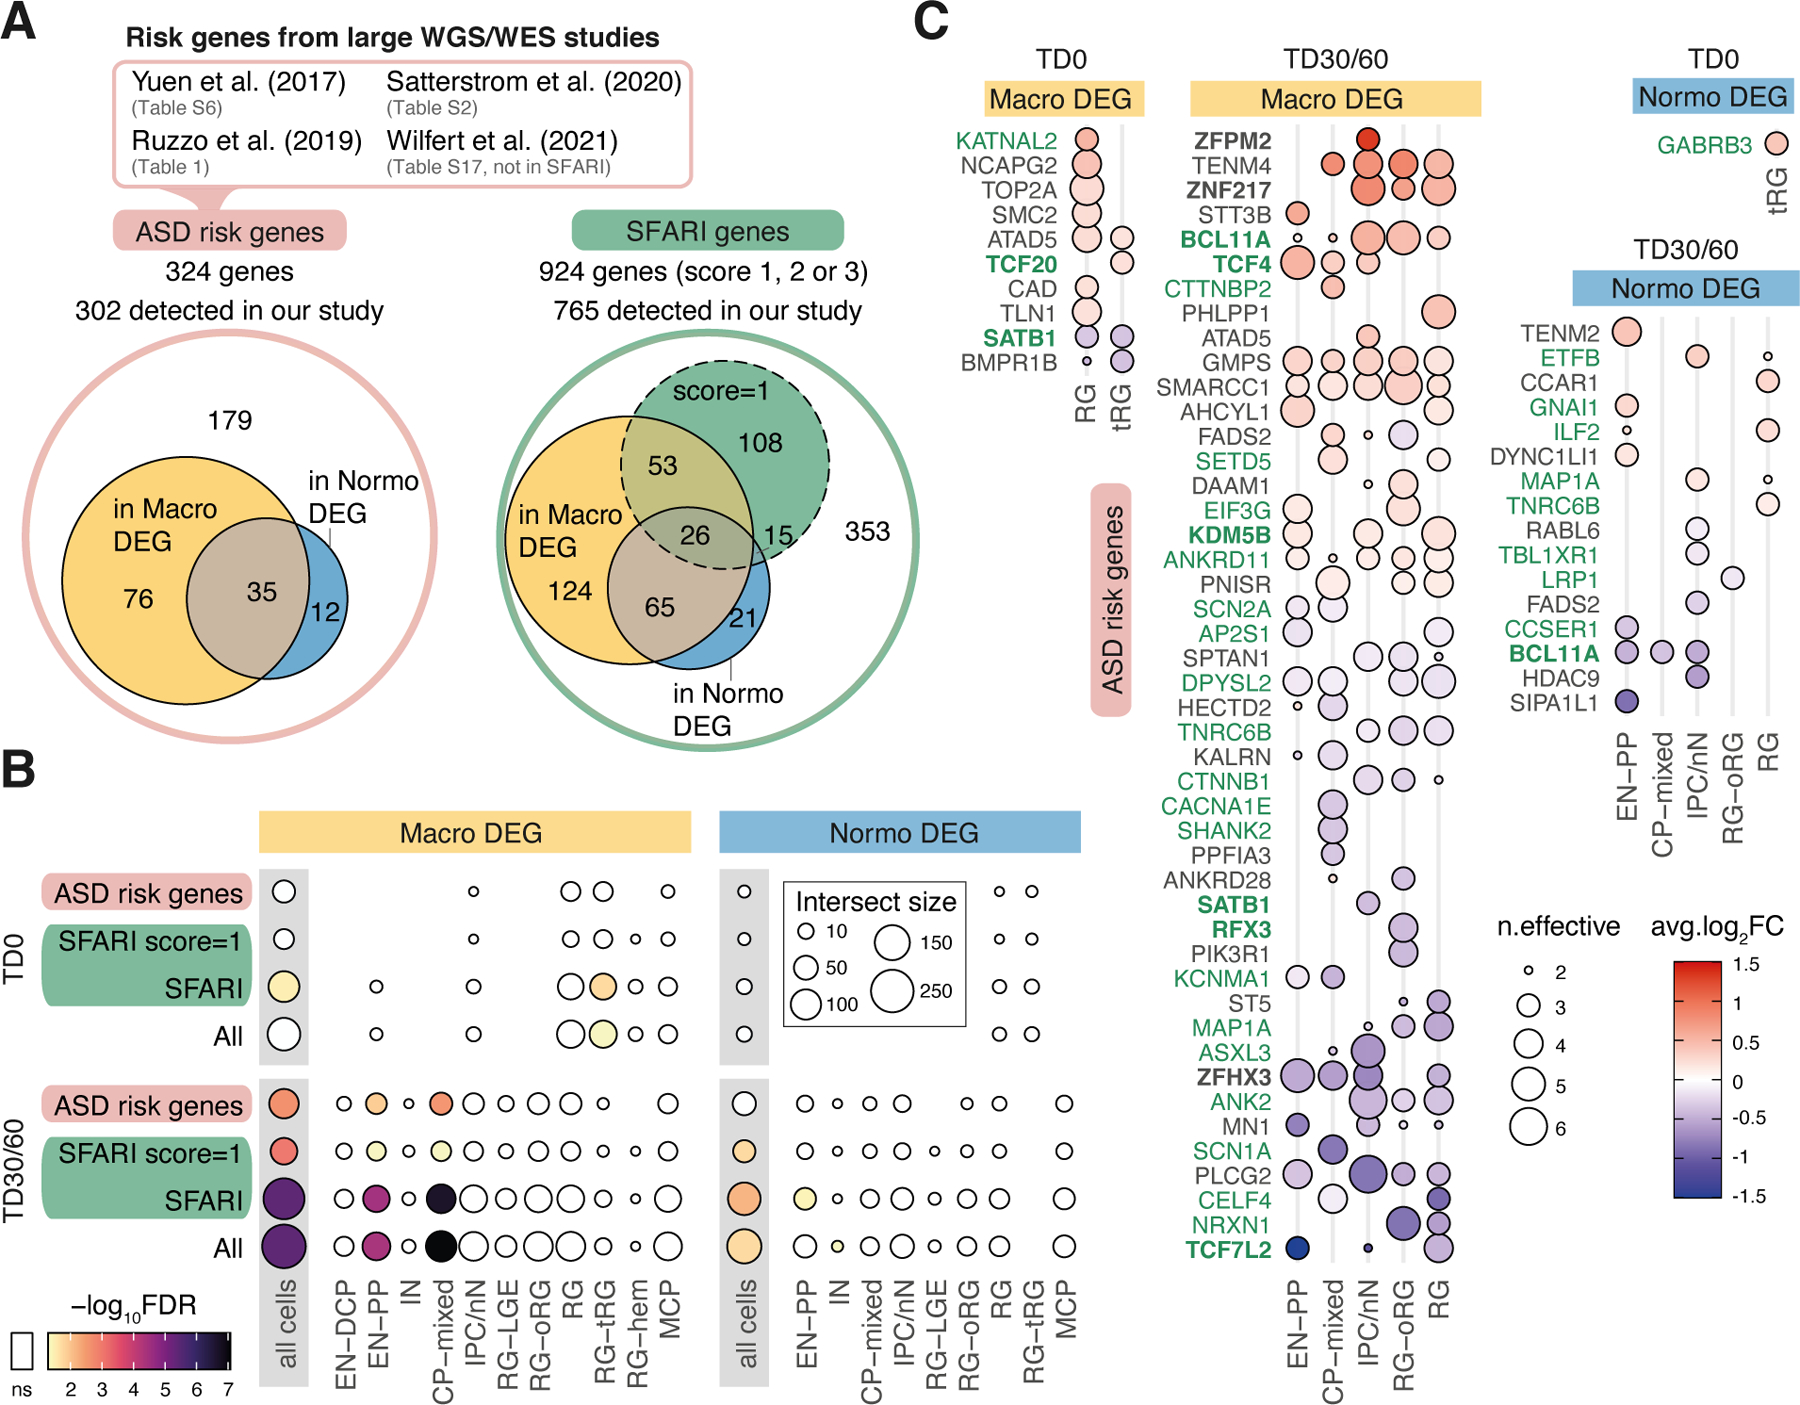
Idiopathic autism spectrum disorder (ASD) is highly heterogeneous, and it remains unclear how convergent biological processes in affected individuals may give rise to symptoms. Here, using cortical organoids and single-cell transcriptomics, we modeled alterations in the forebrain development between boys with idiopathic ASD and their unaffected fathers in 13 families. Transcriptomic changes suggest that ASD pathogenesis in macrocephalic and normocephalic probands involves an opposite disruption of the balance between excitatory neurons of the dorsal cortical plate and other lineages such as early-generated neurons from the putative preplate. The imbalance stemmed from divergent expression of transcription factors driving cell fate during early cortical development. While we did not find genomic variants in probands that explained the observed transcriptomic alterations, a significant overlap between altered transcripts and reported ASD risk genes affected by rare variants suggests a degree of gene convergence between rare forms of ASD and the developmental transcriptome in idiopathic ASD.


Conflict of interest statement

Competing Interests Statement:

The authors declare no competing interests

Figures

Extended Data Fig. 1.
Extended Data Fig. 1.. Characterization of the forebrain organoid preparation (Related to Fig. 1).
A. Outline of the forebrain organoid differentiation protocol with collection points (stages) (see Methods for description and abbreviations). This protocol used XAV939 (WNT inhibitor), SB431542 (TGFß/SMAD inhibitor), LDN193189 (BMP/SMAD inhibitor) to guide differentiation towards forebrain and avoided uncharacterized components such as feeder layers, co-cultures with external cell types, serum or matrigel. B. Full UMAP with all 43 clusters (generated from 72 samples involving 26 independent iPSC lines). C. Proportion of libraries in each cluster. Of note, the last six excluded clusters are generated mostly from one library. D. Contribution of each TD stage to cells in each cluster. E. UMAPs colored by expression levels of additional key genes of neurodevelopment (scaled from low (grey) to high (purple)). F. Correlation of cluster markers between organoids and fetal brain scRNA-seq clusters from Bhaduri et al. (2020). The percent of dividing cells in organoids clusters (%Div) is defined as the percentage of cells enriched for markers of the S, G2 or M phases of the cell cycle. Organoid clusters’ cell type annotation colors same as C. G. Correlation of cluster markers between organoid clusters and fetal brain clusters from Nowakowski et al. (2017). Organoid clusters’ cell type annotation colors same as C.
Extended Data Fig. 2.
Extended Data Fig. 2.. Cell composition analysis reveals relationships between cell types (Related to Fig. 2).
A. Correlation by stage between MCP and IN cell proportions (normalized as centered log ratios, CLR) showing an anticorrelation between the abundance of the two fates. Linear regression line and its standard error band is plotted, and Spearman correlation coefficient and p-value (two-sided) are indicated in each plot. B. Correlation by stage between EN-DCP and EN-PP cell proportions (CLR-normalized) showing an anticorrelation between the abundance of the two neurons at TD30/60. (plotted as in A) C. Boxplot showing the distribution per organoid stages (i.e., TD0, TD30, TD60) of pairwise distance in cell type composition from scRNA-seq analyses between any 2 samples (“unrelated”, in blue) and between samples from the same family differentiated together (“family pairs”, in red). (Boxplot: center line= median, box limits= upper and lower quartiles, whiskers= 1.5x interquartile range; dots= all values). P-value of a Wilcoxon test evaluating the differences between the two means is indicated above. D. Bar plots to compare cell type compositions in each pair of core and replicated scRNA-seq datasets. E. Dot plots to display Pearson’s correlations of per-cell-type expression between each pair of core and replicate dataset. Commonly detected genes between each pair are used for computing the correlation coefficient in each cell type (color coded as in C). F. Heatmaps to display Pearson’s correlations of per-cell-type expression between each 10789–01 TD30 dataset (core and replicate) and all core datasets at TD30. G. Top 30 RG genes associated in both directions with the balances of EN-PP/EN-DCP cells (top) and IN/EN-DCP (bottom), as shown by the absolute Spearman’s correlation coefficient (y axis, FDR < 0.05) between the expression of the indicated gene in RG and the cell ratio (EN-PP/EN-DCP) using data from all samples (n=48). TFs are in bold, SFARI genes are flanked by asterisks and members of signaling pathways are in italic. The complete set of data are shown in Table S4.
Extended Data Fig. 3.
Extended Data Fig. 3.. Differential cell composition analysis between paired ASD and controls (Related to Fig. 2 and 3).
A. Bar plots of cell type composition for all ASD family pairs, including the 10 core families and the 3 additional families i03, S1123 and 11251 (Supplementary Table 2, T3 “additional” dataset). To integrate new samples with the core analysis presented in main Fig. 1 and 2, cell type identification for the additional scRNA-seq libraries were obtained using “label transfer” function from Seurat package. B. Dot plots showing effect size (Cohen’s d, x axis) and p-value (y axis) of a two-sided paired t-test evaluating differences in normalized cell type proportions (centered log ratio) between ASD probands and controls, separated by cohorts (macro: n=8 pairs; normo: n=5 pairs) and stages. Grey dashed line=pval<0.1, green dashed line=pval<0.05; FDR < 0.1 are indicated by a star. The strongest cell composition changes can be observed at TD30 in Macrocephalic ASD with an increase of RG and EN-DCP, balanced by a decrease of EN-PP and, with less significance, a decrease in IN. While they do not meet statistical significance, trends are almost reverted in normo-ASD, with a decreased EN-DCP at TD60 (p-val=0.084), and a corresponding increase in CP-mixed (pval=0.078), MCP (pval>0.1) and EN-PP (pval>0.1). Compositional data analysis was also verified using a second approach, Bayesian modeling, confirming the significance of the opposite EN-DCP imbalance observed in macro and normo-ASD (Supplementary Fig. 4) C. UMAP plot colored by the effect size of the difference in cell composition between ASD probands and controls separated by cohort and stage. Cells were subsampled to 2000 per library and colored by effect size, as reported in B. In this representation, the change in cell proportion is put in perspective with the actual number of cells present in each cell types (i.e., large changes in small cell types have less influence on the final composition). D. Line plots showing pairwise differences between ASD and controls in cell distribution along pseudotime axis (x-axis) for the EN-DCP and EN-PP neuronal cell types (refer to Fig. 1A for pseudotime trajectory plot). Only pairs with more than 50 cells belonging to the cell type in both individuals are plotted. Pseudotime dimension in scRNA-seq reflects the progression of cells along differentiation/maturation processes. Although some differences can be noted, differences are not consistent across organoid stage or families in either cell type, suggesting the observed differences in B-C are not explained by major differences in maturation. E. Overall proportion of cells in the S, G2 or M phase of the cell cycle (phase classification based on gene expression using the Seurat pipeline, Methods) separated by stage, cohorts and ASD diagnosis colored by family. F. Heatmaps of differences in division scores. Division score in each cell type was calculated as indicated for each sample and the difference between proband and their respective control is reported for each stage and cell type combination. Higher proportion of cells actively in the cell cycle (i.e., S, G2 or M phase base on cell cycle gene expression) in the proband compared to the control are indicated by red portion of the gradient, while lower proportion are on the blue portion. Neuronal cells (i.e., EN-DCP, EN-PP, IN, CP-mixed) were majorly in G1 phase (reflecting a postmitotic state) and therefore not compared for this analysis. Scale was saturated at 2.5 in both direction and cases where the difference could not be estimated were removed (blank spaces). Note that, both over all cells and in RG cells, proliferation is up in macrocephalic ASD across 7 out of 8 families at TD0 and TD30 with different degrees. To a lesser extent, there is also an increase across all cells in the 4 normocephalic ASD at TD0. Altogether, this suggests changes in cell division could underlie gene expression differences outlined in Main Fig.3.
Extended Data Fig. 4.
Extended Data Fig. 4.. Top 15 high confidence up/down DEGs in volcano plots for both cohorts and stages. (Related to Fig. 3)
A–D Volcano plots for macrocephalic ASD DEGs at TD0 (A) and TD30/60 (C) and for normocephalic DEGs at TD0 (B) and TD30/60 (D). Top 15 (based on average log2-fold change) high confidence DEGs in each direction are indicated. Among them, known markers of neurodevelopment are in bold and SFARI genes are in green. Full DEG results are in Supplementary Table 5. The geometric mean of BH-adjusted p-values of the DEG tests (two-sided quasi-likelihood ratio test for each ASD-Ctrl pairs, see Methods) is plotted in y-axis (in −log10 scale).
Extended Data Fig. 5.
Extended Data Fig. 5.. GO term enrichment of ASD DEG sets (related to Fig. 3).
A–D. Enrichment of DEG in GO terms or pathways from KEGG (K) or Reactome (R) for macrocephalic DEGs at TD0 (A) and at TD30/60 (B) and for normocephalic DEGs at TD0 (C) and TD30/60 (D). DEG sets were separated by direction of change (upregulated/downregulated) and cell types. Dot size indicates the number of DEGs within each GO term/pathway. Color indicates FDR-corrected p-value for the enrichment (one sided Fisher exact test). Annotations terms from enrichment results were first filtered out based on FDR < 0.01, nCommonGenes >=3 and effectiveSetSize < 1500. Top 15 terms ranked by significance were selected to be plotted for each cell type (Methods). To ease consultation, grey boxes were added to group terms similar pattern of enrichment across the cell types. See also Supplementary Table 6.
Extended Data Fig. 6:
Extended Data Fig. 6:. Intersection of ASD DEGs with cluster markers of EN and fetal brain derived cortical area-specific markers (Bhaduri et al 2021) (related to Fig. 3).
A. Dot plot showing log2FC differential expression results in the IPC/nN cell type (left) for genes identified as specific cluster markers of EN-PP and EN-DCP clusters as indicated by dots on the right side (clusters are referred by numbers as shown in the initial clustering in Main Fig. 1A; pct.exp= percentage of cells expressing the gene in the corresponding cluster. Specific cluster markers were defined as cluster markers with average log-fold change > 0.25, BH adjusted-pvalue < 0.01 (Wilcoxon rank sum test) and pct.1/pct.2 > 1.2 in no more than 2 clusters; see full cluster marker list in Supplementary Table 3). The panel show that IPC/nN cells are showing a differential expression in cluster markers compatible with a shift in fate preference in ASD probands (increase in EN-DCP in macro and in EN-PP in normo-ASD). B. Dot plots showing enrichment of cortical area-specific markers in upregulated (upDEG) or downregulated (downDEG) ASD DEGs at TD30/60 separated by cohort and cell types. Cortical area-specific markers from fetal brain major cell type were selected and matched to corresponding organoid cell type (“RG” for RG-related cell type, “IPC” for IPC/nN and “Neuron” for neuronal cell types, as reported in Table S8 of Bhaduri et al for “mid” fetal stage). Overall the there is a stronger downregulation of area-specific genes at TD30/TD60 in both cohorts. However, upregulated DEGs in macro-ASD are notably more enriched in genes specific to V1 area, which, put together with an enrichment of genes marking PFC in downDEGs (notably in RG) could point to a differential area-specification in macro-ASD. C. To further investigate the upregulation of V1 area markers, the most significant areal markers differentiating PFC and V1 cortical areas in fetal brain (y axis: “PFC-enriched”, or “V1-enriched”) were selected (main figure in Bhaduri et al.) and ASD DEG results from our study were plotted as a differential expression heatmap (as in main Fig. 3C). When considering this limited list of important genes, both important V1-enriched and PFC-enriched genes are found upregulated (e.g. LHX2/TENM4/BCL11A for V1 and NEUROG1/2/HOPX/PAX6 for PFC) and downregulated (NR2F1/WNT7B/NPY for V1 or FOS/CTNNB1 for PFC), which suggest that area misspecification alone do not account for the full phenotype. Note that most of those cortical area marker genes have several other canonical functions in neurodevelopment (see for instance alternative annotations in known marker list in Supplementary Table 3 in our study).
Extended Data Fig. 7:
Extended Data Fig. 7:. Immunocytochemistry for NEUROD2, EOMES, SOX1 and Ki67 in macrocephalic ASD derived-organoids. (Related to Fig. 3)
(A-B). Representative images of NEUROD2 immunostainings showing 5 different organoids of the macrocephalic ASD family 07 (A) and a second macrocephalic ASD family 10530 (B). (C-D). Representative images of EOMES immunostainings showing 3 different organoids of the macrocephalic ASD family 07 (C) and 3 different organoids of a second macrocephalic ASD family S8270 (D). Scale Bar: 100 μm. (E). Representative images of Ki67 (red) and SOX1 (blue) proliferating cells, showing 2 different organoids of the macrocephalic ASD family 10789. Scale bar: 100 μm. (F) Box and whisker plots (including minima, maxima and median values) showing immunocytochemical quantification of Ki67 positive cells in organoids of the 5 macrocephalic ASD family pairs core dataset (S8270, 07, 10789, S9230 and 10530); n=10 iPSC lines derived from biologically independent subjects. Tukey method was used to plot boxes (25, 50, and 75th percentiles) and whiskers (minima, maxima); mean value for Ctrl and ASD groups is shown as “+”; median value for Ctrl and ASD groups is shown as center line; **: p-value < 0.01, unpaired two-sided t-test (p=0.0083).
Extended Data Fig. 8:
Extended Data Fig. 8:. Comparison of ASD DEGs obtained from TD30 and from TD60 (Related to Fig. 3).
A,B. Heatmap of differential expression results of known markers of neurodevelopment (as in Fig. 3C of the main manuscript) separated by stage (TD30 and TD60) for macro-ASD DEG (A) and normo-ASD DEGs (B). As in the main figure, n.effective represent the number of concordant family pairs minus the number of discordant family (the direction of reference being the direction observed in a majority of pairs). Dots are colored by the average log2FC (all pairs included). C. Bar plot of DEG counts colored by overlap status between ASD DEG results from TD30 and TD60 for both cohorts. “specific”=DEG only at one stage, “concordance”=DEG at both stage with same direction of change, “discordance”=DEG at both stage but with opposite direction of change. There is a minority of discordant DEGs across the 2 time point for either cohort, suggesting stability in DEG results across time. D,E. Heatmap of differential expression results for discordant cases between TD30 and TD60 in ASD DEG results. Discordant cases (boxed) were selected for each cohort and results for all cell types are plotted for reference. Known markers of neurodevelopment are indicated in bold (Supplementary Table 3). Except for C1orf61, most discordant genes are limited to a unique cell type and DEGs is in the lower range of FC, and with the exception of FEZF2, do not include lineage specific genes for EN and IN. Full DEG results for TD30 and TD60 separated is included in Supplementary Table 5.
Extended Data Fig. 9:
Extended Data Fig. 9:. Shared DEGs between all ASD proband across both cohorts (Related to Fig. 3).
A. Bar plots showing number of shared ASD DEGs by stage and cell type. “* p-val < 0.01” indicates if the obtained number of shared DEGs was significant by permutation test (i.e., value above maximum number of shared DEGs observed across n=100 permutations of gene names in paired DEG results, Methods). B–D. Heatmap of pairwise ASD vs Control log2FC for shared ASD DEGs at TD0 (B), TD30 (C) and TD60 (D) separated by cell type. Cell types selected have a significant number of shared DEG by permutation analysis (A). All shown values meet FDR < 0.01. SFARI genes are indicated in green, known markers of neurodevelopment are underlined and TF in bold (no TF were found in those lists). Genes involved in cell cycle (GO:0007049) are indicated in brown. E, F. Protein-protein interaction networks (STRING analysis, edge=confidence of the interaction) for the union of downDEG (E) and upDEG (F) from B-D, with selected enriched term indicated by node color (FDR from STRING indicated in color legend). Note the limited annotation for downDEGs (see also T5 in Supplementary Table 6).
Extended Data Fig. 10.
Extended Data Fig. 10.. Schematic of the potential mechanisms driving cortical plate alteration in ASD during early neurogenesis in organoids.
Top: differentiation of cortical radial glial cells into preplate excitatory neurons, with later generation of excitatory neurons that will form the 6-layered neocortex, splitting the preplate into marginal zone (layer 1) and subplate. Middle and lower panels: alterations in excitatory neurogenesis in ASD. In macrocephalic ASD, radial glial cells re-enter the cell cycle rather than differentiating into preplate, expanding the surface of the future cortical plate, and eventually give rise to an increased number of excitatory neurons of the cortical plate. In normocephalic ASD, radial glial cells escape the cell cycle early to generate an increased number of preplate excitatory neurons, resulting in a relative depletion of progenitors for cortical plate of excitatory neurons. Abbreviation: MZ: marginal zone, SP: subplate, SVZ: subventricular zone, PP: preplate, VZ: ventricular zone, CP: cortical plate.
Figure 1.
Figure 1.. Reproducing early forebrain differentiation in organoids.
(A) UMAP plots colored by the 37 clusters, pseudotime trajectory (grey lines) with origin in cluster 34 (arrowhead), and main annotated cell types (core dataset: 72 samples from 26 individuals, see also Extended Data Fig. 1 & Supplementary Fig. 2). Color code and abbreviations for cell types are used in all figures. (B-D) Heatmaps of gene expression level for selected known markers of neural cell types (B), neuronal subpopulations (C) and regional markers of forebrain (D) across clusters. Expression values are normalized per gene and displayed only if at least 5% of the cluster’s cells expressed the gene. (E) UMAPs colored by expression level of genes supporting cell type annotations (low=grey to high=purple). (F) Representative immunostaining of sliced organoids for forebrain (PAX6, FOXG1), progenitor (PAX6, TLE4, HOPX, SOX1), neuronal (HuC/D), EN (TBR1, BCL11B, FOXP2, TLE4), IPC (EOMES), IN (GAD1) and MCP (TTR, OTX2) molecular markers at TD30. Bottom left and center images were generated from adjacent sections of the same organoid showing co-localization of TTR/OTX2 in medial choroid plexus-like structure (Ch, dashed line) distinct from FOXG1+/EOMES+/HuC/D+ cortical plate-like structure, including ventricular zone structures (vz). Scale Bar: 100 μm. Abbreviations: RG: radial glia, with RG-hem, RG-oRG, RG-tRG, RG-LGE denoting hem, outer, truncated and lateral ganglionic eminence RG, respectively; IPC: intermediate progenitors cells; EN: excitatory neurons, nN: newborn neurons, EN-PP: EN of the preplate; EN-DCP: EN of the dorsal cortical plate; CP-mixed: cortical plate mixed neuronal cells ; IN: inhibitory neurons; MCP: medial cortical plate ; Cell Div.: cell division ; Epend.: Ependymal cells; choroid pl./Ch: choroid plexus.
Figure 2.
Figure 2.. Organoid cell composition and its relationship with radial glia’s gene expression.
(A) Hierarchical clustering of samples based on cell type composition, annotated with stage, ASD diagnosis and family cohort with the corresponding cell type proportions shown as bar plots. (B) UMAP plots colored by cell types separated by stage of collection. (C) Bar plots of the average proportions of cell types by stage. (D) Principal component biplot of cell proportions for TD30 and TD60 samples with contribution to each PC shown as vector colored by cell type (See also Extended Data Fig. 2A,B). (E) Scaled average expression level in RG cells of 3 forebrain TFs (dot color gradient) in relation to EN-DCP and IN CLR-normalized cell proportions (x and y axis, respectively) at TD30/TD60. Each dot represents one sample where the gene is detected. (F) Outline of the analysis linking RG gene expression to neuronal cell abundance by detecting gene expression in progenitors that correlates with the proportions of a neuronal subtype in TD30/60 samples (result in Supplementary Table 4). (G) Top 40 “neuron predictor genes” whose expression in RG correlates positively with the abundance of the 3 main neuronal subtypes in organoids (FDR < 0.05). TFs are in bold, members of signaling pathways are in italic and SFARI genes are in green (See also Extended Data Fig. 2G).
Figure 3.
Figure 3.. Differential gene expression between ASD and controls organoids points to opposite fate alterations in each head-size cohort.
(A) Counts of DEGs between ASD and controls per cell type in the macrocephalic cohort (“macro DEG”) and normocephalic cohort (“normo DEG”). Confidence level indicated by saturation level (see Methods, Supplementary Table 5, Extended Data Fig. 4). Number of ASD-control pairs evaluated in each cell type is indicated below the bar (total of 8 macrocephalic and 5 normocephalic pairs). (B) Intersection between macro ASD and normo ASD high confidence DEG. (C-D) Heatmaps of average log fold change for DEGs that are known markers of neurodevelopment (Supplementary Table 3) in DEGs by selected cell types, stage and cohort. “n.effective” (dot size) is defined as the difference between number of concordant and discordant pairs (see Methods; blue=decreased in ASD, red=increased in ASD). (E) UMAP plots colored by the effect size of the difference in normalized cell proportion between probands and controls (paired t-test, *=FDR < 0.1) (see also Extended Data Fig. 3B,D). These differences were confirmed by Bayesian model-based analyses (Supplementary Fig. 4). (F) Enrichment of neuron-predictor genes (defined in Fig. 2F,G) in DEGs for each progenitor cell types (x axis) (FDR of Fisher’s exact test, y axis). Dashed grey line: FDR=0.01. (G) Box plots showing immunocytochemical quantification of NEUROD2 (top) and EOMES (bottom) in organoids of n=3 macrocephalic ASD family pairs (S8270, 07 and 10530). The Tukey method was used to plot boxes (25, 50 and 75th percentiles), whiskers (minima, maxima) and outliers (dots: value > 1.5 interquartile range from 25th or 75th percentiles); mean value shown as “+”. P-values by unpaired two-sided t-test (NEUROD2=0.0055; EOMES<0.0001). (H,I) Representative images of organoid sections at TD30 immunostained for NEUROD2+ IPC, SOX1+ RG progenitors, HuC/D+ neurons (H) and PAX6+ forebrain RG , EOMES+ IPC and BCL11B+ EN (I). White boxes = locations of zoomed-in images (bottom panels in H); Dashed line = section border; scale bar= 100 μm (See also Extended Data Fig. 7).
Figure 4.
Figure 4.. ASD risk genes identified from rare variants studies and SFARI dataset are enriched in macro DEGs.
(A) Euler Diagrams showing how many of the “ASD risk genes” identified in 4 large scale genomic studies are presents in macro and normo ASD DEGs (union of all DEGs across organoids stages and cell types), with similar diagram for SFARI genes (subset of SFARI genes with score=1 indicated). Note that Wilfert et al only reports genes absent from SFARI database at time of publication. (B) Dot plot of enrichment results between ASD risk genes, SFARI genes or their union (“All”) with ASD DEGs from our study. Enrichment was calculated for the union of DEGs across cell types (“all cells”) and for each cell type DEGs separately. Dot size is number of genes in intersection. Color gradient is FDR-corrected p-value (one-sided Fisher’s exact test; “ns” if FDR >= 0.05) (C) Dot plot heatmap showing average fold change for “ASD risk genes” in macro or normo DEGs in our study. “n.effective” (dot size) indicates the difference between the number of concordant and discordant families for the tested change in expression (blue=decreased in ASD, red=increased in ASD). Genes plotted are high confidence DEG with n.effective > 2 in at least one cell type (TF in bold, SFARI genes in green).

References

    1. Eyring KW & Geschwind DH Three decades of ASD genetics: building a foundation for neurobiological understanding and treatment. Hum Mol Genet 30, R236–R244 (2021). - PMC - PubMed
    1. Parikshak NN, et al. Genome-wide changes in lncRNA, splicing, and regional gene expression patterns in autism. Nature 540, 423–427 (2016). - PMC - PubMed
    1. Ruzzo EK, et al. Inherited and De Novo Genetic Risk for Autism Impacts Shared Networks. Cell 178, 850–866 e826 (2019). - PMC - PubMed
    1. De Rubeis S, et al. Synaptic, transcriptional and chromatin genes disrupted in autism. Nature 515, 209–215 (2014). - PMC - PubMed
    1. RK CY, et al. Whole genome sequencing resource identifies 18 new candidate genes for autism spectrum disorder. Nat Neurosci 20, 602–611 (2017). - PMC - PubMed

Methods-only references

    1. Lord C, et al. The autism diagnostic observation schedule-generic: a standard measure of social and communication deficits associated with the spectrum of autism. J Autism Dev Disord 30, 205–223 (2000). - PubMed
    1. Constantino JN & Gruber CP The Social Responsiveness Scale Manual. Second Edition (SRS-2) (Western Psychological Services, Los Angeles, CA, 2012).
    1. Rutter M, Le Couter A & Lord C ADI-R: Autism Diagnostic Interview-Revised (Western Psychological Services, Los Angeles, CA, 2003).
    1. Mullen E Mullen Scales of Early Learning. AGS Edition (American Guidance Serivce, Inc., Circle Pines, MN, 1995).
    1. Wechsler D Wechsler Abbreviated Scale of Intelligence, Second Edition (WASI-II) (NCS Pearson, San Antonio, TX, 2011).

Publication types