. 2024 Jun;42(6):905-915.
doi: 10.1038/s41587-023-01906-5. Epub 2023 Aug 10.

A germ-free humanized mouse model shows the contribution of resident microbiota to human-specific pathogen infection

Affiliations

A germ-free humanized mouse model shows the contribution of resident microbiota to human-specific pathogen infection

Angela Wahl et al. Nat Biotechnol. 2024 Jun.

Abstract

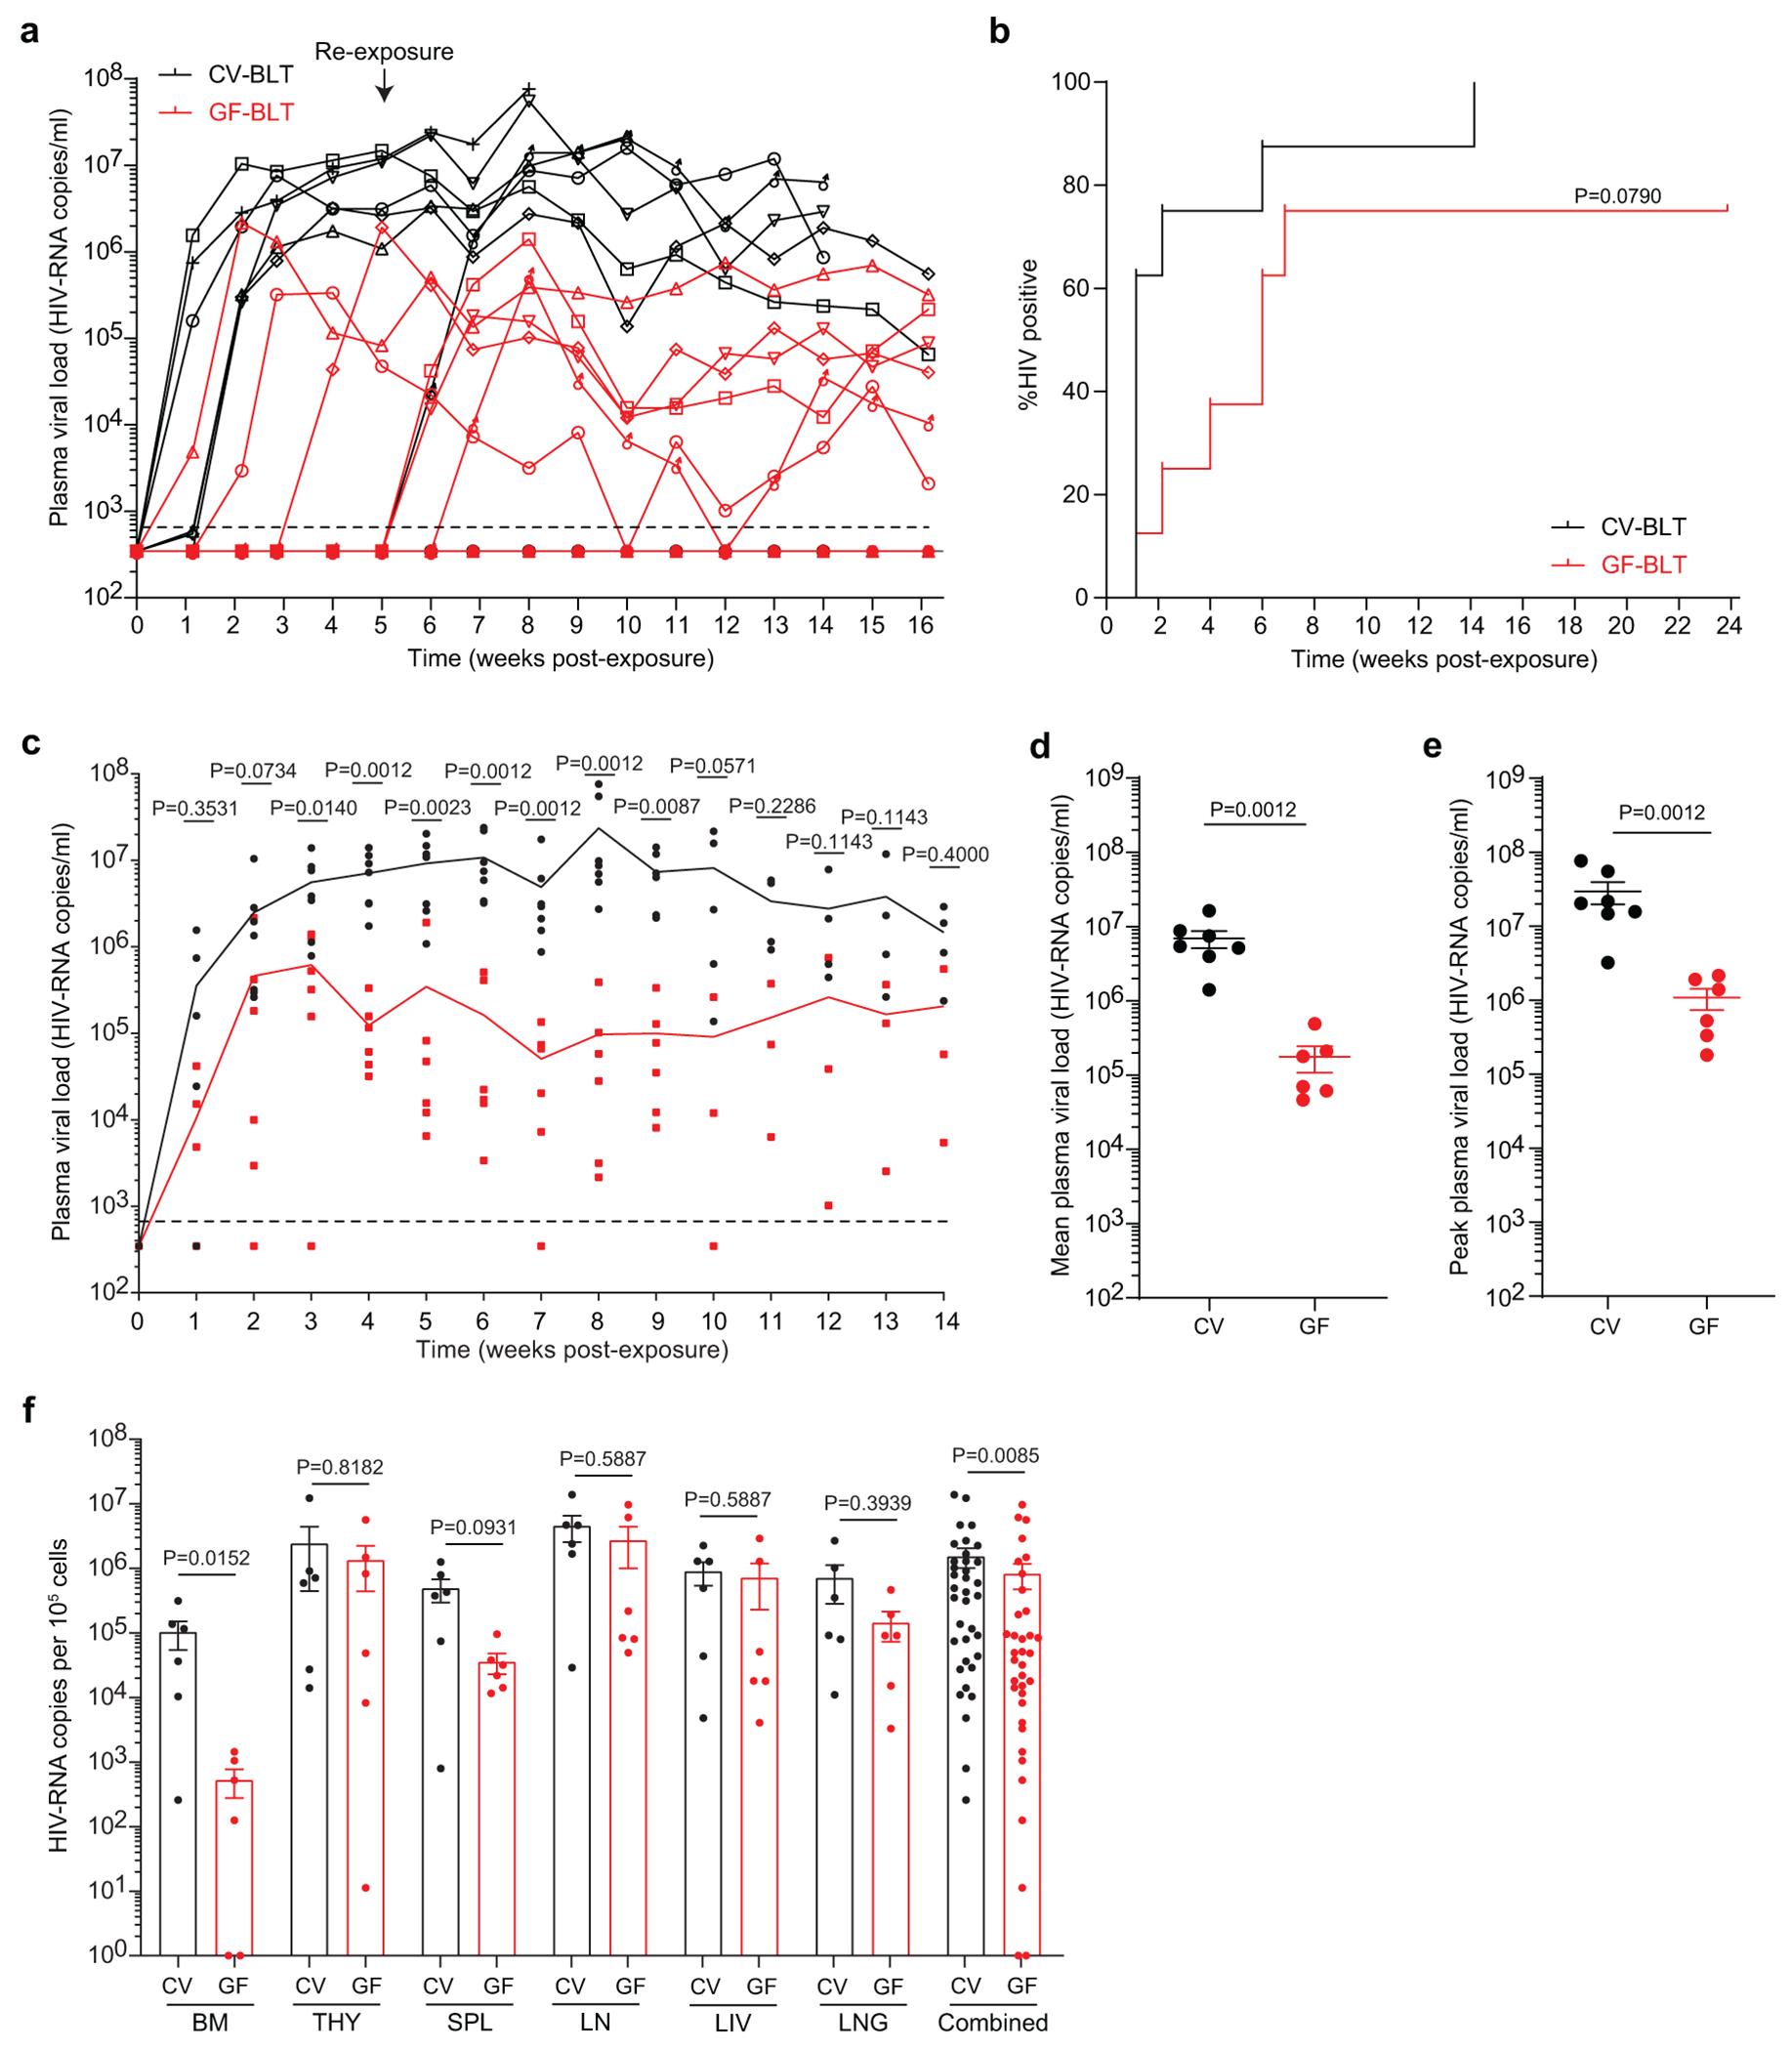
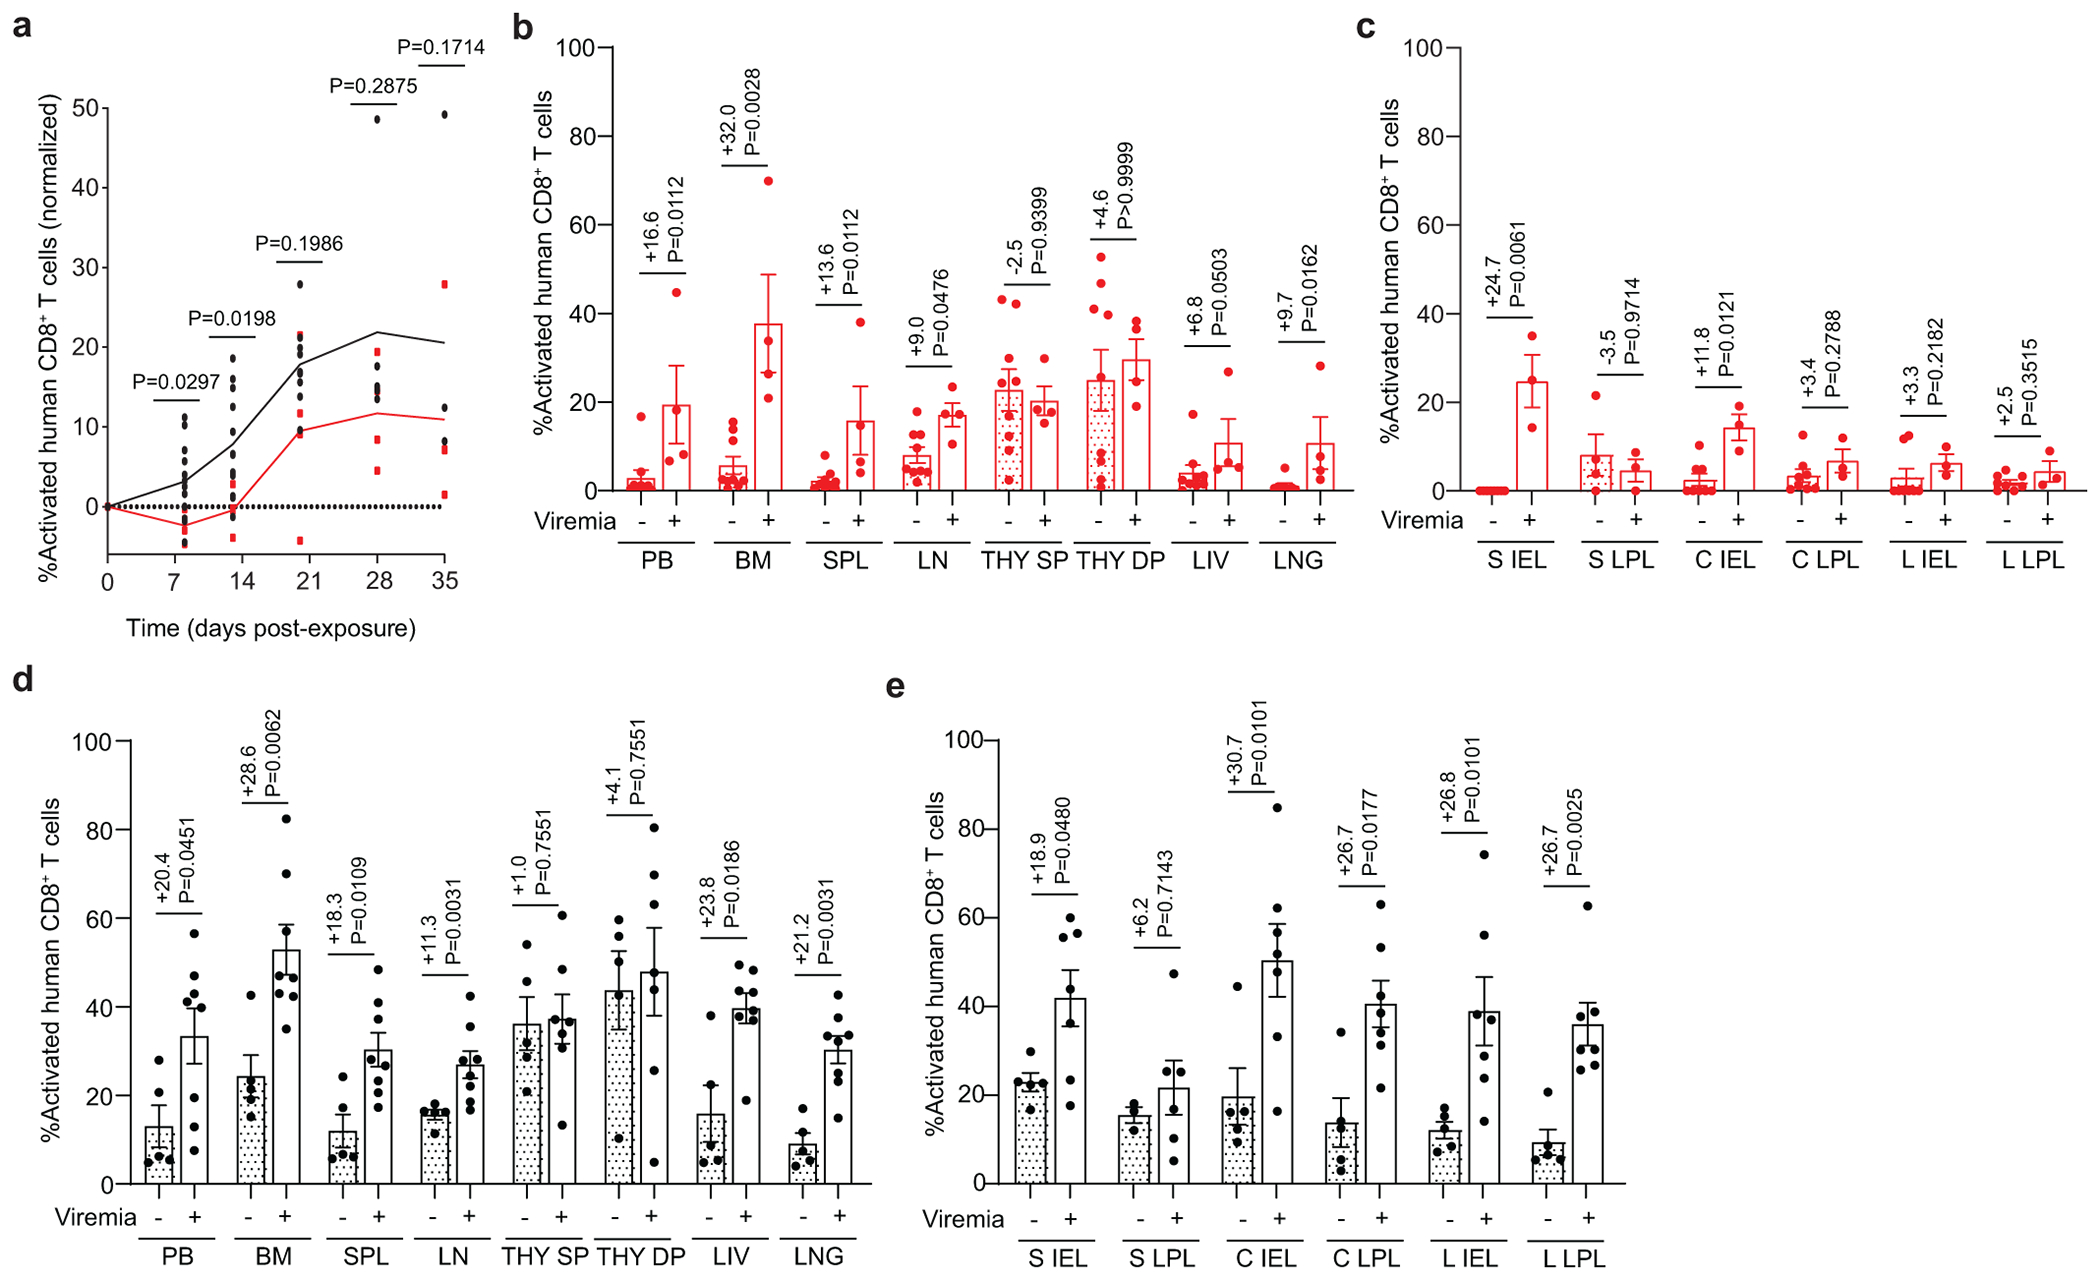
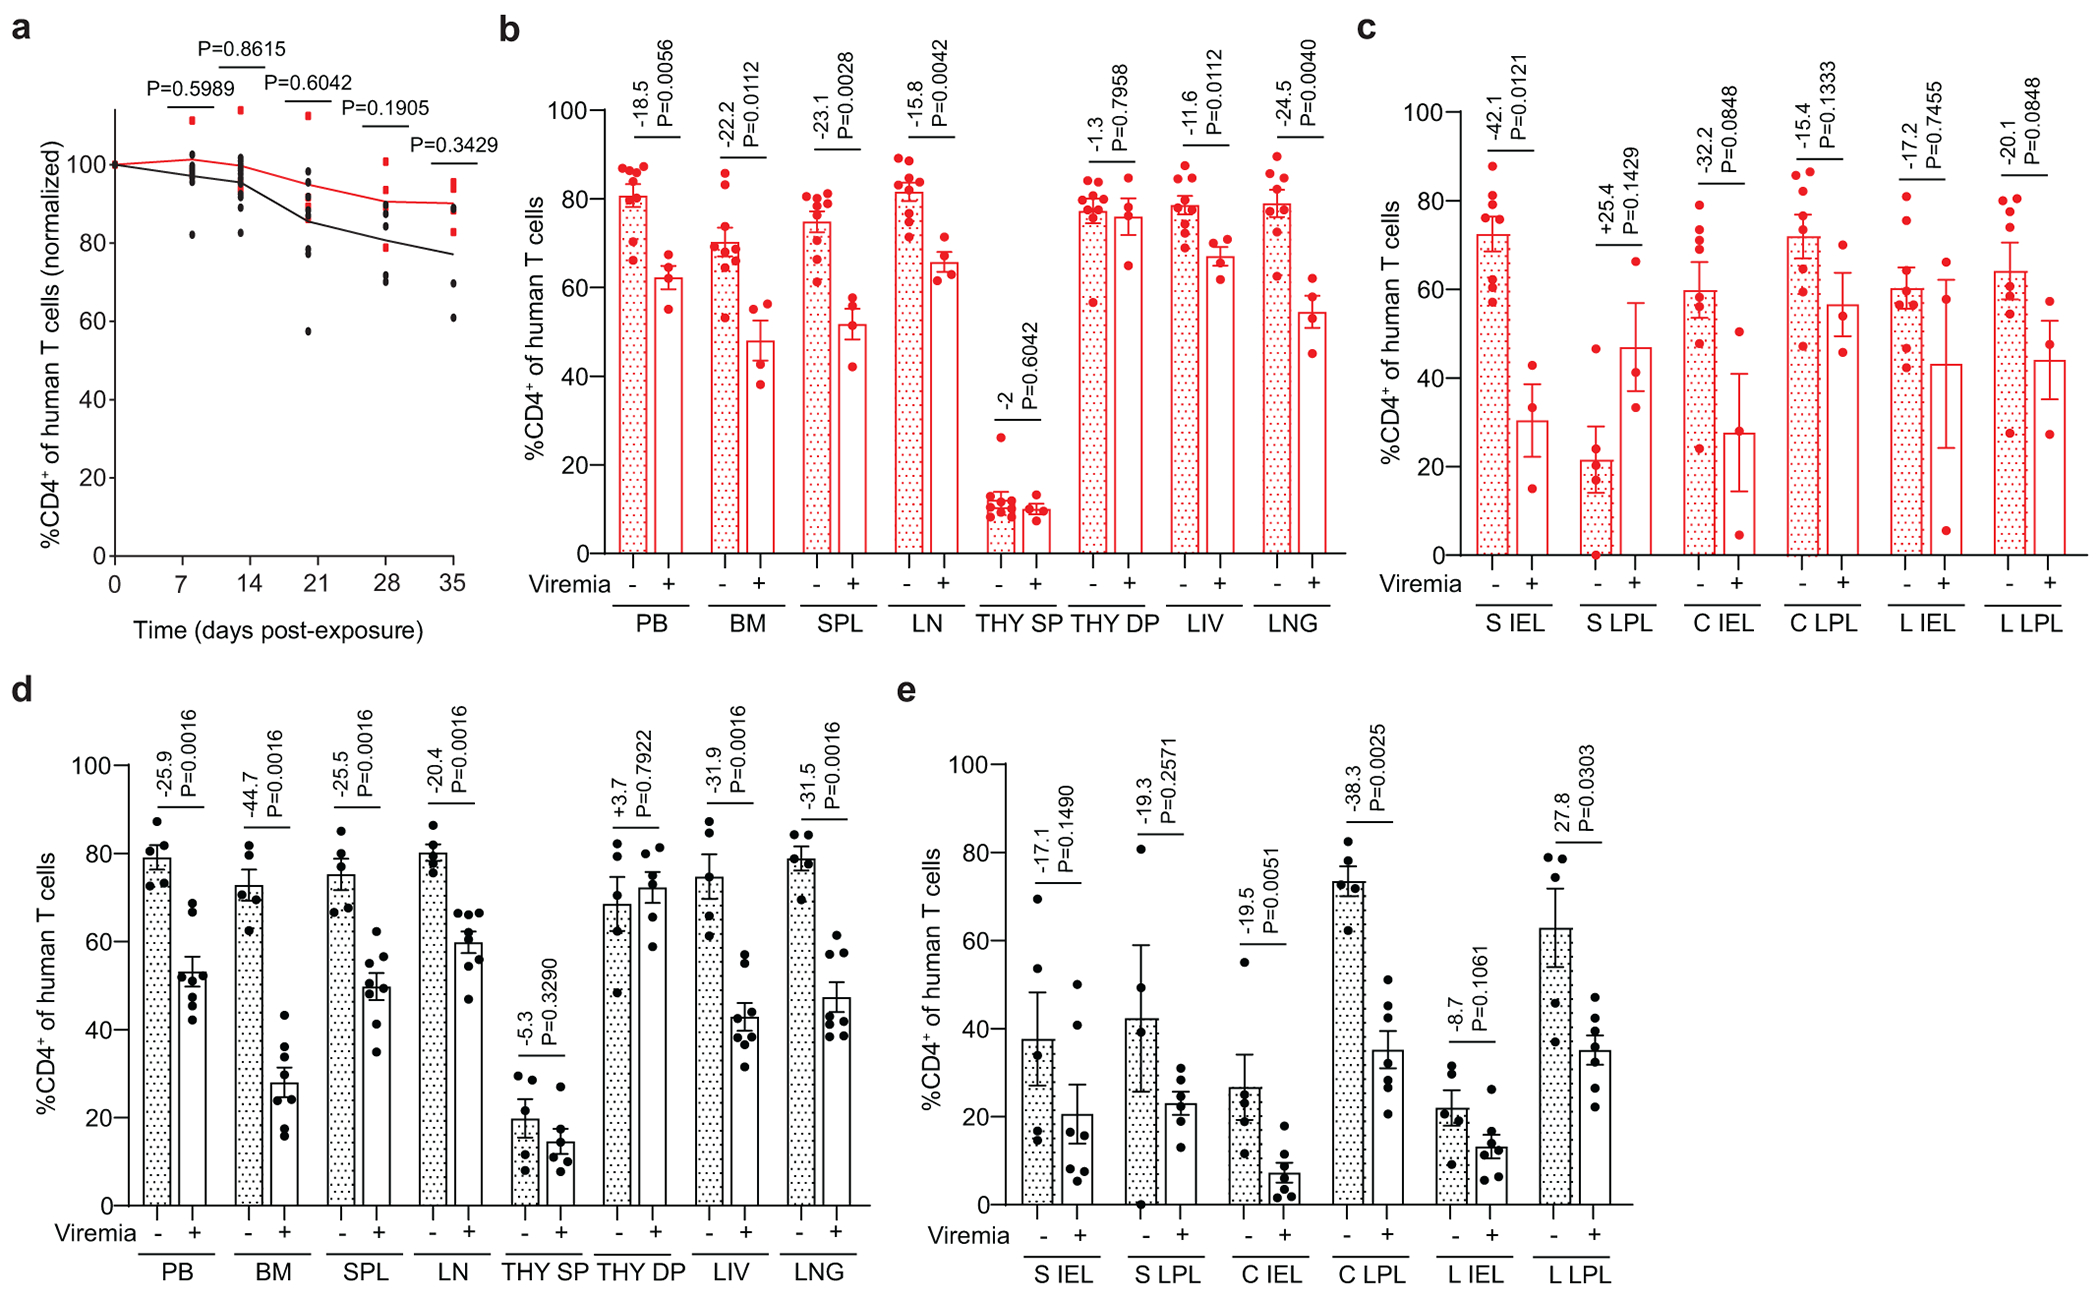
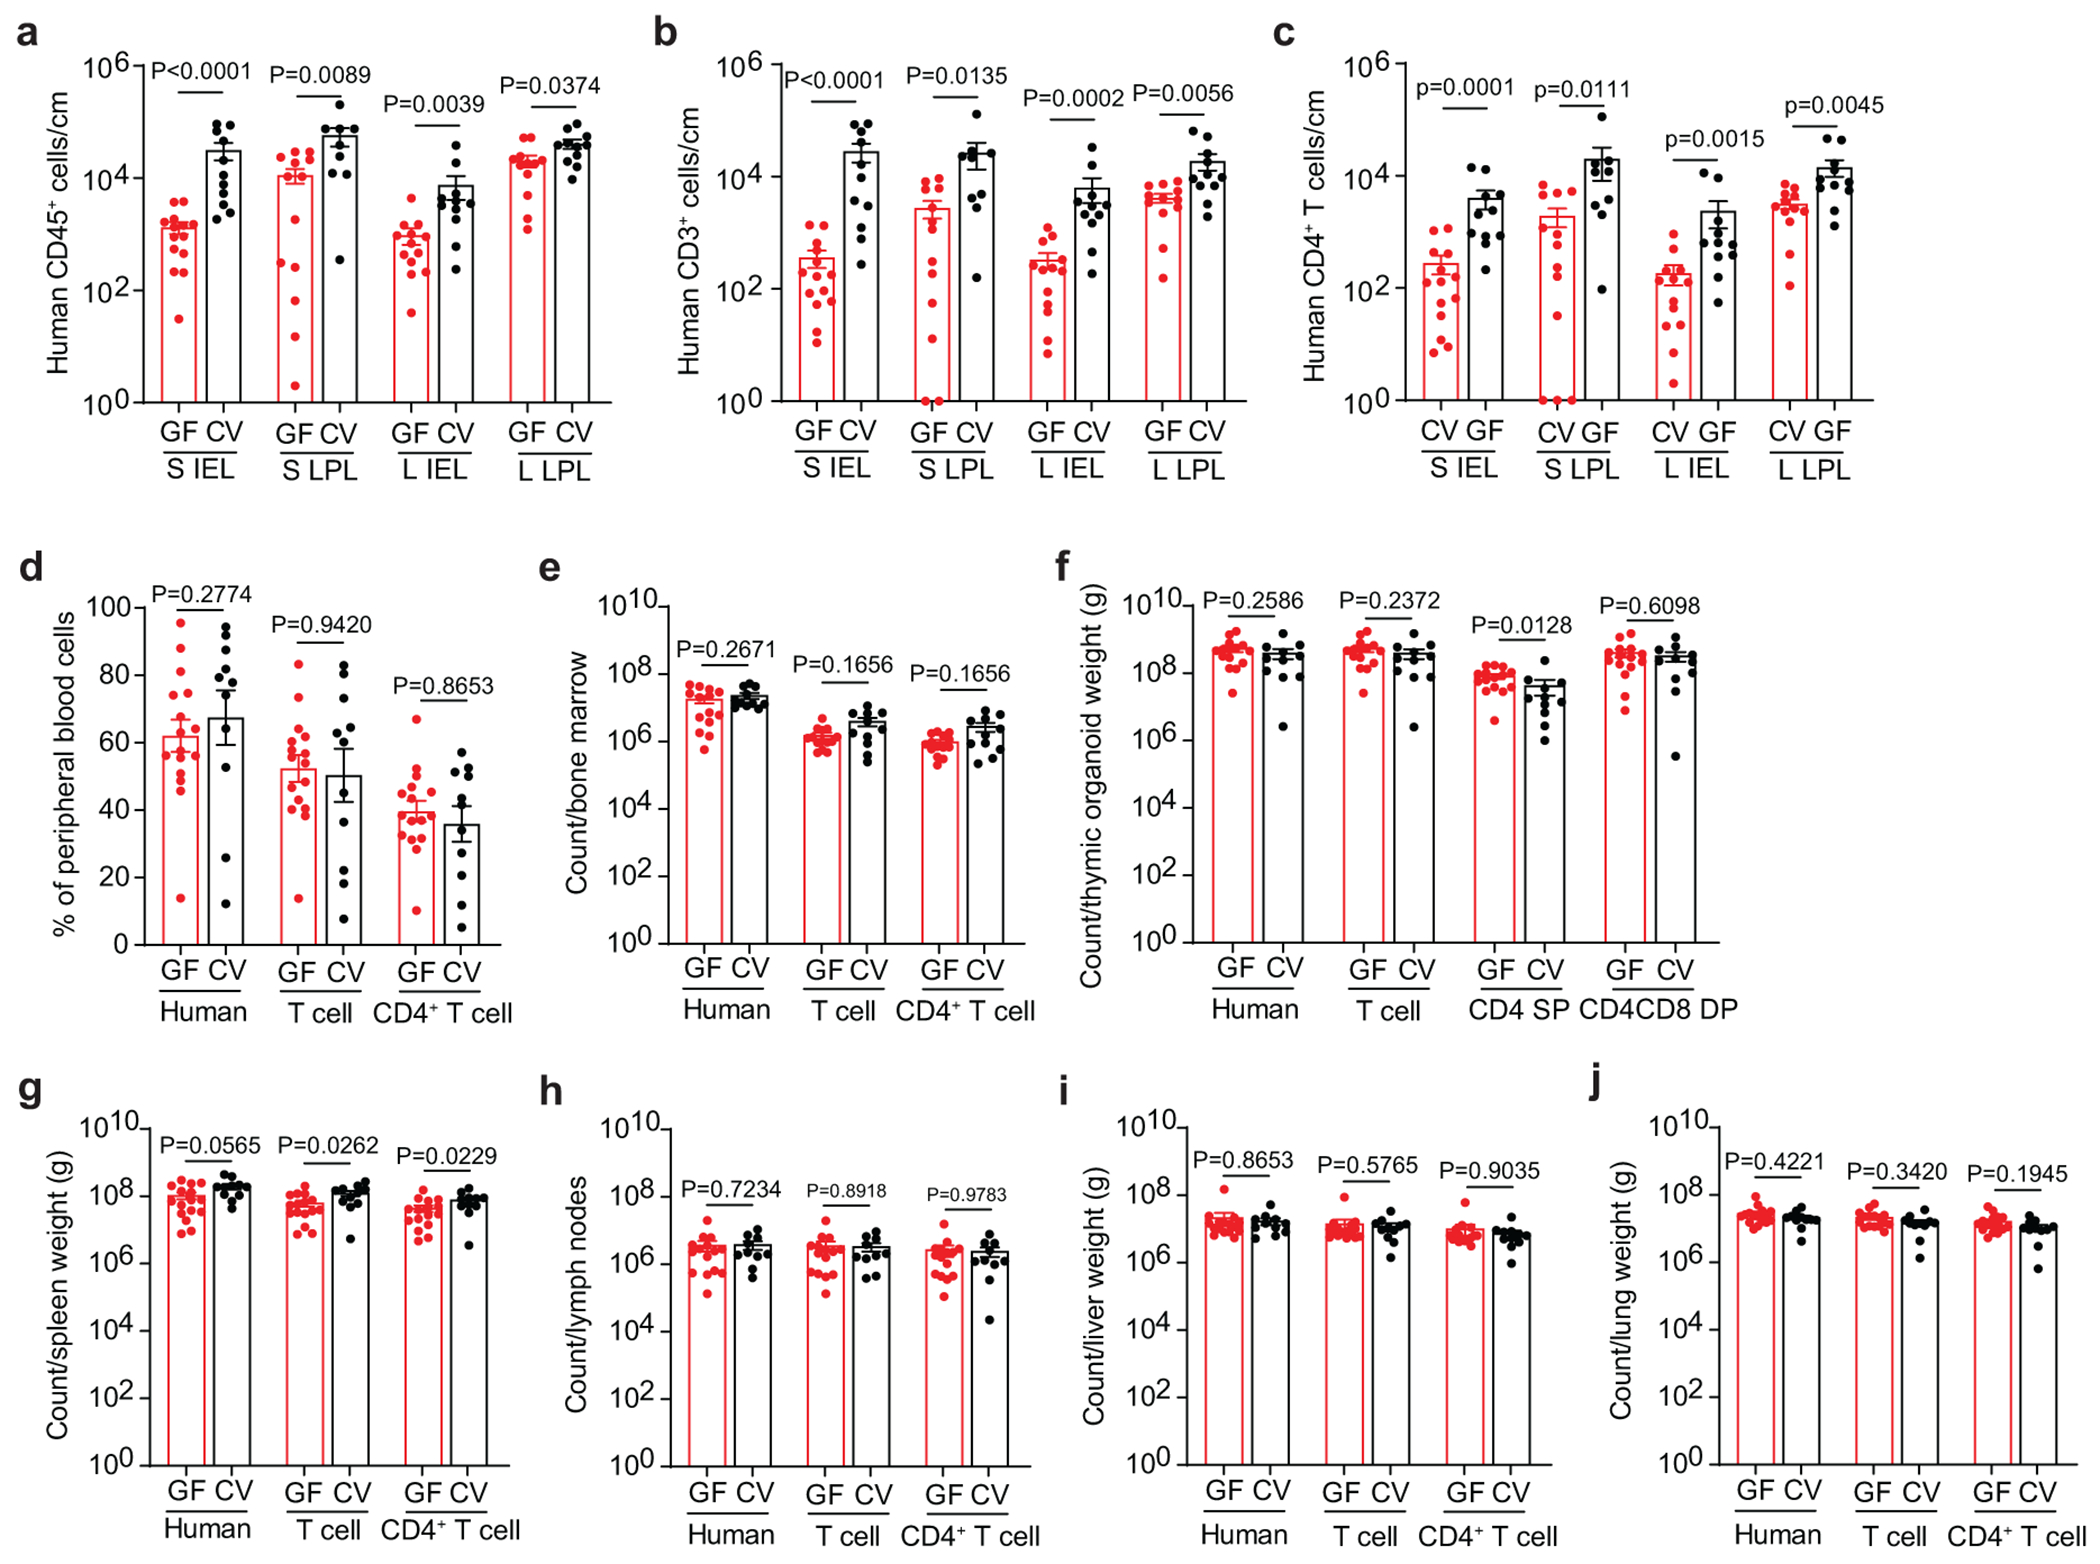
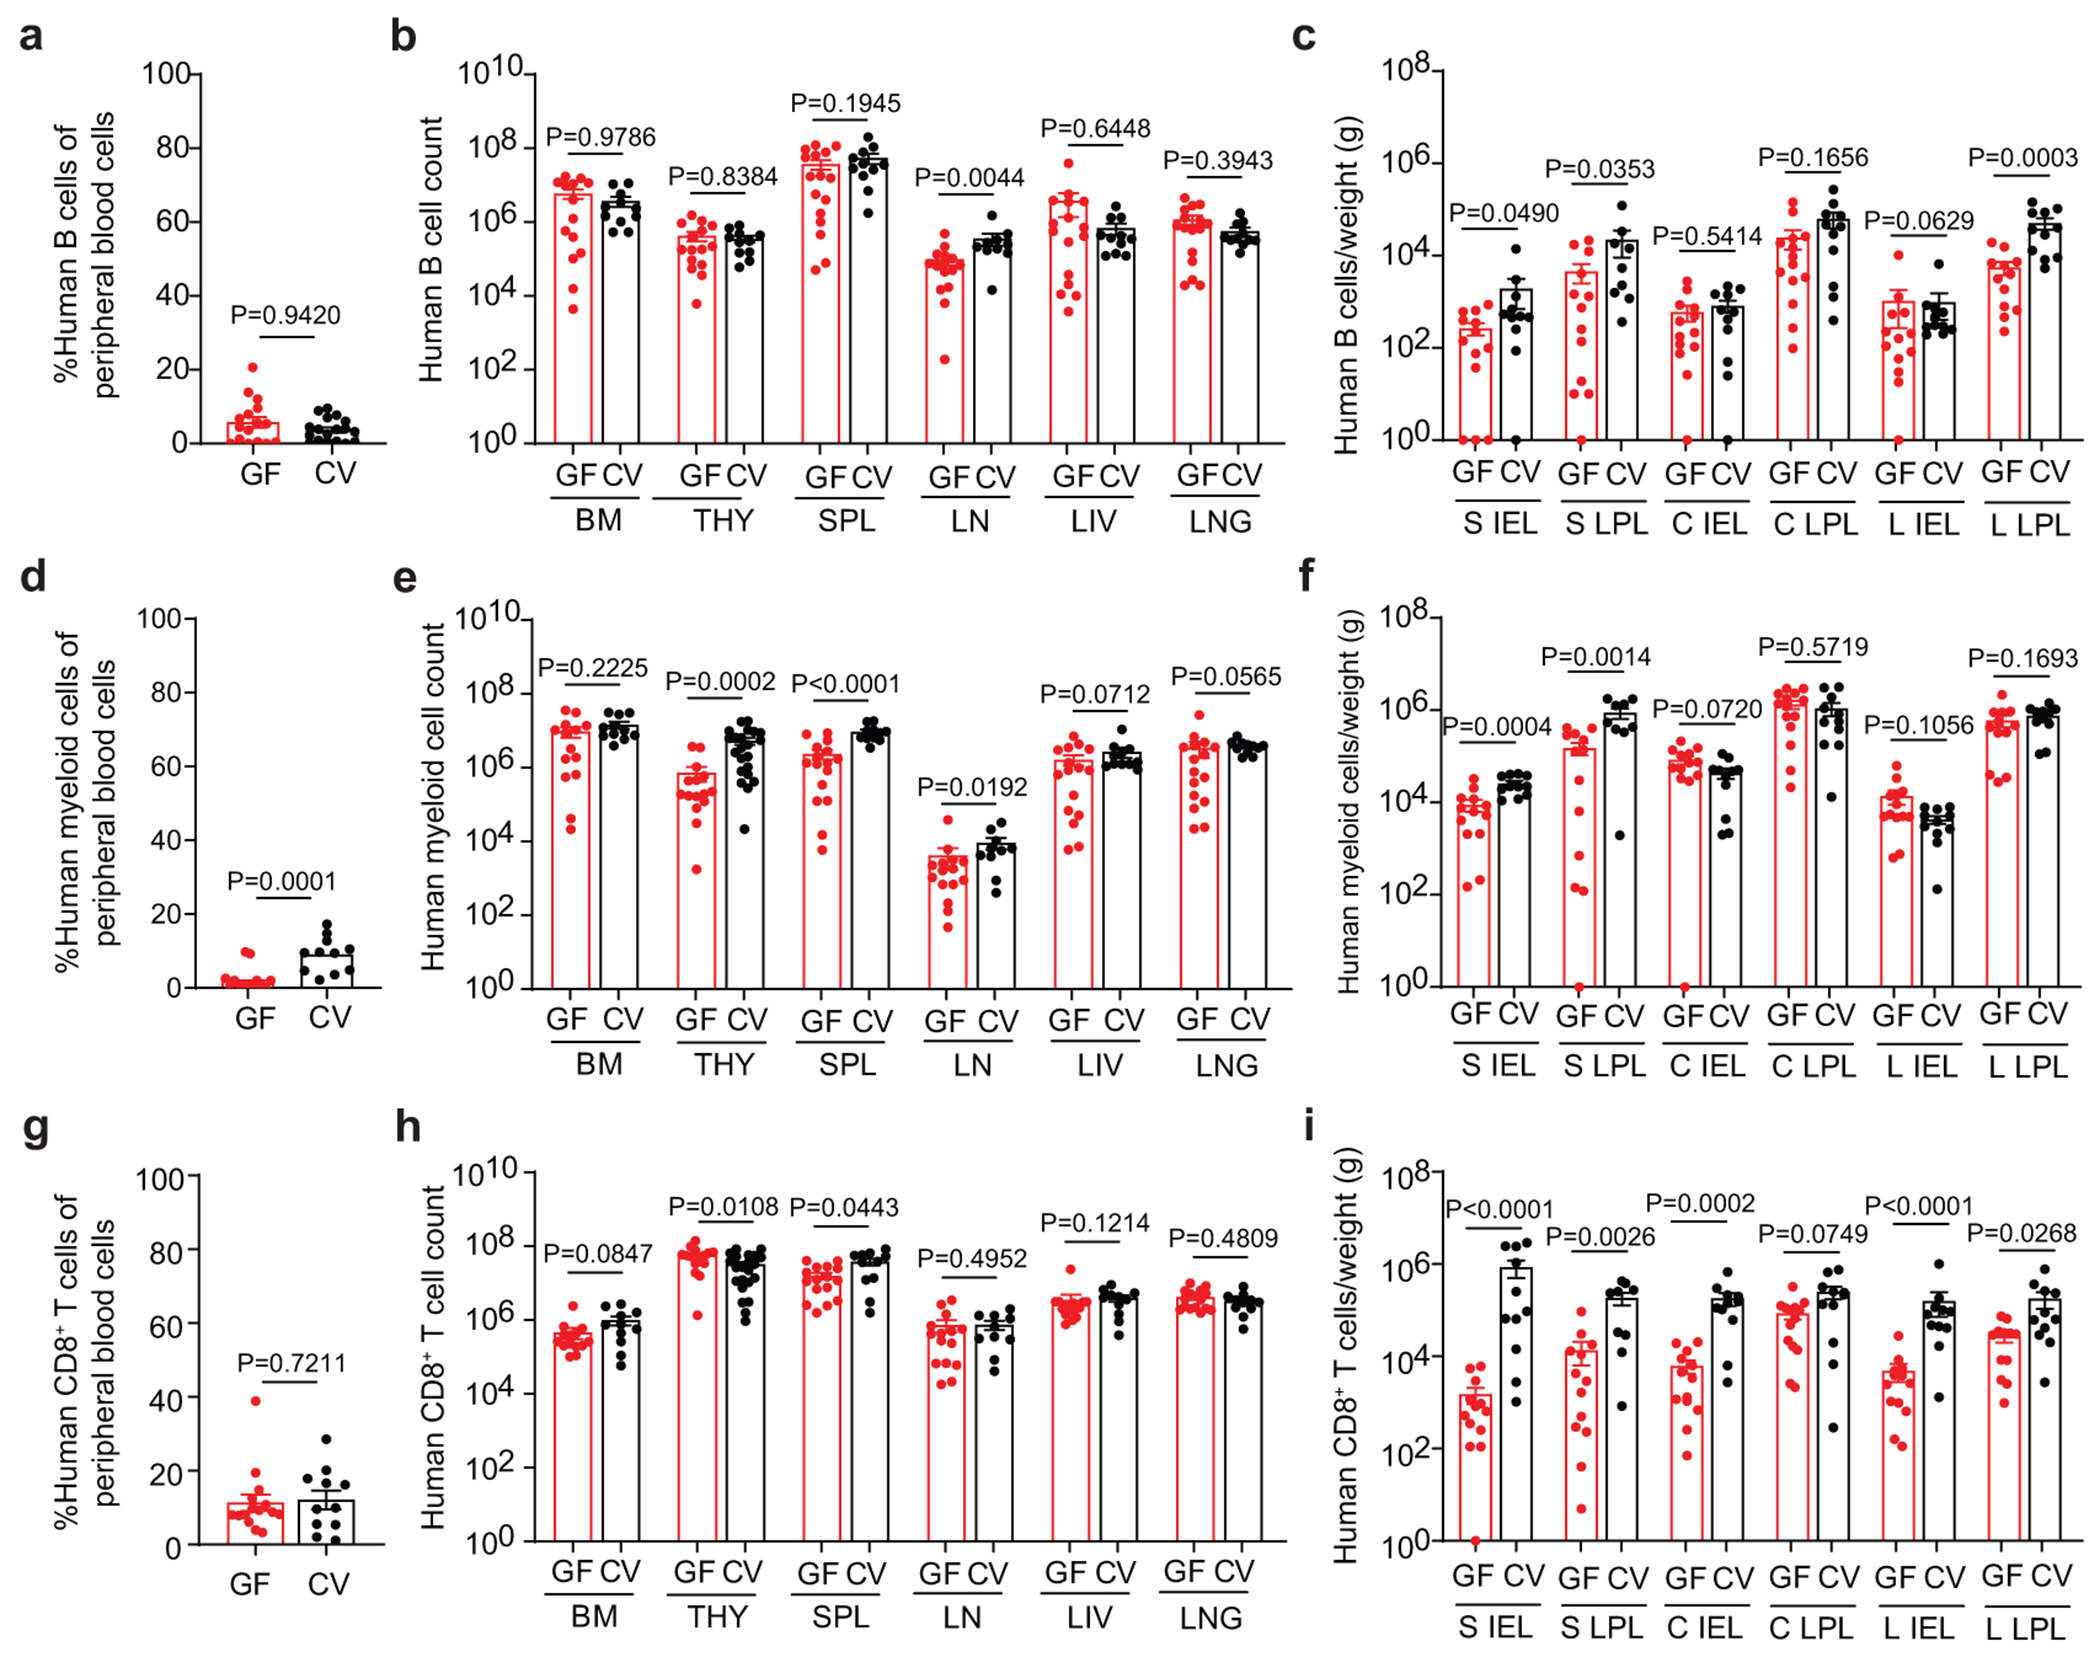
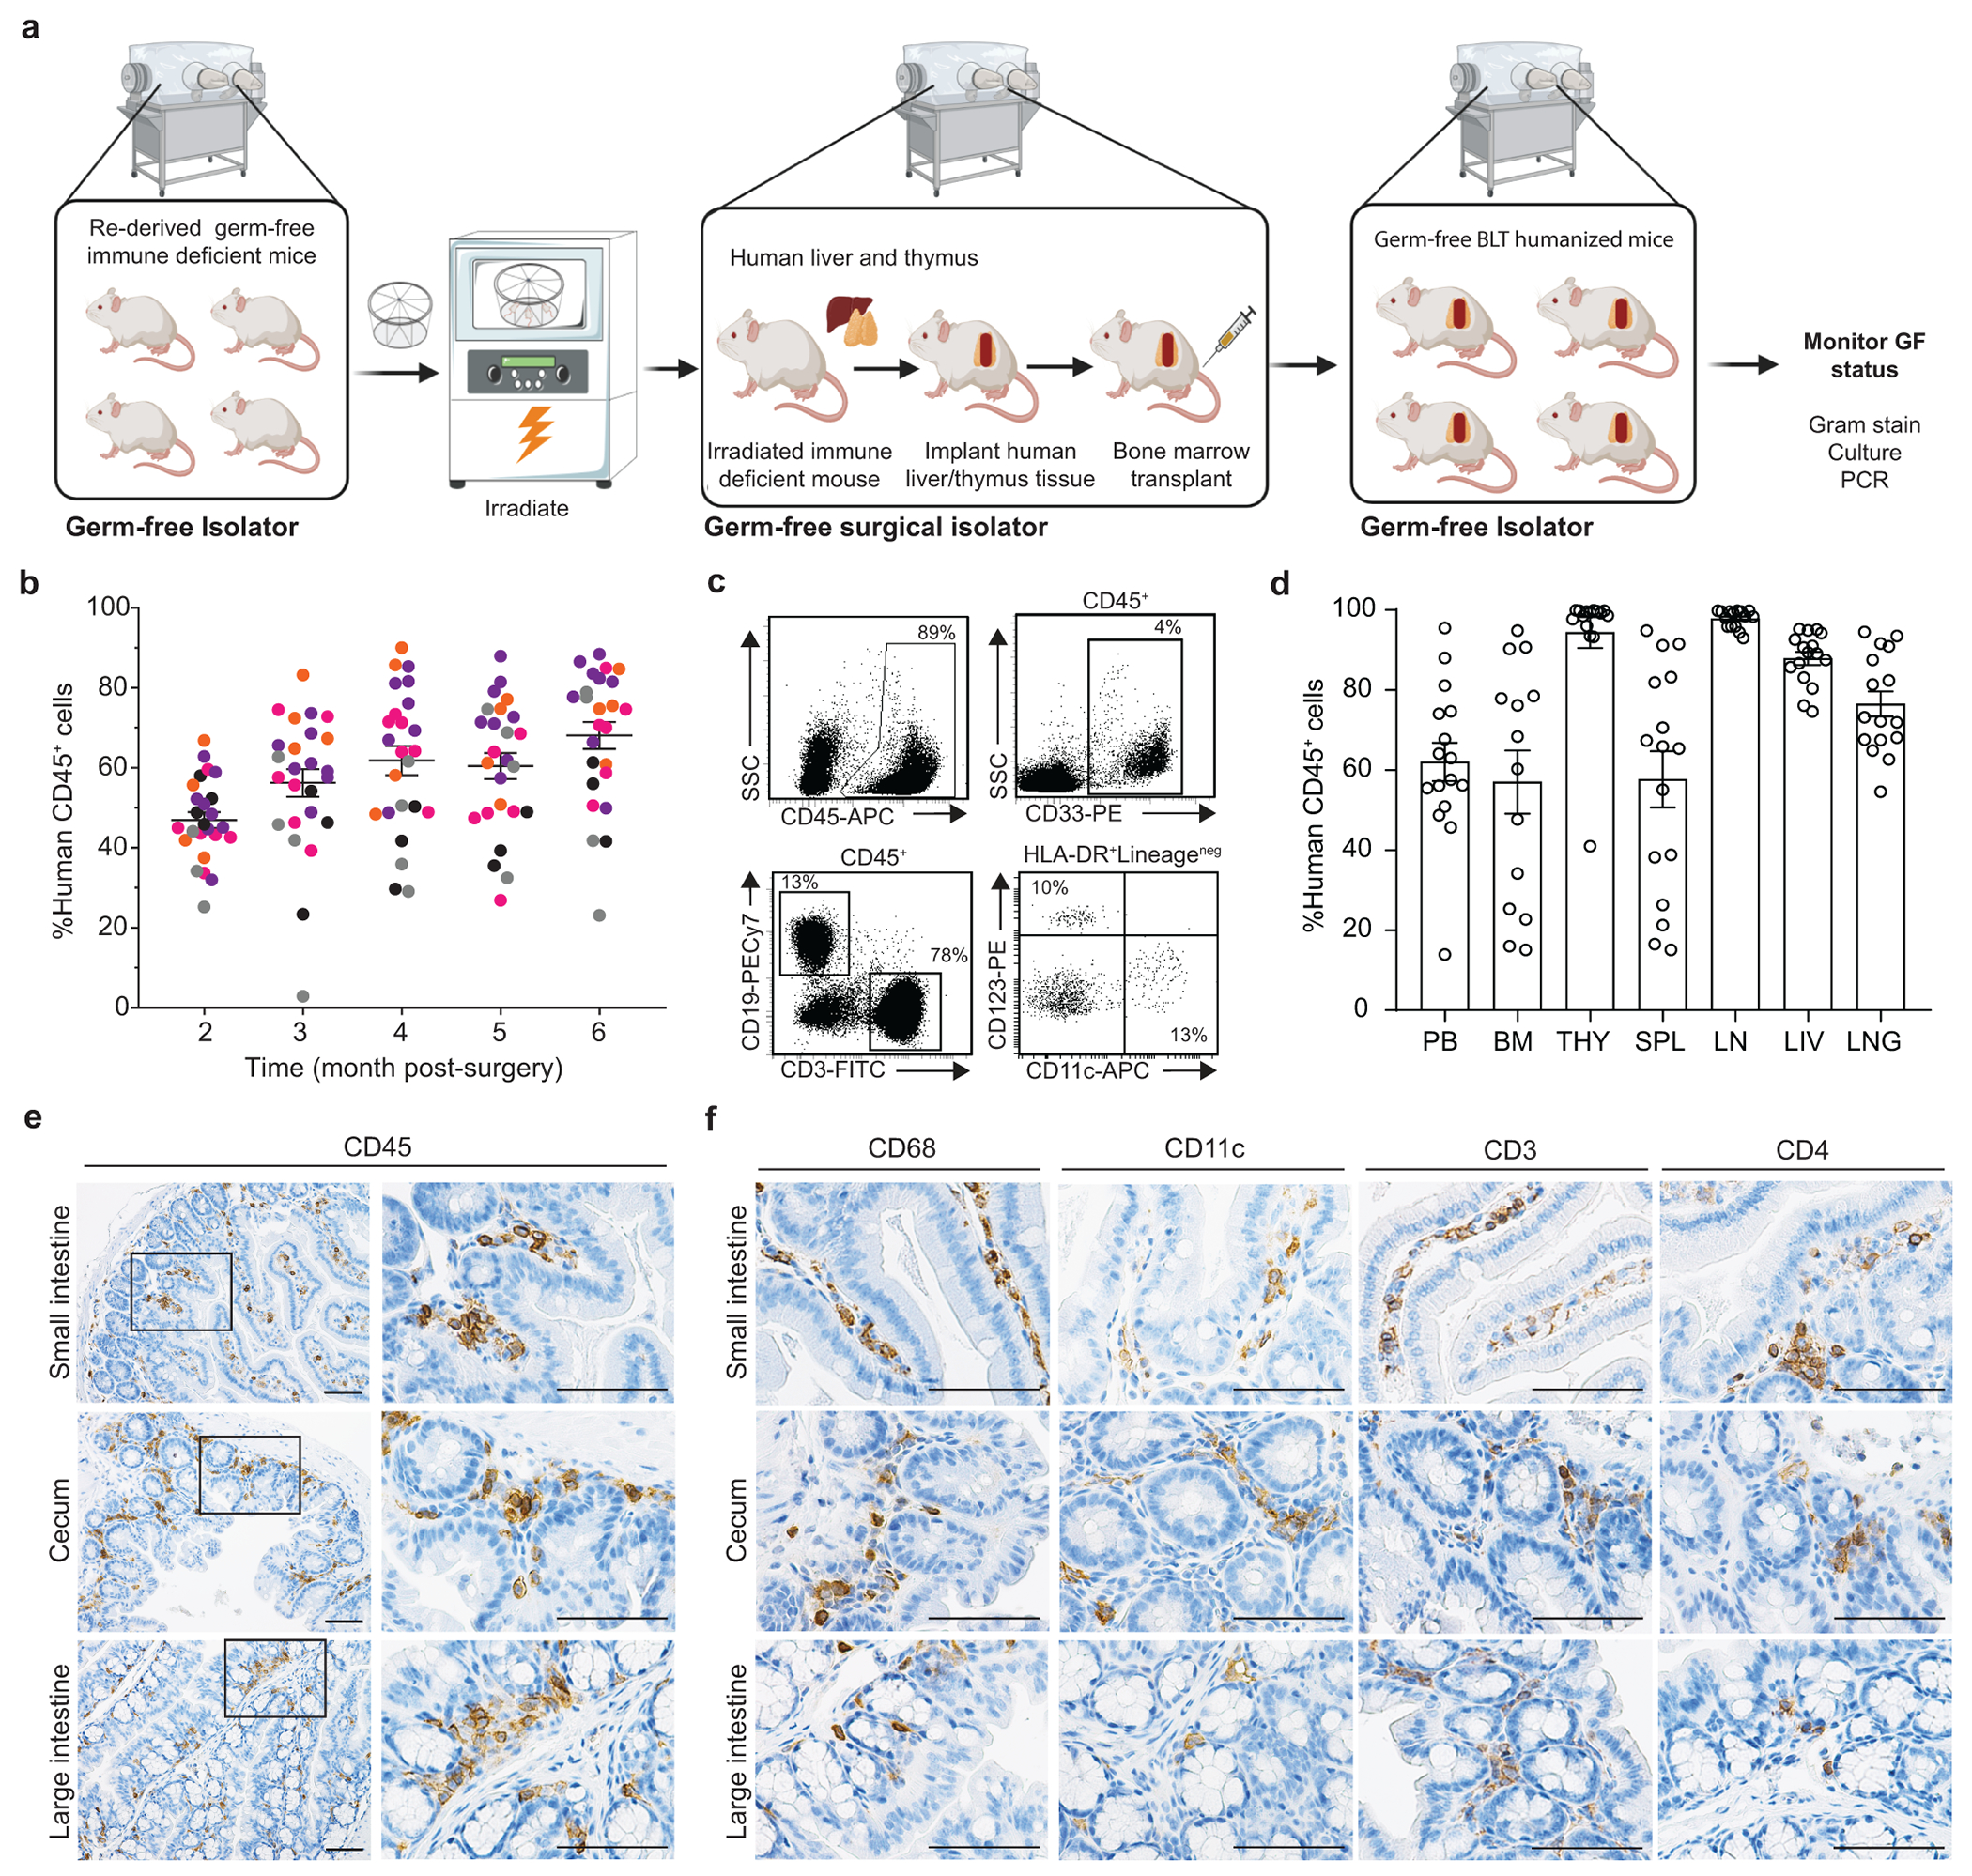
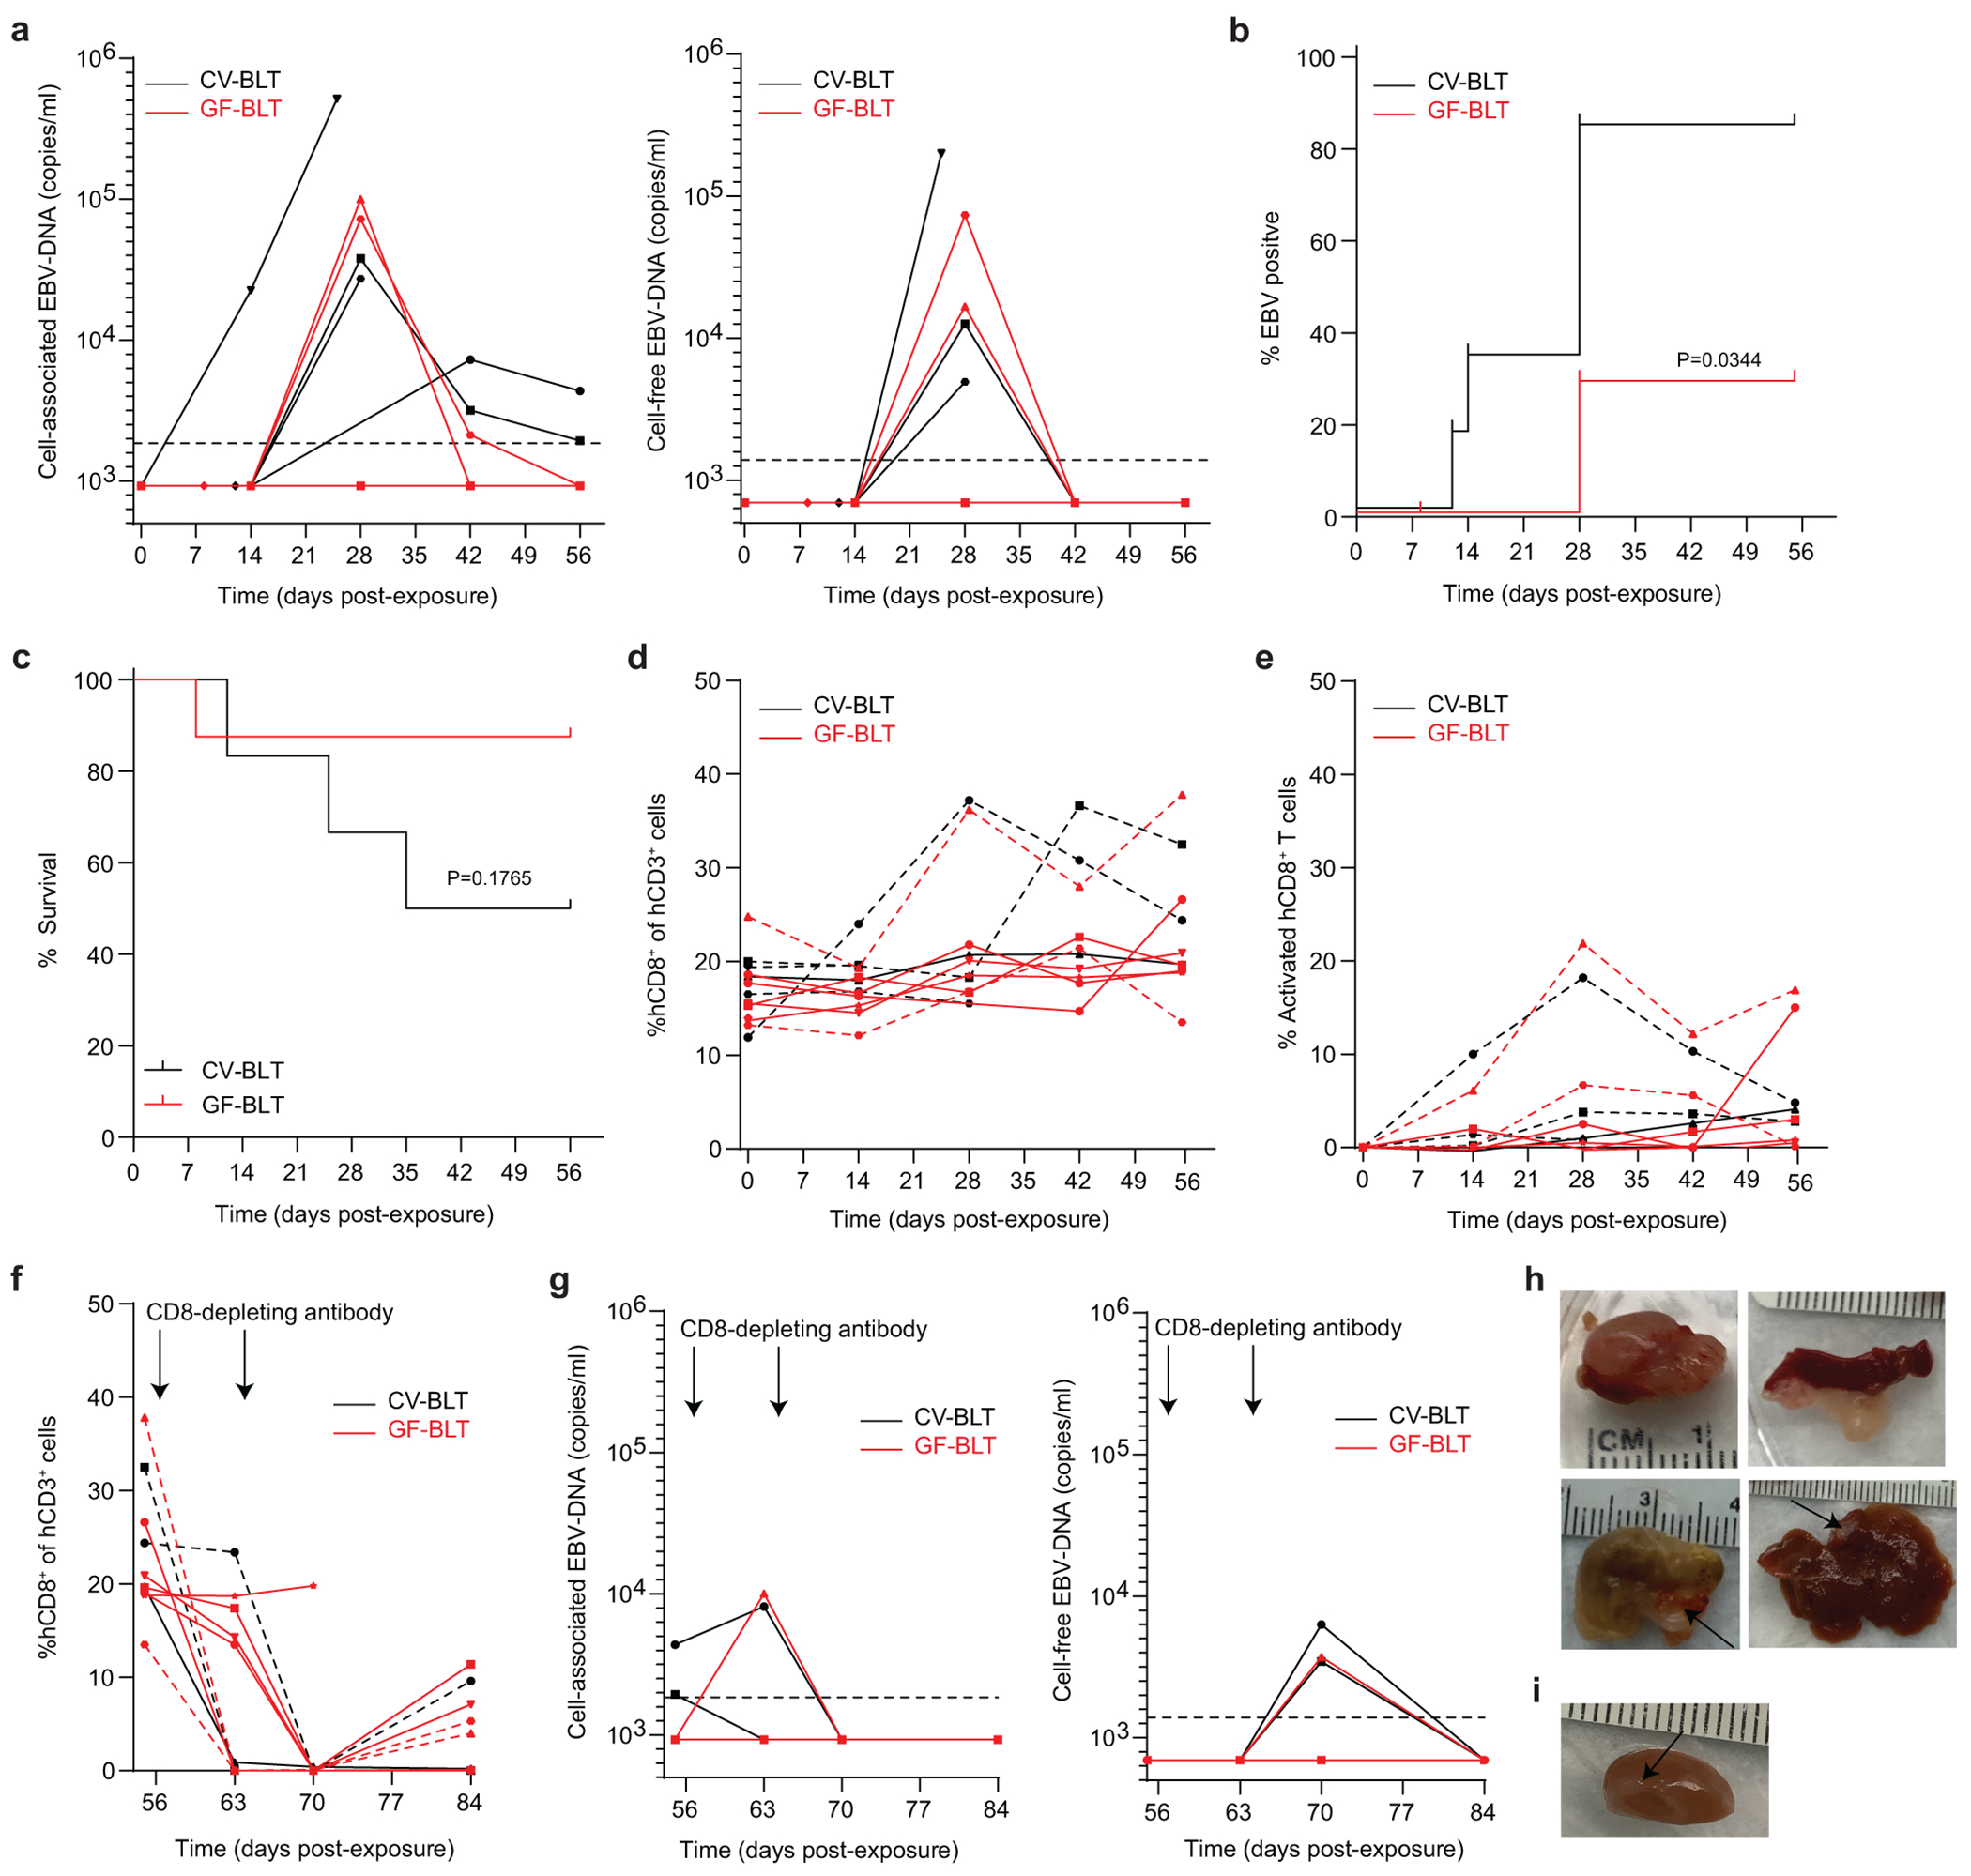
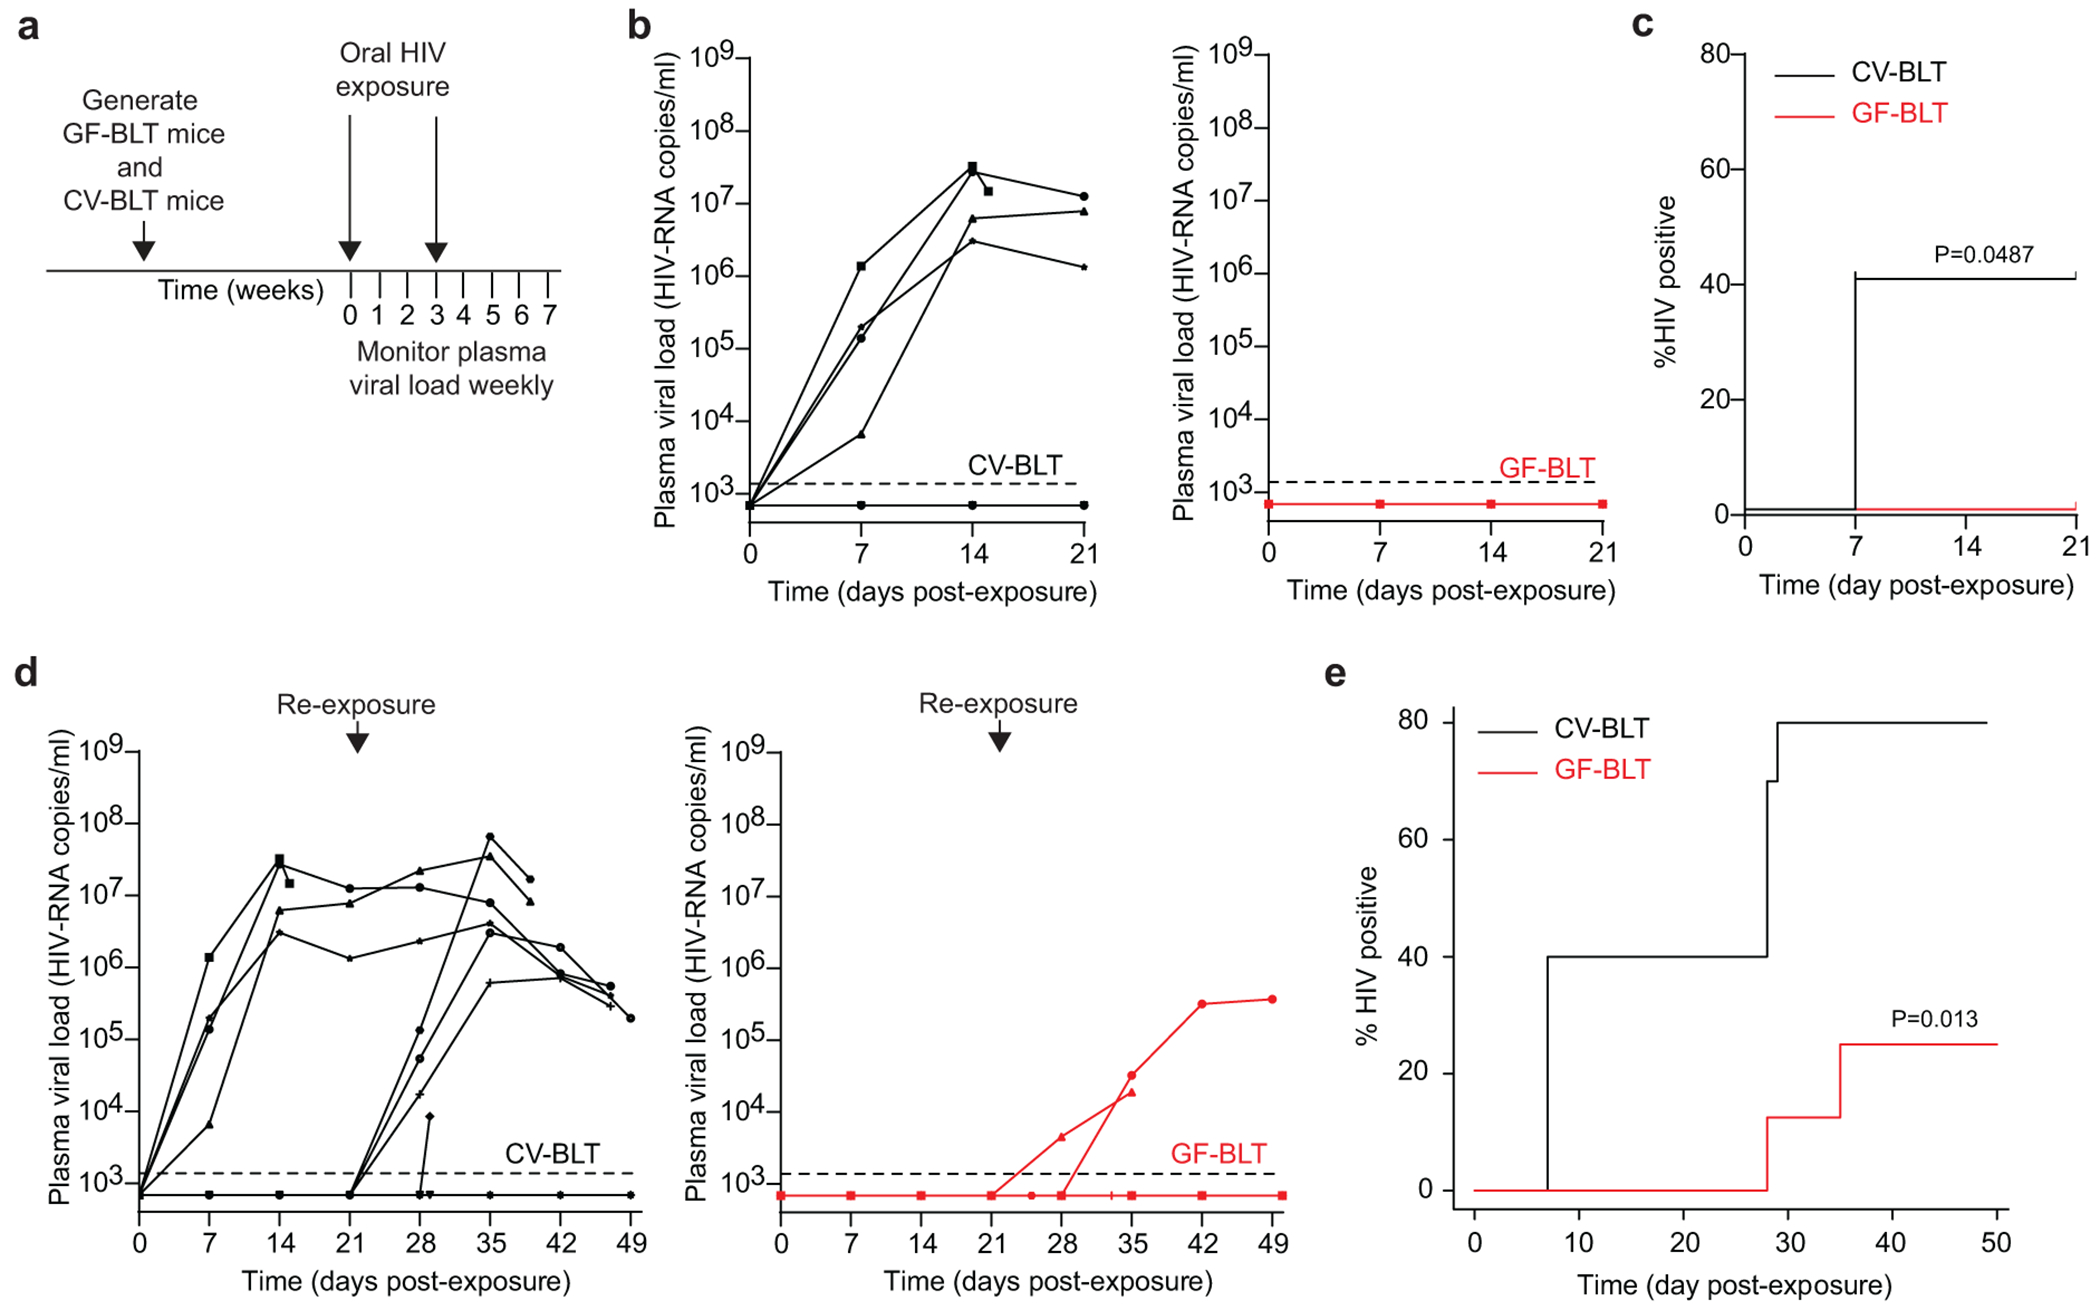
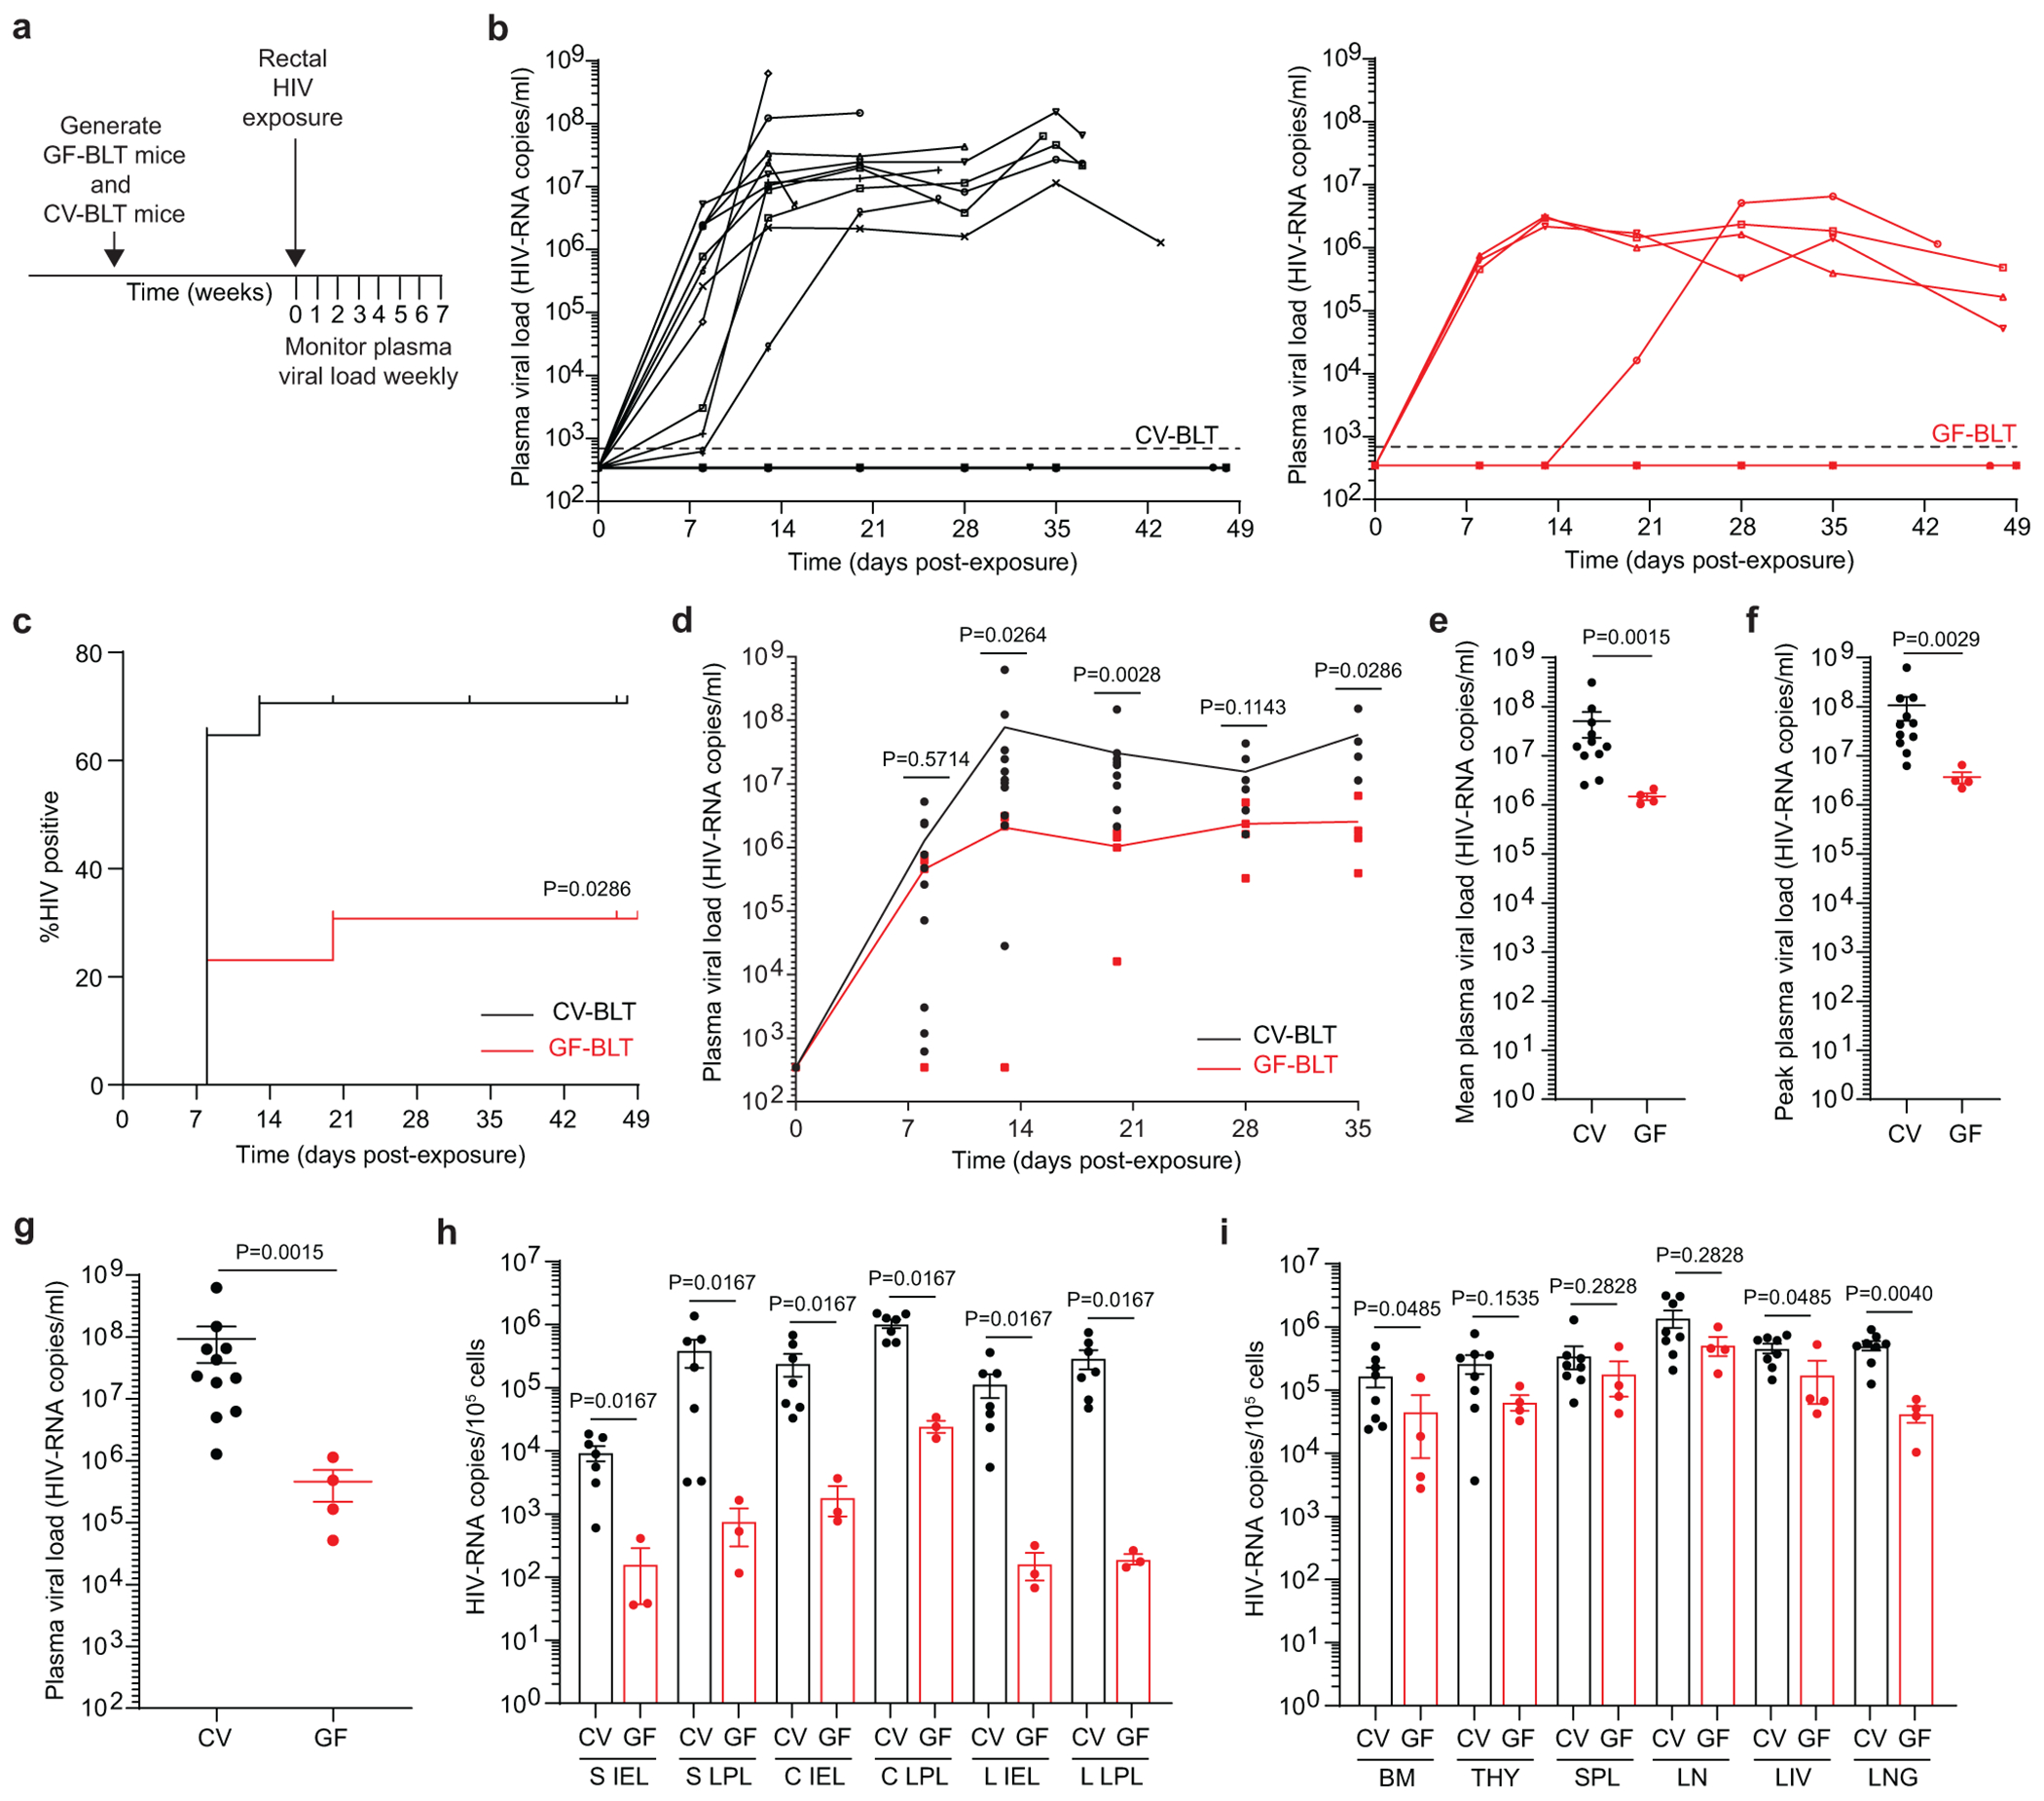
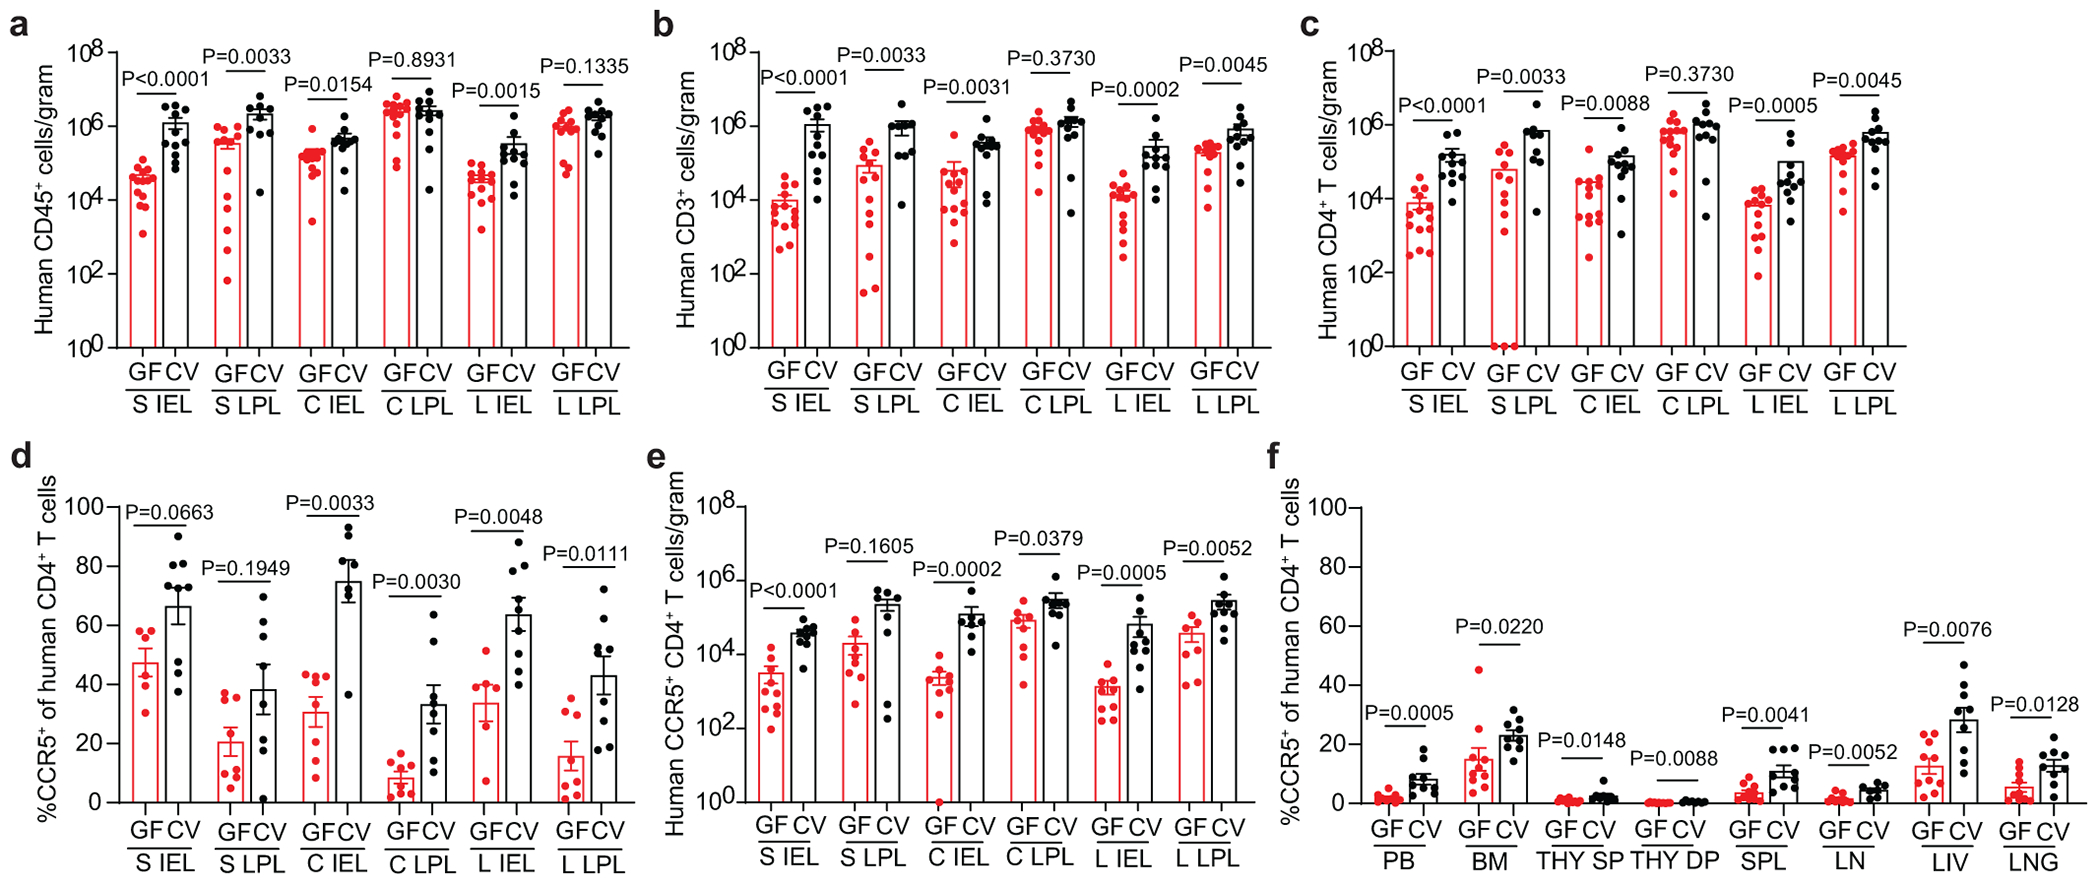
Germ-free (GF) mice, which are depleted of their resident microbiota, are the gold standard for exploring the role of the microbiome in health and disease; however, they are of limited value in the study of human-specific pathogens because they do not support their replication. Here, we develop GF mice systemically reconstituted with human immune cells and use them to evaluate the role of the resident microbiome in the acquisition, replication and pathogenesis of two human-specific pathogens, Epstein-Barr virus (EBV) and human immunodeficiency virus (HIV). Comparison with conventional (CV) humanized mice showed that resident microbiota enhance the establishment of EBV infection and EBV-induced tumorigenesis and increase mucosal HIV acquisition and replication. HIV RNA levels were higher in plasma and tissues of CV humanized mice compared with GF humanized mice. The frequency of CCR5+ CD4+ T cells throughout the intestine was also higher in CV humanized mice, indicating that resident microbiota govern levels of HIV target cells. Thus, resident microbiota promote the acquisition and pathogenesis of two clinically relevant human-specific pathogens.


Conflict of interest statement

Competing interests: The authors declare no competing interests.

Figures

Extended Data Fig. 1.
Extended Data Fig. 1.. Fecal bacterial microbiome of CV-BLT mice.
The composition of the bacterial microbiome was analyzed by 16S amplicon sequencing in fecal pellets collected from CV-BLT mice (n=10). The mean relative abundance at the a, phylum and b, genus levels are shown. Taxa with a mean relative abundance <2% were grouped together as other.
Extended Data Fig. 2.
Extended Data Fig. 2.. Human hematopoietic cells are present in lymphoid and non-lymphoid tissues of GF-BLT mice.
Immunohistochemical staining for a, human hematopoietic cells (hCD45+) including human dendritic cells (hCD11c+), myeloid cells (hCD68+), B cells (hCD20+) and T cells (hCD3+) in the spleen (n=6 analyzed), lymph nodes (n=5 analyzed), liver (n=5 analyzed), and lung (n=6 analyzed) of GF-BLT mice and b, human B cells (hCD20+) in the small intestine (n=3 analyzed), cecum (n=6 analyzed), and large intestine colon (n=3 analyzed). Positive cells are stained brown. Scale bars, 100 um. c, Flow cytometric analysis of human T cell levels in the intraepithelial layer (IEL) and lamina propria layer (LPL) of the small intestine (S), cecum (C), and large intestine (L) of GF-BLT mice (n=14 S IEL, C LPL; n=13 S LPL, C IEL, L IEL; n=12 L LPL). Horizontal and vertical lines represent the mean and standard error mean respectively.
Extended Data Fig. 3.
Extended Data Fig. 3.. CD21 expression on human splenic B cells in CV-BLT and GF-BLT mice.
CD21 expression was evaluated on human B cells isolated from the spleen of CV-BLT (n=5, black) and GF-BLT (n=5, red) mice using flow cytometry. The a, percent of human B cells expressing CD21 and the b, mean fluorescent intensity (MFI) of CD21 staining on CD21+ human B cells was compared between CV-BLT and GF-BLT mice with a two-sided Mann-Whitney test. Horizontal and vertical lines represent the mean and standard error mean respectively.
Extended Data Fig. 4.
Extended Data Fig. 4.. HIV replication is enhanced in the presence of resident microbiota following a systemic HIV exposure.
CV-BLT mice (n=8) and GF-BLT mice (n=8) were challenged systemically with HIV-1JRCSF. HIV-RNA levels in peripheral blood plasma were monitored longitudinally by real-time PCR. Five weeks post-exposure, aviremic BLT mice were administered a second systemic dose of HIV. GF-BLT mice were housed in a gnotobiotic isolator for the duration of the study and their GF status monitored longitudinally. a, Peripheral blood plasma viral load (HIV-RNA copies/ml) in CV-BLT mice (left panel, black) and GF-BLT mice (right panel, red) following HIV challenge. The limit of detection is shown with a dashed line. b, Percent HIV positive CV-BLT mice (black) and GF-BLT mice were compared with a two-sided log-rank Mantel Cox test based on the presence of HIV-RNA and/or HIV-DNA in peripheral blood and/or tissues. c, Peripheral blood plasma viral load of viremic CV-BLT mice (n=7, black) and GF-BLT mice (n=6, red). For mice that acquired HIV infection after the second challenge, week one represents the viral load one week after the second HIV exposure (6 weeks after the first exposure). Solid lines represent mean plasma viral loads. d, Mean and e, peak plasma viral load of viremic CV-BLT mice (n=7, black) and GF-BLT mice (n=6, red). f, HIV-RNA levels in the bone marrow (BM), human thymus (THY), spleen (SPL), lymph nodes (LN), liver (LIV), and lung (LNG) of viremic CV-BLT mice (n=6, black) and GF-BLT mice (n=6, red). In d-f, horizontal and vertical lines represent the mean and standard error mean respectively. c-f, HIV-RNA levels were compared with a two-sided Mann-Whitney test.
Extended Data Fig. 5.
Extended Data Fig. 5.. CD8+ T cell activation is more pronounced in the intestinal tract in the presence of resident microbiota following rectal HIV acquisition.
Flow cytometric analysis of a, activated (HLA-DR+CD38+) human CD8+ T cells of viremic GF-BLT (red) and CV-BLT (black) mice at day 8 (GF, n=4; CV n=12), day 13 (GF, n=4; CV n=12), day 20 (GF, n=4; CV n=9), day 28 (GF, n=4; CV n=5) and day 35 (GF, n=4; CV n=4) post rectal HIV acquisition. Percent activated human CD8+ T cells in the b, PB, bone marrow (BM), spleen (SPL), lymph nodes (LN), human thymic organoid (THY), liver (LIV), and lung (LNG) as well as the c, small intestine (S), cecum (C), and large intestine (L) intraepithelial layer (IEL) and lamina propria layer (LPL) of aviremic (filled bars) and viremic (open bars) GF-BLT mice. Aviremic GF-BLT mice, n=9 (PB, BM, SPL, LN, THY, LIV), n=8 (LNG, S IEL, C IEL, C LPL, L IEL, L LPL), or n=4 (S LPL). Viremic GF-BLT mice, n=4 (PB, BM, SPL, LN, THY, LIV, LNG) or n=3 (S IEL, S LPL, C IEL, C LPL, L IEL, L LPL). Percent activated human CD8+ T cells in the d, PB, BM, SPL, LN, THY, LIV, and LNG as well as the e, S IEL, S LPL, C IEL, C LPL, L IEL, and L LPL of aviremic (filled bars) and viremic (open bars) CV-BLT mice. Aviremic CV-BLT mice, n=5 (PB, BM, SPL, LN, THY, LIV, LNG, S IEL, C IEL, C LPL, L IEL, L LPL), n=3 (S LPL). Viremic CV-BLT mice, n=8 (PB, BM, SPL, LN, LIV, LNG), n=7 (S IEL, C IEL, C LPL, L IEL, L LPL), or n=6 (THY, S LPL). SP, CD8+ single positive thymocyte. DP, CD4+CD8+ double positive thymocyte. b-e, Shown is the difference in percent activated CD8+ T cells between viremic and aviremic mice. Horizontal and vertical lines represent the mean and standard error mean respectively. a-e, Cell levels mice were compared with a two-sided Mann-Whitney test.
Extended Data Fig. 6.
Extended Data Fig. 6.. HIV infection mediated CD4+ T cell depletion is not impacted by the presence of resident microbiota.
Flow cytometric analysis of a, human CD4+ T cells in the peripheral blood (PB) of viremic GF-BLT (red) and CV-BLT (black) mice at day 8 (GF, n=4; CV n=12), day 13 (GF, n=4; CV n=12), day 20 (GF, n=4; CV n=9), day 28 (GF, n=4; CV n=5) and day 35 (GF, n=4; CV n=4) post rectal HIV acquisition. Percent CD4+ of human T cells in the b, PB, bone marrow (BM), spleen (SPL), lymph nodes (LN), human thymic organoid (THY), liver (LIV), and lung (LNG) as well as the c, small intestine (S), cecum (C), and large intestine (L) intraepithelial layer (IEL) and lamina propria layer (LPL) of aviremic (filled bars) and viremic (open bars) GF-BLT mice. Aviremic GF-BLT mice, n=9 (PB, BM, SPL, LN, THY, LIV), n=8 (LNG, S IEL, C IEL, C LPL, L IEL, L LPL), or n=5 (S LPL). Viremic GF-BLT mice, n=4 (PB, BM, SPL, LN, THY, LIV, LNG) or n=3 (S IEL, S LPL, C IEL, C LPL, L IEL, L LPL). Percent CD4+ of human T cells in the d, PB, BM, SPL, LN, THY, LIV, and LNG as well as the e, S IEL, S LPL, C IEL, C LPL, L IEL, and L LPL of aviremic (filled bars) and viremic (open bars) CV-BLT mice. Aviremic CV-BLT mice, n=5 (PB, BM, SPL, LN, THY, LIV, LNG, S IEL, C IEL, C LPL, L IEL, L LPL), n=4 (S LPL). Viremic CV-BLT mice, n=8 (PB, BM, SPL, LN, LIV, LNG), n=7 (S IEL, C IEL, C LPL, L IEL, L LPL), or n=6 (THY, S LPL). SP, CD4+ single positive thymocyte. DP, CD4+CD8+ double positive thymocyte. b-e, Shown is the difference in percent CD4+ T cells between viremic and avirmic mice. Horizontal and vertical lines represent the mean and standard error mean respectively. a-e, Cell levels mice were compared with a two-sided Mann-Whitney test.
Extended Data Fig. 7.
Extended Data Fig. 7.. Minimal impact of resident microbiota on human CD4+ T cell homeostasis in the peripheral blood and non-intestinal tissues.
Numbers of a, human hematopoietic cells (hCD45+), including b, T cells (hCD3+) and c, CD4+ T cells in the small intestine (S) and large intestine (L) intraepithelial (IEL) and lamina propria (LPL) layers of GF-BLT mice (GF; red bars; S IEL, n=14; S LPL, n=13; L IEL, n=13; L LPL, n=12) and CV-BLT mice (CV; black; S IEL, n=11; S LPL, n=9; L IEL, n=11; L LPL, n=11) were determined by flow cytometric analysis. Flow cytometric analysis of human hematopoietic cells (hCD45+) including T cells (hCD3+) and CD4+ T cells in the d, peripheral blood (GF, n=16; CV, n=11), e, bone marrow (GF, n=14; CV, n=11), f, thymic organoid (GF, n=15; CV, n=11), g, spleen (GF, n=16; CV, n=11), h, lymph nodes (GF, n=15; CV, n=10), i, liver (GF, n=16; CV, n=11), and j, lung (GF, n=16; CV, n=11) of GF-BLT (GF; red boxes) and CV-BLT (CV; black boxes). Cell counts are normalized to a-c, tissue length (cm) or f, g, i, j, weight (g). SP, CD4+ single positive thymocyte. DP, CD4+CD8+ double positive thymocyte. Horizontal and vertical lines represent the mean and standard error mean respectively. Cell levels between GF-BLT and CV-BLT mice were compared with a two-sided Mann-Whitney test. a and b, The exact p values shown as P<0.0001 for comparisons of human CD45+ and CD3+ T cell numbers in the S IEL are P=0.000020 and P=0.000043 respectively.
Extended Data Fig. 8.
Extended Data Fig. 8.. Resident microbiota regulate human CD8+ T cell homeostasis in the intestinal tract.
Levels of human a-c, B cells, d-f, myeloid cells, and g-i, CD8+ T cells in the peripheral blood (GF, n=15; CV, n=11), bone marrow (BM; GF, n=14; CV, n=11), thymic organoid (THY; GF, n=15; CV, n=11), spleen (SPL; GF, n=16; CV, n=11), lymph nodes (LN; GF, n=15; CV, n=10), liver (LIV; GF, n=16; CV, n=11), lung (LNG; GF, n=16; CV, n=11) and the small intestine (S), cecum (C), and large intestine (L) intraepithelial layer (IEL; GF, n=13; CV, n=11) and lamina propria layer (LPL; GF S LPL, n=13; CV S LPL, n=9 CV-BLT; GF C LPL, n=14; CV CLPL, n=11; GF LPL, n=12; CV LPL, n=11) of GF-BLT (GF, red boxes) and CV-BLT mice (CV, black boxes). Horizontal and vertical lines represent the mean and standard error mean respectively. Cell levels between GF-BLT and CV-BLT mice were compared with a two-sided Mann-Whitney test. e and i, The exact p values shown as P<0.0001 for comparisons of human myeloid cell numbers in the SPL and human CD8+ T cell numbers in the S IEL and L IEL are P=0.000041, P=0.000020, and P=0.000077 respectively.
Fig. 1.
Fig. 1.. GF-BLT mice are systemically reconstituted human hematopoietic cells.
a, Construction of GF-BLT mice. b, Levels of human hematopoietic cells (hCD45+) in the peripheral blood (PB) of germ-free BLT mice (n=29). Colors indicate individual GF-BLT cohorts. c, Human hematopoietic cells (hCD45+), myeloid cells (hCD33+), T cells (hCD3+), B cells (hCD19+), plasmacytoid dendritic cells (hCD123+), and myeloid dendritic cells (hCD11c+) in the peripheral blood of a GF-BLT mouse analyzed at 52 weeks post-surgery by flow cytometry. SSC, side scatter. d, Human hematopoietic cells (hCD45+) in the PB (n=16), bone marrow (BM, n=14), thymic organoid (THY, n=15), spleen (SPL, n=16), lymph nodes (LN, n=15), liver (LIV, n=16), and lung (LNG, n=16) of GF-BLT mice by flow cytometry. Immunohistochemical staining for e, human hematopoietic cells (hCD45+) and f, human macrophages (hCD68+), dendritic cells (hCD11c+), T cells (hCD3+), and CD4+ T cells (hCD4+) in the small intestine (n=3 analyzed), cecum (n=6 analyzed), and large intestine colon (n=3 analyzed) of a GF-BLT mouse. Scale bars, 100 um. b and d, Horizontal and vertical lines represent the mean and standard error mean respectively.
Fig. 2.
Fig. 2.. The establishment of EBV infection and EBV-induced tumorigenesis is increased in the presence of resident microbiota.
CV-BLT mice (black, n=6) and GF-BLT mice (red, n=8) were exposed to EBV by intraperitoneal injection. a, Cell-associated and cell-free EBV-DNA levels in peripheral blood were monitored longitudinally by real-time PCR. Percent b, EBV positive and c, survival of CV-BLT mice (black) and GF-BLT mice at 8 weeks post-EBV exposure were compared with a two-sided log-rank Mantel-Cox test. Levels of human d, CD8+ T cells and e, activated (CD38+HLA-DR+) CD8+ T cells in CV-BLT mice (black) and GF-BLT mice (red) as determined by flow cytometric analysis. After 8 weeks post-exposure, CV-BLT mice (black) and GF-BLT mice (red) were administered CD8-depleting antibody once per week for two weeks and the levels of f, human CD8+ T cells and g, cell-associated (left panel) and cell-free (right panel) EBV-DNA in peripheral blood measured longitudinally. Images of macroscopic tumors present on h, the kidney, spleen, stomach, and liver of CV-BLT mice and i, the kidney of a GF-BLT mouse at necropsy. In a and g, the limit of detection is shown with a dashed line. In d-f, viremic mice are shown with a dashed line.
Fig. 3.
Fig. 3.. Oral HIV acquisition is increased in the presence of resident microbiota.
a, CV-BLT mice (n=10) and GF-BLT mice (n=8) were challenged orally with HIV-1JRCSF. HIV-RNA levels in peripheral blood plasma were monitored longitudinally by real-time PCR. Three weeks post-exposure, aviremic BLT mice were administered a second oral dose of HIV. GF-BLT mice were housed in a gnotobiotic isolator for the duration of the study and their GF status monitored longitudinally. b, Peripheral blood plasma viral load (HIV-RNA copies/ml) in CV-BLT mice (left panel, black) and GF-BLT mice (right panel, red) following a single HIV oral challenge. c, Percent HIV positive CV-BLT mice (black) and GF-BLT mice following one oral HIV dose was compared with a two-sided log-rank Mantel-Cox test. d, Peripheral blood plasma viral load (HIV-RNA copies/ml) in CV-BLT mice (left panel, black) and GF-BLT mice (right panel, red) following a second oral HIV challenge. e, Percent HIV positive CV-BLT mice (black) and GF-BLT mice following two oral HIV exposures were compared with a two-sided exact version of Gray’s test. b and d, The limit of detection is shown with a dashed line.
Fig. 4.
Fig. 4.. Rectal HIV acquisition and virus replication in the intestinal tract are enhanced in the presence of resident microbiota.
a, CV-BLT mice (n=17) and GF-BLT mice (n=13) were challenged with a single rectal dose of HIV-1. HIV-RNA levels in peripheral blood plasma were monitored longitudinally with real-time PCR. GF-BLT mice were housed in a gnotobiotic isolator for the duration of the study and their GF status monitored longitudinally. b, Peripheral blood plasma viral load (HIV-RNA copies/ml) in CV-BLT mice (left panel, black) and GF-BLT mice (right panel, red) following rectal HIV challenge. The limit of detection is shown with a dashed line. c, Percent HIV positive CV-BLT mice (black) and GF-BLT mice was compared with a two-sided log-rank Mantel-Cox test. d, Peripheral blood plasma viral load of viremic CV-BLT mice (n=11, black) and GF-BLT mice (n=4, red). Solid lines represent mean plasma viral loads. e, Mean and f, peak plasma viral load of viremic CV-BLT mice (n=11, black) and GF-BLT mice (n=4, red). HIV-RNA levels in the g, peripheral blood plasma (CV-BLT mice, n=11; GF-BLT mice, n=4) and cells isolated from h, GI tract tissues (CV-BLT mice, n=7; GF-BLT mice, n=3) and i, non-GI tract tissues (CV-BLT mice, n=8; GF-BLT mice, n=4) of viremic CV-BLT mice (black) and GF-BLT mice (red) at necropsy. S, small intestine; C, cecum; L, large intestine colon; IEL, intraepithelial layer; LPL, lamina propria layer; BM, bone marrow; THY, human thymus; SPL, spleen; LN, lymph nodes; LIV, liver. In e-i, horizontal and vertical lines represent the mean and standard error mean respectively. d-i, HIV-RNA levels were compared with a two-sided Mann-Whitney test.
Fig. 5.
Fig. 5.. Resident microbiota increase HIV target cell levels in the intestinal tract.
Numbers of a, human hematopoietic cells (hCD45+), including b, T cells (hCD3+) and c, CD4+ T cells in the small intestine (S), cecum (C), and large intestine (L) intraepithelial (IEL) and lamina propria (LPL) layers of GF-BLT mice (GF; red bars; S IEL, n=14; S LPL, n=13; C IEL, n=13; C LPL, n=14; L IEL, n=13; L LPL, n=12) and CV-BLT mice (CV; black; S IEL, n=11; S LPL, n=9; C IEL, n=11; C LPL, n=11; L IEL, n=11; L LPL, n=11) were determined by flow cytometric analysis. d, Percent of human CD4+ T cells expressing CCR5 in the S IEL (GF, n=6; CV, n=9), S LPL (GF, n=8; CV, n=8) C IEL (GF, n=8; CV, n=7), C LPL (GF, n=8; CV, n=8), L IEL (GF, n=6; CV, n=9), and L LPL (GF, n=8; CV, n=9) of GF-BLT (GF; red bars) and CV-BLT (CV; black bars) mice and e, numbers of human CCR5+ CD4+ T cells in the S IEL (GF, n=10; CV, n=9), S LPL (GF, n=8; CV, n=8) C IEL (GF, n=9; CV, n=7), C LPL (GF, n=8; CV, n=8), L IEL (GF, n=9; CV, n=9), and L LPL (GF, n=7; CV, n=9) of GF-BLT (GF; red bars) and CV-BLT (CV; black bars) mice. f, Percent of human CD4+ T cells expressing CCR5 in the peripheral blood (PB; GF, n=9; CV, n=9), bone marrow (BM; GF, n=10; CV, n=9), thymic organoid (THY; GF, n=11, CV, n=8), spleen (SPL; GF, n=10; CV, n= 9), lymph nodes (LN; GF, n=9; CV, n=7), liver (LIV; GF, n=10; CV, n=9), and lung (LNG; GF, n=10; CV, n=9) of GF-BLT (GF; red bars) and CV-BLT (CV; black bars) mice. SP, CD4+ single positive thymocyte. DP, CD4+CD8+ double positive thymocyte. Horizontal and vertical lines represent the mean and standard error mean respectively. A two-sided Mann-Whitney test was used to compare cell levels. a-c, e, The exact p values shown as P<0.0001 for the S IEL are as follows, Human CD45+ cells/gram: P=0.000003, Human CD3+ cells/gram: P=0.000008, Human CD4+ T cells/gram: P=0.000008, and Human CCR5+ CD4+ T cells/gram: P=0.000086.

References

    1. Brestoff JR & Artis D Commensal bacteria at the interface of host metabolism and the immune system. Nat Immunol 14, 676–684 (2013). - PMC - PubMed
    1. Chung H. et al. Gut immune maturation depends on colonization with a host-specific microbiota. Cell 149, 1578–1593 (2012). - PMC - PubMed
    1. Robinson CM & Pfeiffer JK Viruses and the Microbiota. Annu Rev Virol 1, 55–69 (2014). - PMC - PubMed
    1. Ubeda C, Djukovic A & Isaac S Roles of the intestinal microbiota in pathogen protection. Clin Transl Immunology 6, e128 (2017). - PMC - PubMed
    1. Baldridge MT et al. Commensal microbes and interferon-lambda determine persistence of enteric murine norovirus infection. Science 347, 266–269 (2015). - PMC - PubMed

Methods-only References

    1. Packey CD et al. Molecular detection of bacterial contamination in gnotobiotic rodent units. Gut Microbes 4, 361–370 (2013). - PMC - PubMed
    1. Denton PW et al. IL-2 receptor gamma-chain molecule is critical for intestinal T-cell reconstitution in humanized mice. Mucosal immunology 5, 555–566 (2012). - PMC - PubMed
    1. Nochi T, Denton PW, Wahl A & Garcia JV Cryptopatches are essential for the development of human GALT. Cell Rep 3, 1874–1884 (2013). - PMC - PubMed
    1. Allali I et al. A comparison of sequencing platforms and bioinformatics pipelines for compositional analysis of the gut microbiome. BMC Microbiol 17, 194 (2017). - PMC - PubMed
    1. Azcarate-Peril MA et al. An Attenuated Salmonella enterica Serovar Typhimurium Strain and Galacto-Oligosaccharides Accelerate Clearance of Salmonella Infections in Poultry through Modifications to the Gut Microbiome. Appl Environ Microbiol 84, e02526–17 (2018). - PMC - PubMed