. 2024 Mar;42(3):437-447.
doi: 10.1038/s41587-023-01900-x. Epub 2023 Aug 10.

Generation of precision preclinical cancer models using regulated in vivo base editing

Affiliations

Generation of precision preclinical cancer models using regulated in vivo base editing

Alyna Katti et al. Nat Biotechnol. 2024 Mar.

Abstract

Although single-nucleotide variants (SNVs) make up the majority of cancer-associated genetic changes and have been comprehensively catalogued, little is known about their impact on tumor initiation and progression. To enable the functional interrogation of cancer-associated SNVs, we developed a mouse system for temporal and regulatable in vivo base editing. The inducible base editing (iBE) mouse carries a single expression-optimized cytosine base editor transgene under the control of a tetracycline response element and enables robust, doxycycline-dependent expression across a broad range of tissues in vivo. Combined with plasmid-based or synthetic guide RNAs, iBE drives efficient engineering of individual or multiple SNVs in intestinal, lung and pancreatic organoids. Temporal regulation of base editor activity allows controlled sequential genome editing ex vivo and in vivo, and delivery of sgRNAs directly to target tissues facilitates generation of in situ preclinical cancer models.


Conflict of interest statement

L.E.D. is a scientific advisor and holds equity in Mirimus Inc. L.E.D. has received consulting fees and/or honoraria from Volastra Therapeutics, Revolution Medicines, Repare Therapeutics, Fog Pharma, and Frazier Healthcare Partners. S.W.L is an advisor for and has equity in the following biotechnology companies: ORIC Pharmaceuticals, Faeth Therapeutics, Blueprint Medicines, Geras Bio, Mirimus Inc., PMV Pharmaceuticals, and Constellation Pharmaceuticals. SWL acknowledges receiving funding and research support from Agilent Technologies for the purposes of massively parallel oligo synthesis. K.H., A.P.K, and J.A.W are employees and shareholders of Synthego Corporation.

Figures

Extended Figure 1:
Extended Figure 1:. Regulatable BE expression in vivo
a. Calculated BE3RA transgene copy number in iBEhem and iBEhom using a Taqman quantiative PCR assay with genomic DNA from H11-LSL-Cas9 mice as a reference. Data are presented as mean values ± s.e.m. (*p<0.05, Student’s t-test). b. Schematic representation of the targeted RMCE site downstream of the Col1a1 locus. Primers flanking the knock-in cassette and a single primer within the targeted transgene can identify wildtype, hemizygous and homozygous animals, as shown in the example genotyping agarose gel c. Mendelian transmission of Col1a1-targeted iBE knock-in (with and without R26-CAGs-rtTA3 allele) and associated p-value (chi-square test) relative to expected Mendelian inheritance. d. Immunofluorescent detection of Cas9 protein in rtTA3 only and iBEhom mice maintained on normal chow (No dox) or doxycycline chow for 14 days (14D dox). (n=3 mice per genotype and condition). e. Immunofluorescent detection of Cas9 protein in iBEhem (top) or iBEhom (bottom) mice maintained on dox chow for 7 days across four tissues. (n=3 mice per genotype and condition).
Extended Figure 2:
Extended Figure 2:. Expression of BE3RA across different tissues in mice carrying one or two copy of each allele.
Immunofluorescent detection of Cas9 protein in rtTA3+/− iBE+/− (iBEhem), rtTA3+/+ iBE+/−, rtTA3+/− iBE+/+ and rtTA3+/+iBE+/+ (iBEhom) mice maintained on dox chow for 14 days. Cas9 protein(green), DAPI staining for nuclei (blue) across four tissues analyzed. (n=3 mice per genotype and condition).
Extended Figure 3:
Extended Figure 3:. Dox treatment does not induce abnormalities in iBEhom mice.
a. Hematoxylin and Eosin (H&E) staining in rtTA3+/−iBE−/− and rtTA3+/+iBE+/+ (iBEhom) on normal chow or doxycycline chow for 14 days. (n=3 mice). b. Flow cytometry analysis of spleen and bone marrow cell suspensions of rtTA3+/−iBE−/− and rtTA3+/+iBE+/+ (iBEhom) on normal chow or maintained on doxycycline chow for 14 days (n=3 mice). Data are presented as mean values ± s.d (*p<0.05, Student’s t-test).
Extended Figure 4:
Extended Figure 4:. iBE induces low off target RNA editing that is reversed by withdrawal of transgene expression.
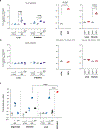
a. C to U editing in RNA transcripts detected from RNA sequencing data from intestine and liver from rtTAhem and iBEhom on normal chow (−), dox chow (+) for 14 days, or switched from dox chow for 14 days to normal chow for 6 days (SW). Data in the middle and right panels was derived from re-analysis of published datasets, as indicated under each plot. For experiments with multiple comparisons, p-values were calculated by one-way ANOVA, n=3 mice/condition. For individual pairwise comparisons, Student’s t-test was used. b. A to G editing in RNA transcripts detected from RNA sequencing data from intestine and liver from rtTAhem and iBEhom on normal chow (−), dox chow (+) for 14 days, or switched from dox chow for 14 days to normal chow for 6 days (SW). (n=3 mice). c. Transcript abundance (transcripts per million; TPM) in pancreatic organoids, intestine, and liver from rtTAhem and iBEhom on normal chow (−), dox chow (+) for 14 days, or switched from dox chow for 14 days to normal chow for 6 days (SW). All data shown are presented as mean values +/− s.d., n=3 mice/condition.
Extended Figure 5.
Extended Figure 5.. iBE has low DNA off target activity.
a. Schematic of experimental set up in mouse embryonic stem cells (ESCs). mESCs containing iBE knock in were transduced with LRT2B-gRNA vector and selected for gRNA expression. sgRNA+ cells were plated with and without dox for 6 days after which cells were plated at low density for clonal outgrowth without dox. 3 pools of 10 clones were picked for each dox conditions across to gRNA targeted cell lines (sgRNAs = Apc.Q1405X and Pik3ca.E545K). In total, 12 pools of 10 clones were sequenced at 800–1000-fold coverage across the MSK-IMPACT cancer gene set. b. Pie chart display of frequency of C>T or C>other SNVs found in pooled clones for each condition (on and off dox) for both sgRNAs. c. Sequencing analysis at cancer gene sites in cell conditions (right) described in a. Solid blue boxes represent on-target activity of the sgRNA, dotted orange boxes signify on-target ‘bystander’ editing within the gRNA window. d. Quantification of C>T and C>other SNVs found across both targets. 2-way ANOVA test for multiple comparisons was used to evaluate statistical significance across conditions. Data are presented as mean values ± s.e.m. p-values are displayed.
Extended Figure 6:
Extended Figure 6:. iBE does not induce off target RNA editing in organoids.
a. Schematic of experimental set up in iBE derived pancreatic organoids. Organoids were transduced and selected with GFPGO reporter (mScarlet+). Organoids maintained off dox were then split into dox conditions to induce BE expression for 4 days and then split again into + and – dox conditions for an additional day. b. Editing of organoids in each condition (OFF, D4, D8, and D4 sw) was quantified by flow cytometry, calculating the percentage of GFP+ cells within the mScarlet+ population. Data are presented as mean values ± s.e.m. One-way ANOVA with Tukey’s correction c. PCA analysis of RNA sequencing data from OFF, D8, and D4 SW organoids. Colors correspond to dox condition and shape delineates organoid replicate/mouse origin (n=3). d. Volcano plots from RNA-seq data comparing iBE pancreatic organoids culture on dox-containing media vs regular media. e. Off-target RNA editing analysis, processed as described for Supplementary Figure 4. No significant differences in RNA variants were observed, n=3, one-way ANOVA with Tukey’s correction. Data are presented as mean values ± s.e.m. For all data shown, n=3 independent organoid lines/condition.
Extended Figure 7:
Extended Figure 7:. Editing dynamics of iBE organoids.
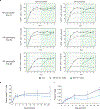
a. Flow cytometry analysis of three independent pancreatic KP mutant organoid lines integrated with GFPGO reporter following dox treatment for 0–8 days (black), transient exposure for 2h or 12h (grey), or transient exposure then re-treatment at 4 days (green). b. Targeted deep sequencing quantification of target C:G to T:A conversion at the ApcQ1405X locus in 2D small intestinal derived iBE cell line following dox addition for 21 days (dark blue), or transient dox treatment for 3 days and withdrawn for 18 days (light blue). c. Targeted deep sequencing quantification of indel conversion of b. Data are presented as mean values ± s.e.m. (*p<0.05, Student’s t-test) (n=3 independently derived line).
Extended Figure 8:
Extended Figure 8:. Efficient BE in iBE organoids with low collateral editing.
a. Targeted deep sequencing quantification of corresponding target C>T/A/G and indel conversion in small intestinal iBE organoids nucleofected with plasmid (light blue) or synthetic (indigo) gRNAs (ApcQ1405, Trp53Q97, CR8.OS2) as indicated, with and without dox treatment. b. Targeted deep sequencing quantification of target C>T/A/G and indel conversion in small intestinal iBE organoids nucleofected with synthetic gRNAs targeting cancer associated SNVs from Figure 2f. c-j. Quantification of collateral editing of adjacent cytosines for samples shown in Figure 2f. Predicted translation of each quantified read is shown below with targeted amino acid substitution (dark grey) and additional amino acid substitution (pink). All data are presented as mean values ± s.e.m.
Extended Figure 9:
Extended Figure 9:. Analysis of collateral editing before and after functional selection.
a-h. Quantification of collateral editing of adjacent cytosines for data shown in Figure 2f, unselected (white) and selected (color) in small intestinal iBE organoids nucleofected with various synthetic gRNAs targeting cancer associated SNVs.
Extended Figure 10.
Extended Figure 10.. In situ base editing with iBE by synthetic gRNA delivery drives liver tumors.
a. HTVI delivery of synthetic gRNAs with SB-Myc as in Figure 4. BF, H&E images, and IF staining for ß-catenin (green) and glutamine synthetase (GS, red) in livers with tumors. Number of transfected mice with palpable tumors is shown below each column. b. Quantification of target C:G to T:A conversion from tumors described in a). Each point corresponds to an isolated bulk tumor. (n=2–7 mice for a given gRNA target). Individual editing data color-coded by animal in Supplementary Figure 3. All data are presented as mean values ± s.e.m.
Figure 1.
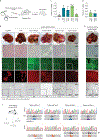
Figure 1.. Regulatable BE expression across murine tissues
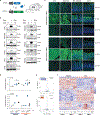
a. Schematic representation of iBE mice containing R26-CAGs-rtTA3 allele and TRE-BE3RA allele. b. Cas9 immunoblot on bulk tissue, as indicated, from iBEhem mice maintained on normal chow (Day 0, - dox), doxycycline chow for 7 days (Day7, + dox), or dox switched from doxycycline chow for 7 days to normal chow for 7 days (D14, -dox) across tissues bulk harvested for protein. ß-actin, loading control. Molecular weight: β-actin (42kDa), BE3RA (160kDa). Blots are representative of 2 independent experiments for each condition. c. Immunofluorescent detection of Cas9 protein in iBEhem (top) or iBEhom (bottom) mice maintained on normal chow (No dox) or doxycycline chow for 7 days (Day 7 Dox) or dox switched from dox chow for 7 days to normal chow for 7 days (Dox SW). Cas9 protein (green), DAPI staining for nuclei (blue) across four tissues analyzed. Data is representative of 3 independent mice for each condition – see Extended Data Fig. 1e for individual replicates. d. Transcript abundance (transcripts per million, TPM) in intestine and liver from rtTAhem and iBEhom on normal chow (−), dox chow (+) for 14 days, or switched from dox chow for 14 days to normal chow for 6 days (SW). Data are presented as mean values ± s.d., n=3 mice per genotype/condition. e. Volcano plots from RNA-seq data comparing rtTAhem vs iBEhom maintained on dox chow for 14 day (n=3 mice). f. Heat map of differentially expressed (DE) genes from intestine and liver from rtTAhem and iBEhom on normal chow (−), dox chow (+) for 14 days, or switched from dox chow for 14 days to normal chow for 6 days (SW). Includes DE gene between all conditions within the intestine and liver groups; does not include differentially expressed genes between different tissues (n=3 mice per genotype/condition).
Figure 2.
Figure 2.. Efficient base editing in ex vivo derived iBE organoids
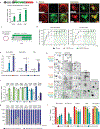
a. Schematic of GFPGO reporter and quantitation of BE-mediated GFP activation in mScarlet+ organoids with and without dox by flow cytometry. b. Live fluorescence imaging of small intestinal and pancreatic organoids containing stable integration of GFPGO lentiviral construct cultured without (no dox) or with dox. Dotted white line indicates central lumen of small intestinal organoids that produce bright autofluorescent signal. c. Schematic for dox treatment of KP pancreatic organoids to assess editing dynamics. d. Flow cytometry analysis of pancreatic KP mutant organoids integrated with GFPGO reporter following: continual dox treatment (0–8 days) (black), transient exposure to dox for 12h/2h (grey), or transient treatment and then re-exposure to dox in the same cells (green) (n=3 independently derived organoid cultures) e. Targeted deep sequencing quantification of target C:G to T:A conversion in small intestinal iBE organoids nucleofected with plasmid (light blue) or synthetic (indigo) gRNAs (ApcQ1405, Trp53Q97, CR8.OS2) as indicated, and WT organoids nucleofected with synthetic sgRNAs and an optimized BE (FNLS) cDNA plasmid (orange). f. Targeted deep sequencing quantification of target C:G to T:A conversion in dox-treated small intestinal iBE organoids nucleofected with various synthetic gRNAs as indicated, and either unselected (−) or selected with corresponding functional selective media condition. g. Frequency of precise amino acid substitution in small intestinal iBE organoids nucleofected with synthetic gRNAs in f. h. Brightfield images of small intestinal iBE organoids targeted with various gRNA combinations and dox conditions (left) taken through sequential selection of RspoI withdrawal, Nutlin3; Tgfß, and Selumetinib. Bolded black boxes are conditions failing to survive selection. Bolded green boxes indicate quadruple targeted organoids (with dox) surviving all four selection conditions. Images representative of 3 independently derived intestinal organoid cultures. i. Targeted deep sequencing quantification of target C:G to T:A conversion (and C> other or indels) in small intestinal iBE organoids nucleofected with 4 synthetic gRNAs in e (green boxes) at each gRNA target loci (ApcQ1405, Trp53C135, Smad4Q224, Pik3caE545. Media conditions and corresponding organoid genotype and sequencing information is grouped and listed above (n=3, p-values derived from one-way ANOVA with Tukey’s correction for multiple testing). All data are presented as mean values ± s.e.m. All experiments describing iBE organoids include three independently derived organoid cultures.
Figure 3:
Figure 3:. iBE enables sequential base editing in vitro and in vivo.
a. Schematic representation of the experimental workflow for sequential base editing in vivo. Wildtype small intestinal organoids were isolated from iBEhom mice and treated with dox to induce the BE alongside with synthetic sgRNA to engineer 4 oncogenic single nucleotide variants (as shown in Figure 2h). Dox was withdrawn to silence BE expression and a 5th sgRNA was introduced in a lentiviral vector carrying the GFPGO fluorescent BE reporter. Organoids were engrafted into the flanks or livers of recipient mice and tumors were allowed to form 10 days for sub-cutaneous injection or 8 weeks for liver engraftment. Mice were treated with systemic dox (in the chow) for 1 week to induce BE expression. b. Fluorescence imaging of quadruple mutant small intestine organoids containing stable integration of GFPGO reporter cultured without (no dox) or with dox. c. Quantification by flow cytometry of GFPGO activation in mScarlet+ organoids with and without dox from b. Data are presented as mean values ± s.e.m. (n=5 mice per condition) (*p<0.05, Student’s t-test, unpaired, two-sided). d. In vivo fluorescence imaging of mice containing subcutaneous tumors maintained on normal chow (No dox) or doxycycline chow for 7 days (D7 Dox). e. Immunohistochemical detection of GFP and mScarlet in subcutaneous tumors harvested from mice maintained on normal chow (No dox) or doxycycline chow for 7 days (D7 Dox). f. Quantification by flow cytometry of GFPGO activation in enzymatically digested subcutaneous tumors with and without dox. Data are presented as mean values ± s.e.m. (n=5 mice per condition) (*p<0.05, Student’s t-test, unpaired, two-sided). g. Wholemount fluorescence, H&E and immunohistochemical detection of GFP and mScarlet in liver tumors harvested from mice maintained on normal chow (No dox) or doxycycline chow for 7 days (D7 Dox). h. Quantification by flow cytometry of GFPGO activation in dissected and enzymatically digested liver tumors from g. Data are presented as mean values ± s.e.m. (n=5 mice per condition) (*p<0.05, Student’s t-test, unpaired, two-sided).
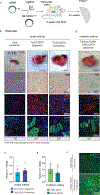
Figure 4:
Figure 4:. In situ base editing with iBE drives liver tumors.
a. Schematic for experimental setup of hydrodynamic teil vein (HTVI) injection mediated delivery of plasmid gRNA and sleeping beauty transposon mediated integration of cMyc cDNA (SB-Myc) in the liver of iBE mice maintained on dox for 1 week surrounding injection. Post injection, mice are monitored for tumor development and palpable tumors are harvested for tumor histological and sequencing analysis. b. Brightfield images of liver after harvest targeted according to the experimental pipeline in a) and with the corresponding gRNA listed (top). Hematoxylin and eosin (H&E) staining (2nd row) of corresponding liver lesions. Immunohistochemical staining of total ß catenin (green, 3rd row), glutamine synthetase (GS, red, 4th row) and p53 (black, 5th row). Fraction of number of mice with palpable tumors over number of mice injected is below each column. c-d. Targeted deep sequencing analysis of target C:G to T:A conversion in individual dissected tumors collected in ‘b’ delineated by sgRNA/target site for individual (c) or multiplexed (d) experiments. Each point corresponds to a physically isolated individual bulk tumor; n=3 mice minimum for a given sgRNA target. Individual editing data color-coded by animal is shown in Supplementary Figure 3. Data are presented as mean values ± s.e.m. e. Brightfield images of liver after multiplexed delivery of SB-Myc and both Trp53M237I and Ctnnb1S33F sgRNAs. f. Sequencing of target sites of cell lines derived from individual liver tumor isolated from mice targeted with both Ctnnb1S33F and Trp53M237I. Predicted translation of sequenced regions is shown below with WT amino acid (grey) and targeted amino acid substitution for Ctnnb1 (blue) and Trp53 (orange).
Figure 5.
Figure 5.. Efficient engineering of missense mutations in pancreatic tumor models.
a. Schematic for experimental setup of pancreatic electroporation mediated delivery of gRNA and sleeping beauty transposon mediated integration of KrasG12D cDNA (SB-Kras) in the pancreas of iBEhom mice maintained on dox for 2 weeks surrounding electroporation. Post electroporation, mice are monitored for tumor development and palpable tumors are harvested for tumor histological and sequencing analysis. b. Brightfield images of pancreas tumor with spleen attached (top row) using plasmid or synthetic gRNA. Hematoxylin and eosin (H&E) staining (2nd row) of pancreatic tumors electroporated as in panel (a) for gRNAs listed. Immunohistochemical staining of alpha smooth muscle actin (aSMA, red, 3rd row) and cytokeratin-19 (CK19, green, 4th row) counterstained with DAPI (blue). Number of mice with palpable tumors over number of mice injected is below each column. c. Targeted deep sequencing analysis of target C:G to T:A conversion in tumors collected in b) for plasmid gRNA (left) and synthetic gRNA (right). Each point corresponds to one mouse analyzed. (n=3 mice minimum for a given gRNA target). Data are presented as mean values ± s.e.m. d. Brightfield images of pancreas tumor with spleen attached (top row) using plasmid gRNA targeting both Trp53Q97X and Pik3caE545. e. Targeted deep sequencing analysis of target C:G to T:A conversion in pancreatic tumors collected using plasmid gRNA targeting both Trp53Q97X and Pik3caE545. Each point corresponds to one mouse analyzed. (n=4). Data are presented as mean values ± s.e.m. f. Immunohistochemical staining of pAKTS473 in pancreatic tumors using gRNA targeting Trp53Q97X alone or both Trp53Q97X and Pik3caE545. Image shown is representative of n=4 independent tumors analyzed.

References

    1. Goodwin S, McPherson JD & McCombie WR. Coming of age: ten years of next-generation sequencing technologies. Nat Rev Genet 17, 333–351 (2016). - PMC - PubMed
    1. Landrum MJ et al. ClinVar: public archive of interpretations of clinically relevant variants. Nucleic Acids Res 44, D862–868 (2016). - PMC - PubMed
    1. Vogelstein B et al. Cancer genome landscapes. Science 339, 1546–1558 (2013). - PMC - PubMed
    1. Vivanco I et al. Differential sensitivity of glioma- versus lung cancer-specific EGFR mutations to EGFR kinase inhibitors. Cancer Discov 2, 458–471 (2012). - PMC - PubMed
    1. Hyman DM et al. AKT Inhibition in Solid Tumors With AKT1 Mutations. J Clin Oncol 35, 2251–2259 (2017). - PMC - PubMed

Substances

LinkOut - more resources