. 2023 Oct;24(10):1748-1761.
doi: 10.1038/s41590-023-01589-9. Epub 2023 Aug 10.

Identification of human exTreg cells as CD16+CD56+ cytotoxic CD4+ T cells

Affiliations

Identification of human exTreg cells as CD16+CD56+ cytotoxic CD4+ T cells

Antoine Freuchet et al. Nat Immunol. 2023 Oct.

Abstract

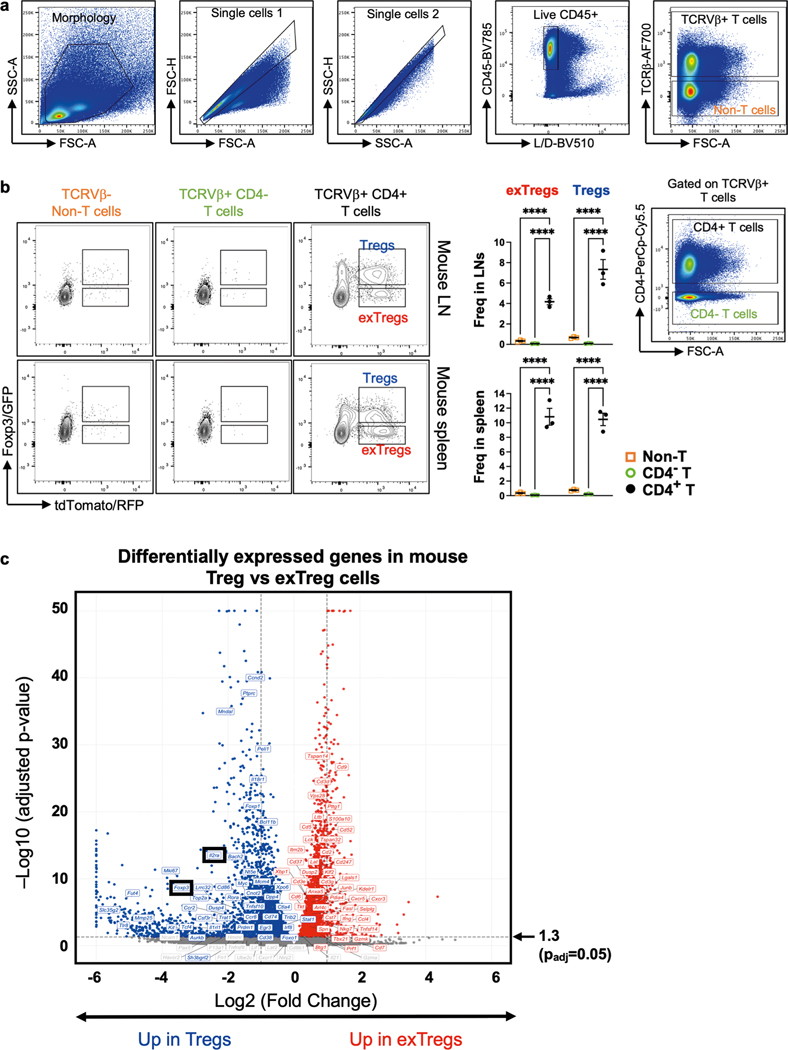
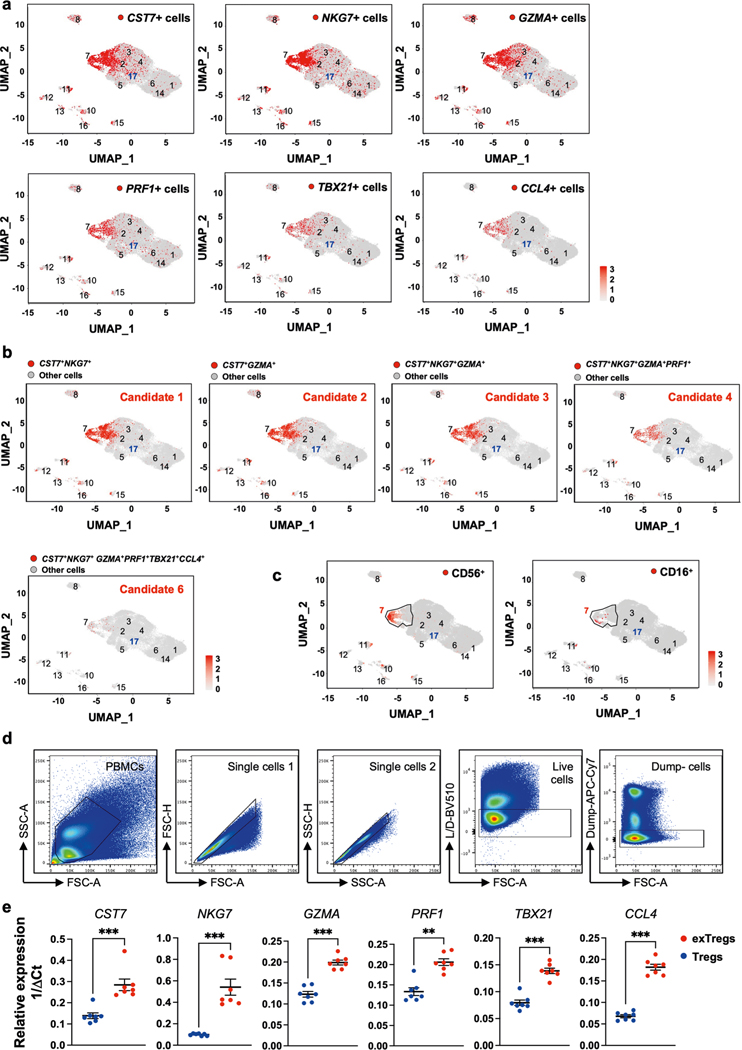
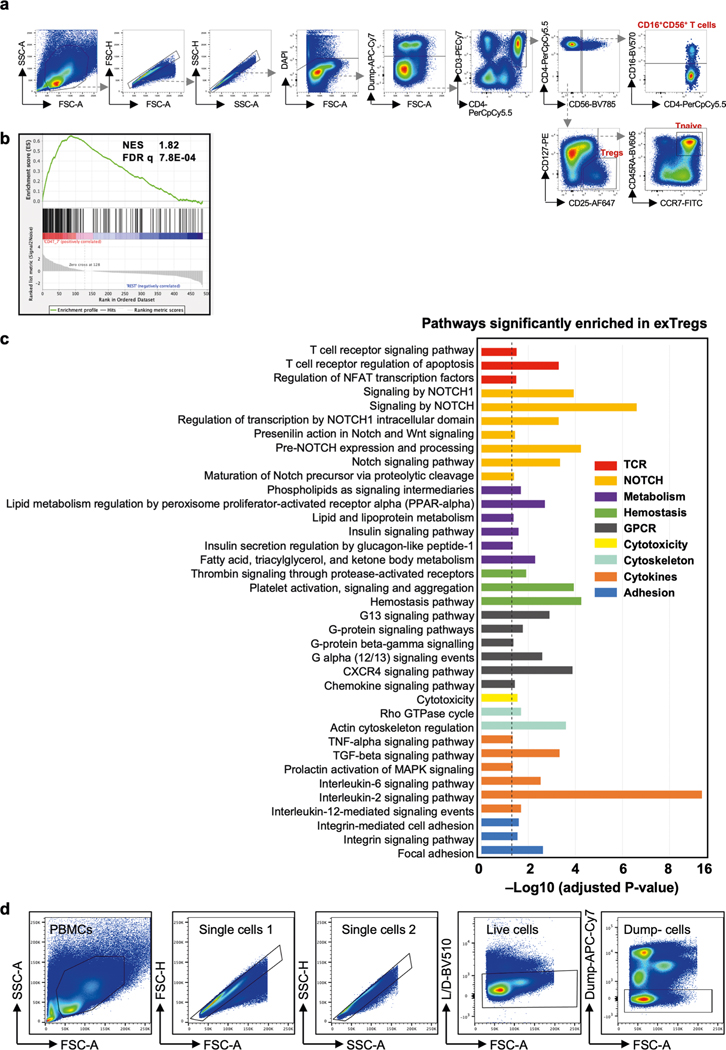
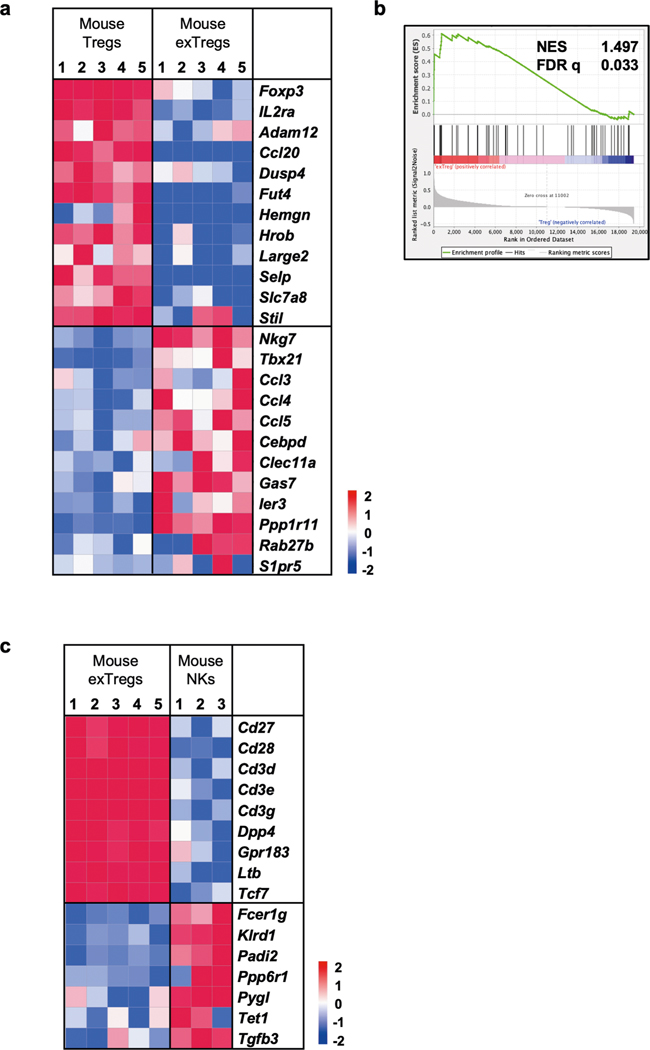
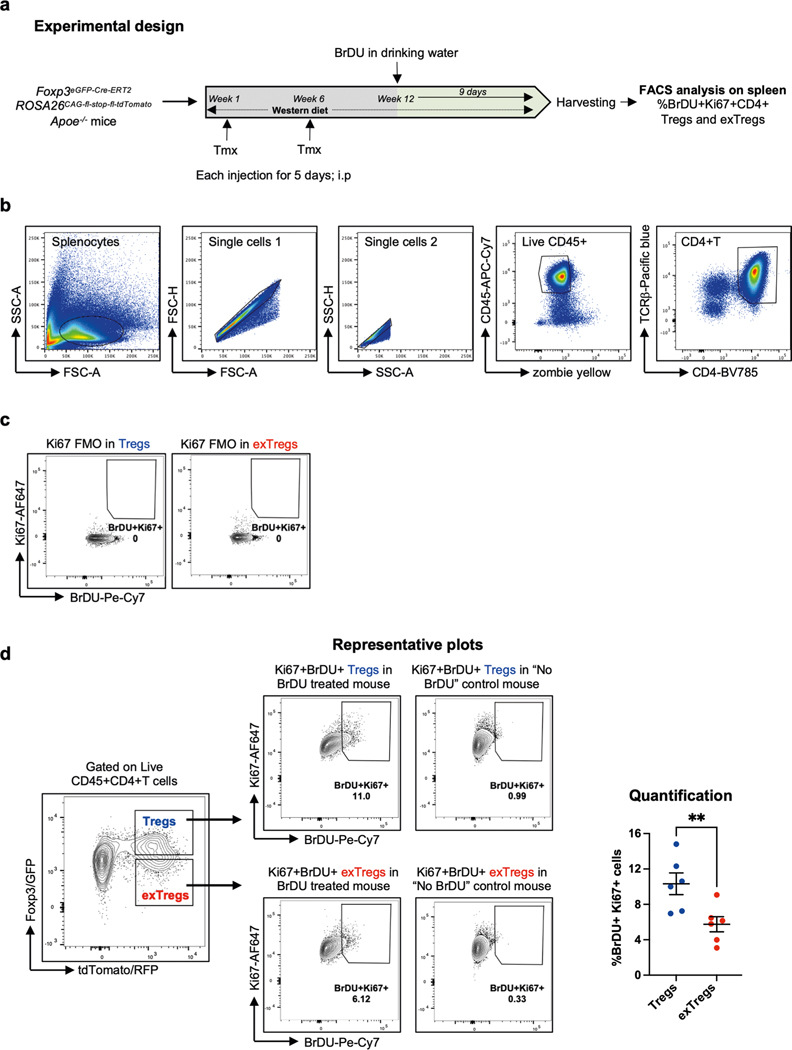
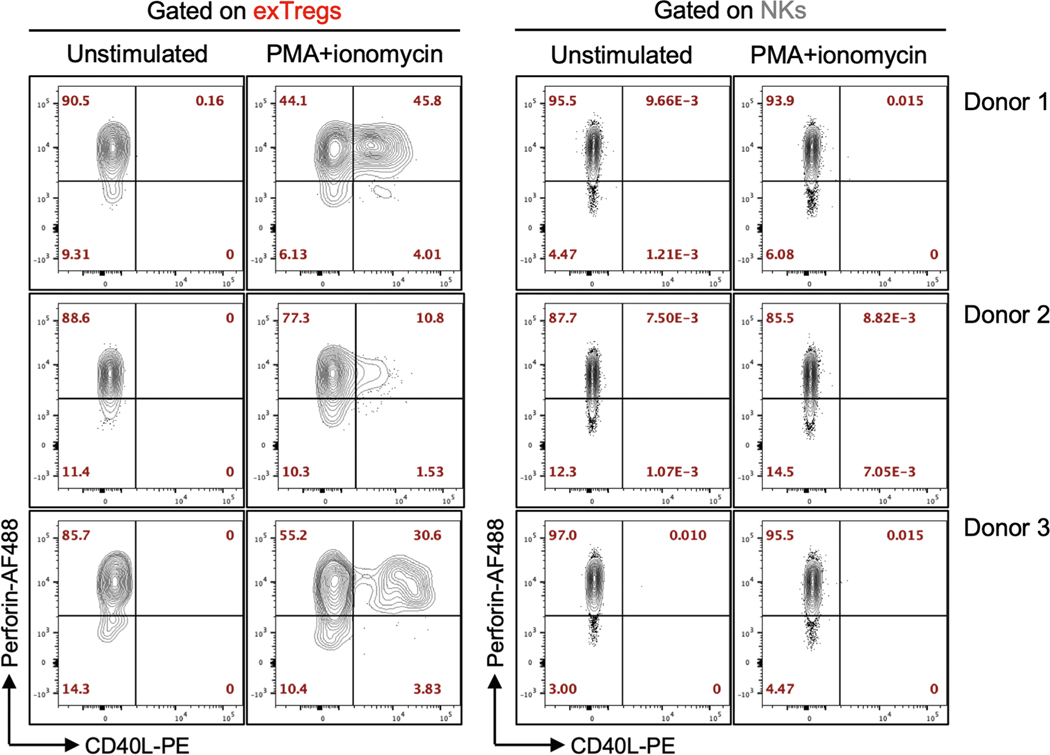
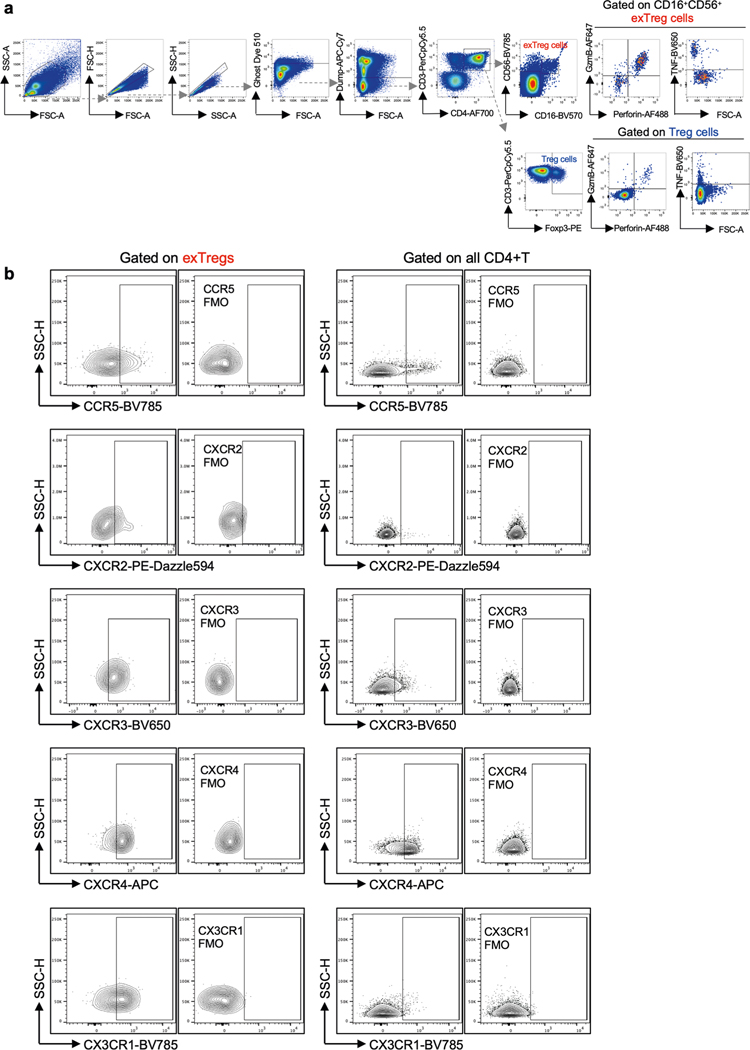
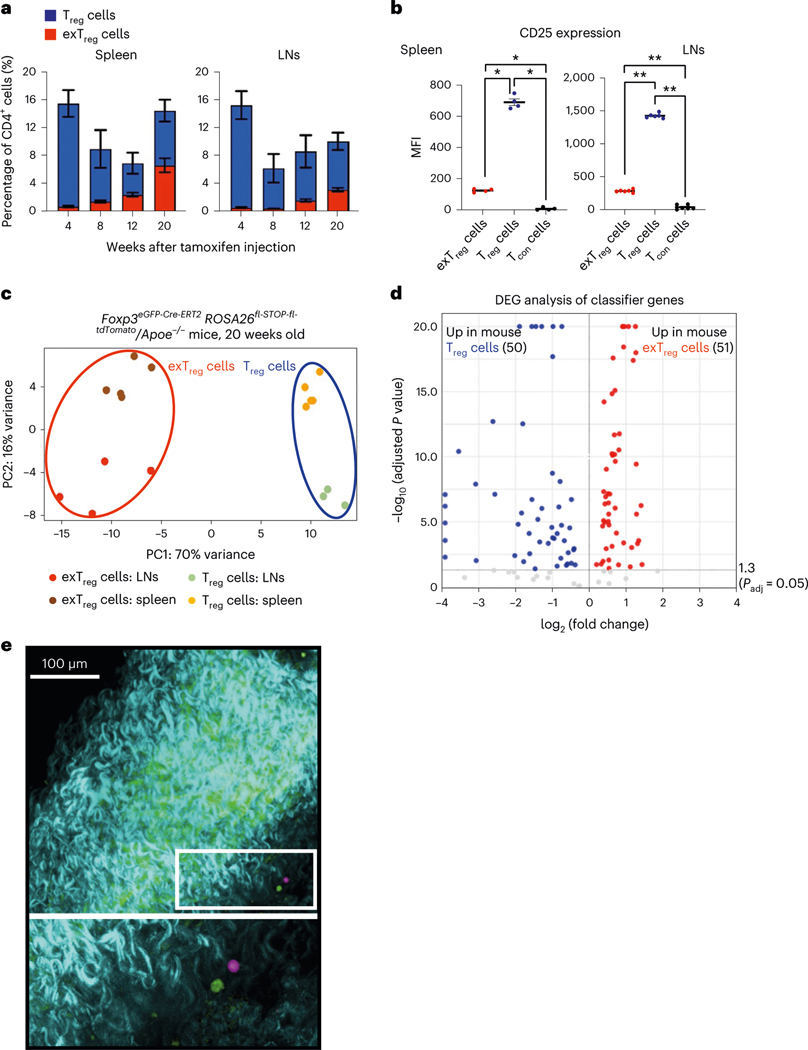
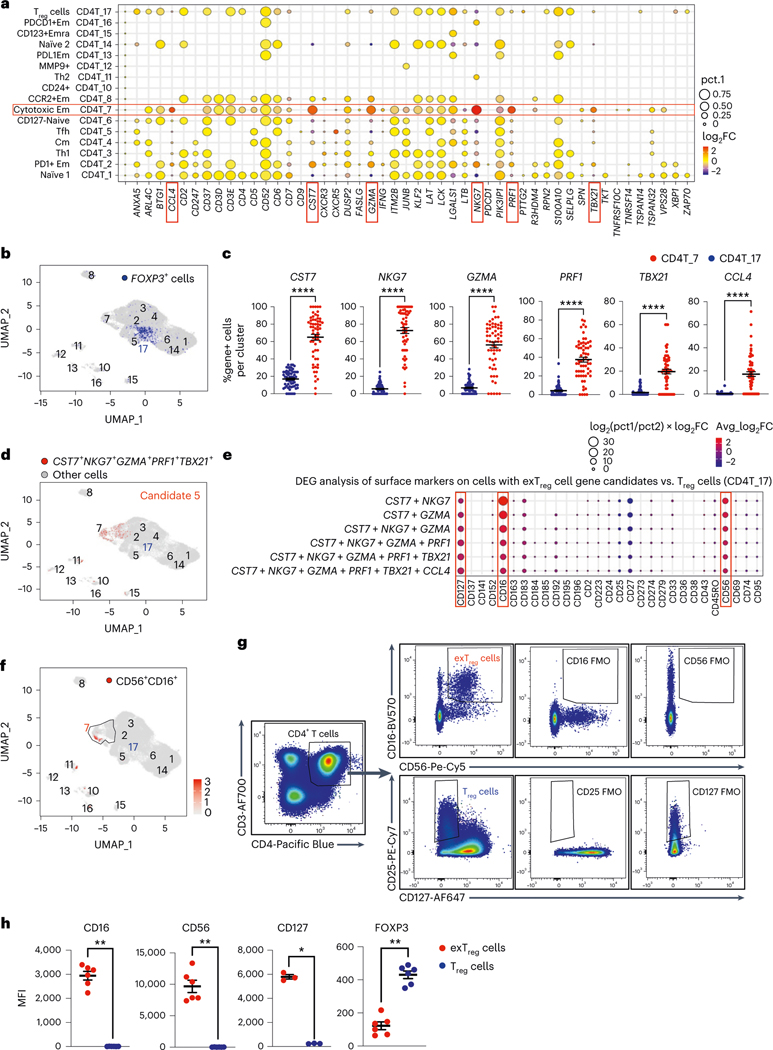
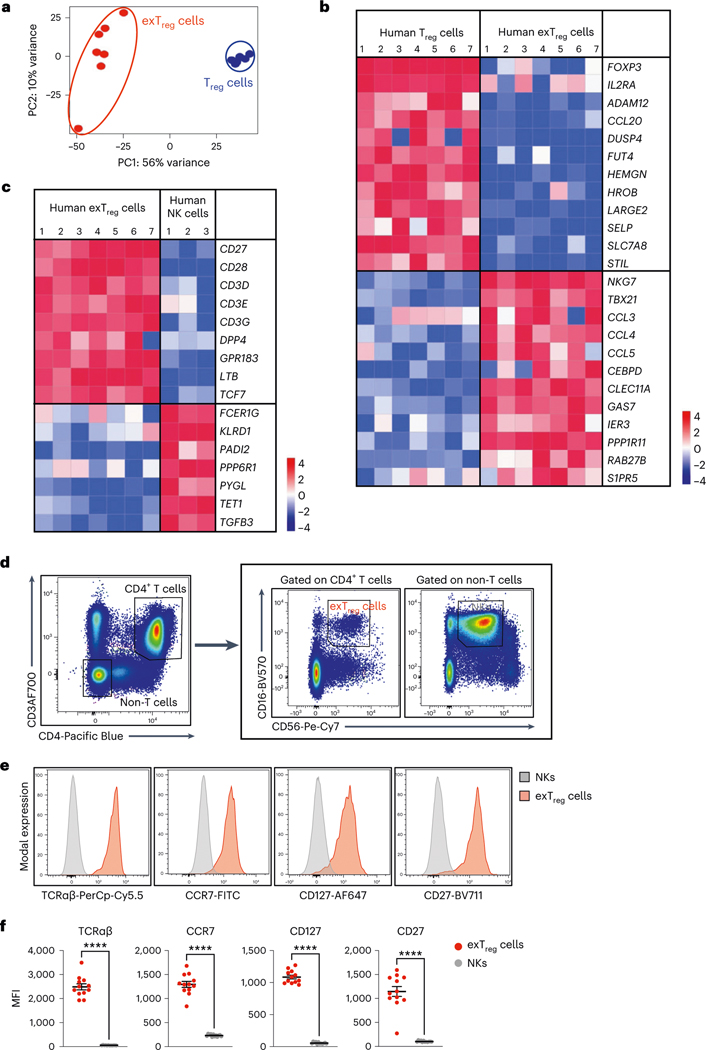
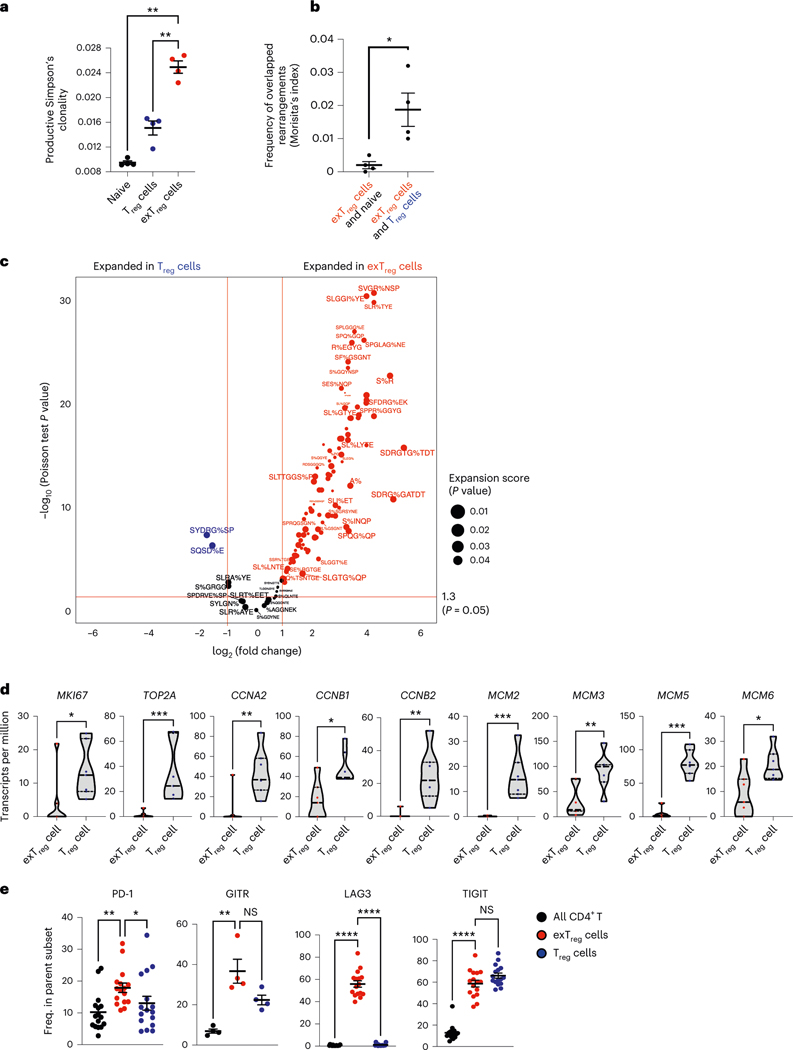
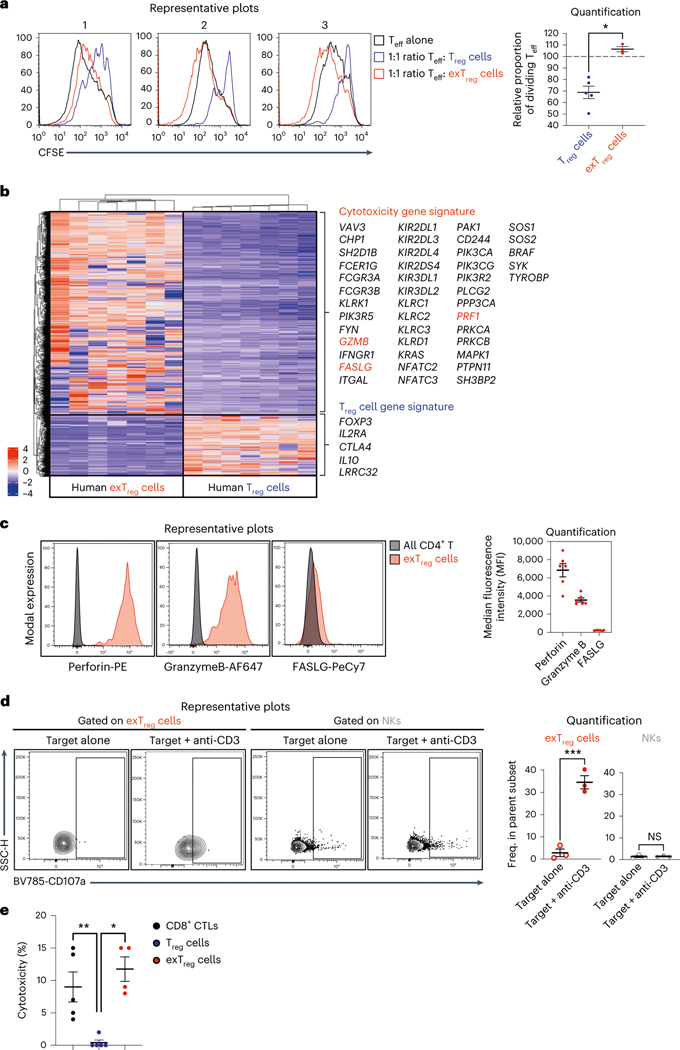
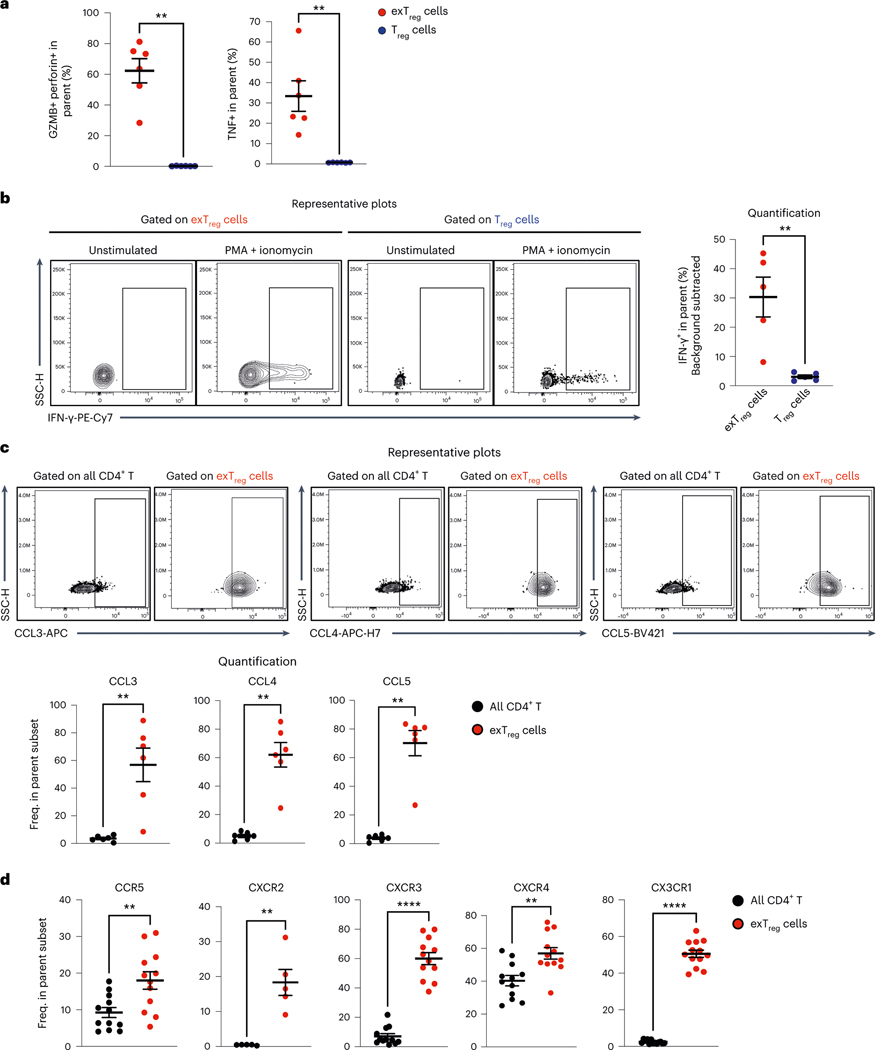
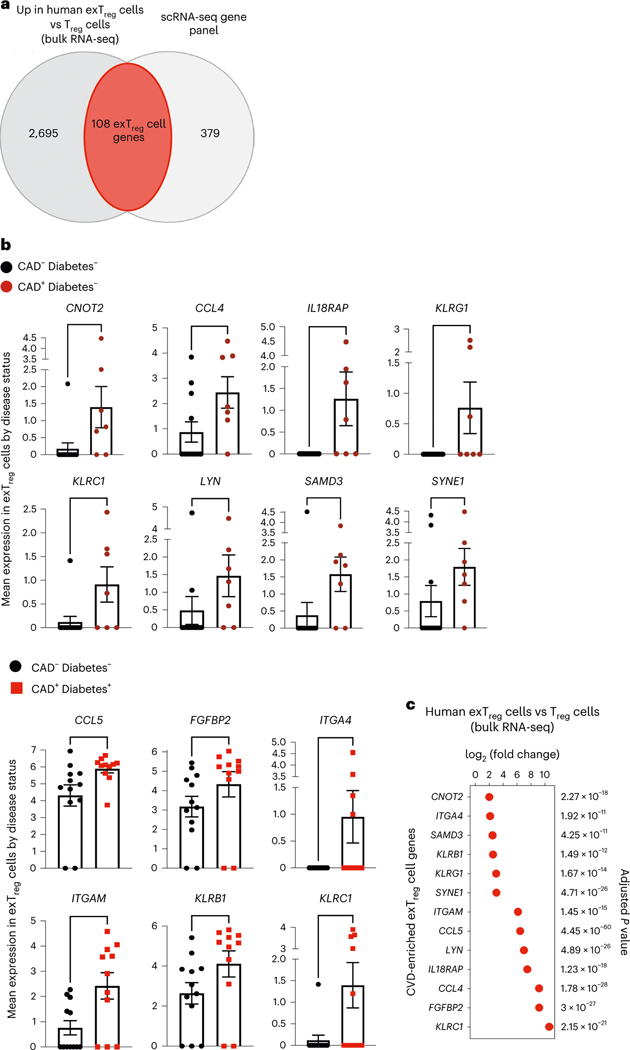
In atherosclerosis, some regulatory T (Treg) cells become exTreg cells. We crossed inducible Treg and exTreg cell lineage-tracker mice (FoxP3eGFP-Cre-ERT2ROSA26CAG-fl-stop-fl-tdTomato) to atherosclerosis-prone Apoe-/- mice, sorted Treg cells and exTreg cells and determined their transcriptomes by bulk RNA sequencing (RNA-seq). Genes that were differentially expressed between mouse Treg cells and exTreg cells and filtered for their presence in a human single-cell RNA-sequencing (scRNA-seq) panel identified exTreg cell signature genes as CST7, NKG7, GZMA, PRF1, TBX21 and CCL4. Projecting these genes onto the human scRNA-seq with CITE-seq data identified human exTreg cells as CD3+CD4+CD16+CD56+, which was validated by flow cytometry. Bulk RNA-seq of sorted human exTreg cells identified them as inflammatory and cytotoxic CD4+T cells that were significantly distinct from both natural killer and Treg cells. DNA sequencing for T cell receptor-β showed clonal expansion of Treg cell CDR3 sequences in exTreg cells. Cytotoxicity was functionally demonstrated in cell killing and CD107a degranulation assays, which identifies human exTreg cells as cytotoxic CD4+T cells.


Conflict of interest statement

Competing interests

The authors declare no competing interests.

Figures

Extended Data Fig. 1 |
Extended Data Fig. 1 |. Experimental controls for lineage-tracker atherosclerotic mouse model and differentially expressed genes in mouse Treg cells vs exTregs.
(a,b) Eight week-old female Foxp3eGFP-Cre-ERT2 ROSA26fl-STOP-fl-tdTomato Apoe−/− mice were injected with Tamoxifen twice for 5 days each, at week 1 and 6, then fed Western diet (WD) for 12 weeks. a) gating strategy, b) representative plots and quantification of exTreg and Treg cells among CD4+T cells (black circles) in lymph nodes (LNs) and spleen, harvested after 12 weeks of WD from 3 independent mice. Non-T cells (orange open squares) and CD4T cells (green open circles) are negative controls. Frequencies of exTregs and Treg cells among the parent subsets were plotted as mean ± SEM. Statistical comparisons were done using 2-way ANOVA with Dunnett’s multiple comparison test. **** p < 0.0001. c) Volcano plot representing significantly differentially expressed genes between mouse Treg cells and exTregs from 20-week old FoxP3eGFP-Cre-ERT2 ROSA26CAG-fl-stop-fl-tdTomato Apoe−/− mice (lymph nodes and spleen pooled). Left, up in Treg cells (blue). Right, up in exTregs (red). Horizontal dotted line is at -log10 (p adjusted) = 1.3 (padj = 0.05). The top 60 exTreg and 60 Treg classifying genes from the SVM model are annotated. Canonical Treg genes Il2ra and Foxp3 are shown in black boxes. Statistical analyses of DE genes using two-tailed Wald test with Benjamini-Hochberg correction for multiple comparisons.
Extended Data Fig. 2 |
Extended Data Fig. 2 |. Expression of exTreg candidate genes in scRNAseq data and validation by qRT-PCR from sorted human cells.
(a) Feature maps showing the gene expression of the single gene markers CST7, NKG7, GZMA, PRF1, TBX21 and CCL4 in the human single-cell dataset for all CD4 T cell clusters. (b) Combinations 1–4 and 6 of exTreg candidate genes are highlighted in red on UMAP embeddings of CD4 T clusters from the scRNA-Seq. (c) UMAP embeddings of CD4 T clusters. Black outline marks cluster CD4T_7; cells that express either CD56 (left) or CD16 (right) are shown as red dots. (d) Gating strategy to identify exTreg and Treg cells in human PBMCs. Dump channel: CD14, CD19. (e) Gene expression analysis of CST7, NKG7, GZMA, PRF1, TBX21 and CCL4 in sorted human Treg cells (blue circles) and exTregs (red circles) by qRT-PCR. Gene-specific Ct values were normalized (ΔCt) based on actin (ACTB). Relative expression was calculated by the 1/ΔCt method. n = 7. 33.33% male, 66.67% female donors; age: 21–54 yrs. Data shown as mean ± SEM. Each dot represents a biological replicate from an independent donor. Statistical comparisons by two-tailed Mann Whitney U test. **p = 0.0012,***p = 0.0006.
Extended Data Fig. 3 |
Extended Data Fig. 3 |. Human bulk RNAseq.
(a) Gating strategy used to sort human exTregs and Treg cells to perform bulk RNA-seq. (b) gene set enrichment analysis (GSEA) of bulk RNA-seq transcriptomes of sorted human exTreg cells against CD4T_7 (left) and all other clusters (right). Normalized enrichment score (NES) and FDR q values are indicated. (c) Significantly (adjusted p < 0.05) enriched pathways in human exTreg cells, based on genes expressed at significantly higher levels in human exTreg than in Treg cells. Analysis by Bioplanet2019 from the EnrichR suite. Dotted line indicates adjusted p = 0.05 (-log10 padj=1.3). Statistical comparisons with two-tailed Fisher’s exact test and Benjamini- Hochberg adjustment of p-values. (d) Gating strategy to identify exTregs and NK cells in human PBMCs. Dump channel: CD14, CD19.
Extended Data Fig. 4 |
Extended Data Fig. 4 |. Mouse bulk RNAseq.
(a) Comparative gene signature analysis between mouse exTregs and Treg cells. Genes were filtered for significant differential expression in mouse and human dataset. Gene expression shown here is from FoxP3eGFP-Cre-ERT2 ROSA26CAG-fl-stop-fl-tdTomato Apoe−/− mice. Low-expressed genes (<7 raw reads in all samples) in our dataset were filtered out. Technical replicates were averaged, biological replicates shown as columns. Analysis of differentially expressed (DE) genes was done using DESeq2. Curated list of significant DE (log2FC ± 1, adjusted p < 0.05) genes are shown on normalized heatmaps, scaled by row (z scores). (b) Gene set enrichment analysis (GSEA) of mouse exTreg genes from bulk RNA-seq transcriptomes against human exTreg (left) and Treg cells (right) from the human bulk RNA-seq data set. Mouse orthologs of human genes, filtered for those present in the human scRNA-Seq targeted gene panel, were used to calculate enrichment for mouse bulk RNA-seq dataset. (c) Comparative gene signature analysis between mouse exTreg and NK cells. An external dataset was used for mouse NK cells (3 samples): GSE122597, GSE116177, and GSE52043. EdgeR was used to normalize the counts by applying the trimmed mean of M-values (TMM) method and counts per million (CPM) conversion. All other data processing and filtering steps were same as in a. Curated list of significant DE (log2FC ± 1, adjusted p < 0.05) genes are shown on normalized heatmaps, scaled by row (z scores). Statistical analyses of DE genes (a,c) using two-tailed Wald test with Benjamini-Hochberg correction for p-value adjustment. All data from independent biological replicates.
Extended Data Fig. 5 |
Extended Data Fig. 5 |. Assessment of proliferation in mouse Treg cells and exTregs.
(a) Eight week-old female Foxp3eGFP-Cre-ERT2 ROSA26fl-STOP-fl-tdTomato Apoe−/− mice were injected with Tamoxifen twice for 5 days each, at week 1 and 6, then fed Western diet (WD) for 12 weeks. BrDU (0.8 mg/mL) was incorporated in the drinking water for the last 9 days of WD (n = 6). (b) Gating scheme for CD4+T cells. (c) Ki67 FMO control. (d) Representative plots and quantification of proliferating Treg cells (blue circles, %Ki67+BrDU+CD4+Foxp3+RFP+) and exTregs (red circles, %Ki67+BrDU+CD4+Foxp3RFP+) in the spleen (n = 6), as identified by anti-BrDU and anti-Ki-67 Abs. Data shown as mean ± SEM. Each animal is an independent biological replicate. Gates were set by FMO for Ki67 and by no BrdU controls for BrdU. Background from “No BrDU” control was subtracted for normalization. The percentage of proliferating cells was compared by two-tailed Mann-Whitney U test, **p = 0.0087.
Extended Data Fig. 6 |
Extended Data Fig. 6 |. Treg marker expression on human exTregs.
Representative contour FACS plots showing the expressions of PD-1, GITR, LAG3 and TIGIT in exTreg cells (left). Corresponding FMO controls were used to set the gates. Right, contour plots showing the expression of these markers in all CD4+T cells and in Treg cells from the same donor.
Extended Data Fig. 7 |
Extended Data Fig. 7 |. Cytotoxic and T cell activation marker expression on stimulated human exTreg vs NK cells.
Contour plots show intracellular expression of CD40L (X-axis) and Perforin (Y-axis) in exTregs and NK cells from unstimulated and PMA+ionomycin stimulated PBMCs. Data from three independent donors. 33.33% male, 66.67% female donors, age: 25–43 yrs.
Extended Data Fig. 8 |
Extended Data Fig. 8 |. Gating strategy and representative plots.
(a) Gating strategy used to analyze granzyme B, perforin and TNF in Treg cells and exTregs. (b) Contour plots show surface expression of chemokine receptors CCR5, CXCR2, CXCR3, CXCR4 and CX3CR1 on exTreg cells (left) and their corresponding expression in all CD4+T cells (right). Individual FMO controls were used to set the gate for expression of each receptor.
Fig. 1 |
Fig. 1 |. Deep transcriptomes from mouse exTreg cells and Treg cells identify differentially expressed candidate genes.
a, Frequency of mouse exTreg cells (red) and Treg cells (blue) among all CD4+T cells in spleen and LNs of FoxP3eGFP-Cre-ERT2ROSA26CAG-fl-stop-fl-tdTomato Apoe−/− mice at 4 (Treg n = 7; exTreg n = 5), 8 (Treg n = 4; exTreg n = 4), 12 (Treg n = 5; exTreg n = 5) and 20 (Treg n = 6; exTreg n = 5) weeks after tamoxifen injection. All mice were on regular CD. b, Median fluorescence intensity (MFI) of CD25 expression on exTreg cells (red circles), Treg cells (blue circles) and conventional CD4+T cells (Tcon, black circles) in spleen (n = 4) and LNs (n = 6) from 16-week-old FoxP3eGFP-Cre-ERT2ROSA26CAG-fl-stop-fl-tdTomato Apoe−/− mice on CD. Results (a and b) are represented as the mean ± s.e.m. Spleen (b) *P = 0.0286; LN (b) **P = 0.0022; two-tailed Mann–Whitney U test. c, PCA of bulk RNA-seq data from sorted mouse exTreg cells and Treg cells from spleen and LNs of 20-week-old FoxP3eGFP-Cre-ERT2ROSA26CAG-fl-stop-fl-tdTomato Apoe−/− mice on CD. Results (ac) are from independent biological replicates. d, Volcano plot of differentially expressed mouse exTreg and Treg cell-classifying genes, identified by the SVM trained on mouse transcripts with human orthologs and filtered for those present in the human scRNA-seq targeted gene panel. y and x axes capped at 20 (P = 10−20) and ±4 (log2FC), respectively. Horizontal line at −log10 (P adjusted) = 1.3 (same as Padj = 0.05). Statistical analyses were performed using a two-tailed Wald test with Benjamini–Hochberg P-value adjustment. e, Mouse aortas with carotid artery branches from FoxP3eGFP-Cre-ERT2ROSA26CAG-fl-stop-fl-tdTomato Apoe−/− mice were fixed and imaged using a Leica SP8 multiphoton microscope. GFP+ Treg cells (pseudocolored green) and tdTomato+ exTreg cells (pseudocolored pink) in the adventitia (top). Bottom image is a zoomed-in view of the white box. Blue-green indicates a second harmonic generation microscopy analysis of extracellular matrix. Scale bar, 100 μm. Data are representative of four independent experiments.
Fig. 2 |
Fig. 2 |. Mouse exTreg cell classifier genes identify human exTreg cell candidate genes and surface markers in a human scRNA-seq and CITE-seq dataset of CD4+T cells.
a, Differentially expressed mouse exTreg classifier genes were examined among all CD4+ T cell clusters from a published single-cell human dataset from 61 men and women (aged 40–80 years). Statistical significance for the enrichment of each gene in one cluster versus all others was assessed. Average log2 fold change (log2FC, dot color) and positive cell proportions (pct.1, dot size) for significantly (P < 0.05) enriched genes are shown. Six highly expressed exTreg genes (CST7, NKG7, GZMA, PRF1, TBX21 and CCL4) enriched in human cluster CD4T_7 (red boxes). b, Feature plot showing expression of FOXP3 gene (blue dots) in the human CD4+ T single-cell dataset. Treg cell cluster CD4T_17, previously identified as Treg cells, highlighted. c, Frequencies of cells that expressed each of the exTreg cell signature genes in CD4T_7 (red circles) and CD4T_17 (Treg cells, blue circles). n = 61. d, Cells expressing optimal exTreg cell candidate gene combination (CST7 + NKG7 + GZMA + PRF1 + TBX21) are highlighted in red on UMAP embeddings of CD4+ T clusters from the scRNA-seq data. All other cells are in gray. e, Differentially expressed surface markers (CITE-seq antibodies) on cells expressing candidate gene combinations. Average log2FC (dot color) and log2(pct.1/pct.2) × avg_log2FC (dot size) for significant (P < 0.05) differentially expressed protein markers on candidate cells versus CD4T_17 (Treg cells) are shown. Enriched exTreg markers CD127, CD16 and CD56 are marked with red boxes. The second-to-last combination is candidate 5 (CST7 + NKG7 + GZMA + PRF1 + TBX21). f, UMAP embeddings of CD4+ T clusters. Black outline marks cluster CD4T_7; cells that coexpressed CD16 and CD56 are shown as red dots. g, Representative plots from flow cytometry (FACS) showing CD16+CD56+CD4+T cells (exTreg cells, red) and CD25+CD127loCD4+T cells (Treg cells, blue) with FMO controls. h, MFI of CD16 (n = 6), CD56 (n = 6), CD127 (n = 3) and FOXP3 (n = 6) expression in exTreg cells (red circles) and Treg cells (blue circles). 20% male, 80% female donors; ages 23–64 years. Results (c and h) are represented as the mean ± s.e.m. Each dot (c and h) represents a biological replicate from an independent human donor. Statistical comparisons using a two-tailed Mann–Whitney U test (c and h) and a two-tailed Wilcoxon’s rank-sum test with Benjamini–Hochberg correction for multiple comparisons (a and e). In c, ****P < 0.000000000000001 for CST7, NKG7, GZMA, PRF1 and ****P = 3.86 × 10⁻¹³ for TBX21. In h, *P = 0.0121, **P = 0.0022.
Fig. 3 |
Fig. 3 |. Deep transcriptomes from sorted human CD3+CD4+CD16+CD56+ exTreg cells contrasted with Treg cells and NK cells.
a, PCA plot of bulk RNA-seq data from sorted human exTreg (CD3+CD4+CD16+CD56+) and Treg (CD3+CD4+CD25+CD127lo) cells. n = 7. Donor details for human bulk RNA-seq in Supplementary Table 13. b,c, Comparative gene signature analysis between human exTreg cells and Treg cells (b) or NK (c) cells. Genes were filtered for significant differential expression, consistent in both mouse and human datasets (only human shown here). An external dataset was used for human NK cells: GSE133383 (samples GSM3907331, GSM3907341 and GSM3907351). Lowly expressed genes (<7 raw reads in all samples) in our dataset were filtered out. EdgeR was used to normalize the counts by applying the trimmed mean of M-values method and counts-per-million conversion. Analysis of DEGs was done using DESeq2. Curated lists of significant DEGs (log2FC ± 1, adjusted P < 0.05) genes are shown on normalized heat maps, scaled by row (z scores). d, Representative FACS plots showing exTreg cells as CD3+CD4+CD16+CD56+ T cells and NK cells as CD3CD4CD16+CD56+ non-T cells in hPBMCs. e, Histograms showing the fluorescence intensities of conjugated antibodies against TCRαβ, CCR7, CD127 and CD27 on NK cells (gray) and exTreg cells (red). The scaled y axis was normalized to mode. f, MFI values of the specified markers (n = 12 for each) in NK cells (gray circles) and exTreg cells (red circles) were plotted as the mean ± s.e.m. 40% male and 60% female donors, aged 20–69 years. Each dot represents a biological replicate from an independent human donor. Statistical comparisons were done using a two-tailed Wald test with Benjamini–Hochberg correction for multiple testing (b and c) and a two-tailed Mann–Whitney U test (f). ****P = 7.396 × 10⁻⁷ in f.
Fig. 4 |
Fig. 4 |. Oligoclonal human exTreg cells are clonally expanded from proliferating Treg cells.
a, Productive Simpson’s clonality of TCRβ sequences from sorted naïve T cells (black circles), Treg cells (blue circles) and exTreg cells (red circles). n = 4. Donor details for human TCR-seq in Supplementary Table 13. b, Frequency of rearrangements shared between exTreg cells and naïve or between exTreg cells and Treg cells was measured using Morisita’s index. n = 4. Results (a and b) are represented as the mean ± s.e.m. c, GLIPH2-analyzed conserved amino acid motifs in TCRβ sequences. Groups with exTreg TCRs were filtered for statistically significant expansion score (P < 0.05). 178 of 345 expanded exTreg GLIPH2 groups were shared by Treg cells. Relative abundance of Treg and exTreg TCRs in these 178 Treg/exTreg groups was compared and DEG patterns (log2FC ± 1, two-sided Poisson test P < 0.05) are shown as a volcano plot. Horizontal line at −log10 (P value) = 1.3 (same as P = 0.05). Vertical lines at |log2FC| = 1. d, Violin plots showing normalized expression levels (transcripts per million) of proliferation genes MKI67, TOP2A, CCNA2, CCNB1, CCNB2, MCM2, MCM3, MCM5 and MCM6 in human bulk transcriptomes from sorted human Treg cells (blue dots) and exTreg cells (red dots). n = 7. 33.33% male and 66.67% female donors, aged 21–54 years. e, Frequency of PD-1 (n = 16), GITR (n = 4), LAG3 (n = 16) and TIGIT (n = 16) expressing cells by FACS, percentage of parent (all CD4+T cells (black circles), exTreg cells (red circles), Treg cells (blue circles); mean ± s.e.m.). 50% male and 50% female donors, aged 20–69 years. Each dot represents a biological replicate from an independent donor. Statistical comparisons were done using one-way analysis of variance (ANOVA) with Dunnett’s multiple-comparison test (a), a two-tailed Mann–Whitney U test (b and d) and a Kruskal–Wallis test, adjusted with Dunn’s multiple-comparison testing (e). In a, exTreg cells versus naive **P = 0.0012; versus Treg cells **P = 0.0068. In b, *P = 0.0286. In d, *P = 0.0111 for MKI67, CCNB1; *P = 0.0175 for MCM6; **P = 0.007 for CCNA2 and MCM3; **P = 0.0012 for CCNB2; ***P = 0.0006 for TOP2A, MCM2, MCM5. In e, PD-1 **P = 0.0023, GITR **P = 0.0047, LAG3 ****P = 3.21 × 10⁻⁷, TIGIT ****P = 5.227 × 10⁻⁵ for exTreg cells versus CD4+T cells; PD-1 *P = 0.0329, GITR P = 0.3396, LAG3 ****P = 1.659 × 10⁻⁵, TIGIT P = 0.423 for exTreg cells versus Treg cells. NS, not significant.
Fig. 5 |
Fig. 5 |. Human exTreg cells are not suppressive but are cytotoxic.
a, CFSE-labeled CD3+CD4+CD25T cells (Teff) were co-cultured at 1:1 ratio with either CTV-labeled Treg cells or exTreg cells, in the presence of anti-CD3/CD28/CD2-coated beads. Left, representative histograms from three independent experiments showing CFSE in Teff cells alone (black line), in Teff cells cultured with Treg cells (blue line) and in Teff cells cultured with exTreg cells (red line). Right, proportion of dividing Teff cells after 5 d of co-culture with Treg cells (blue circles, n = 5) or ex Treg cells (red circles, n = 3). 40% male and 60% female donors; aged 23–43 years. b, Heat map of DEGs (P < 0.01 and |log2FC| > 2, based on a two-tailed Wald test with Benjamini–Hochberg P-value adjustment) between human exTreg versus Treg transcriptomes from Fig. 3. Cytotoxic and Treg signature genes are highlighted. c, FACS analysis of cytotoxic proteins FASLG, perforin and granzyme B (genes are labeled red in b) in human exTreg cells, compared to bulk CD4+T cells. Left, representative histograms of intensities of fluorochrome-conjugated antibodies against FASLG, perforin and granzyme B on exTreg cells (red) and all CD4+T cells (black). Right, MFIs of marker protein expression in exTreg cells. n = 6. 50% male and 50% female donors, aged 25–37 years. d, Representative contour plots (left) and quantification (right) of basal and anti-CD3-induced degranulation in exTreg cells (red) and NK cells (gray), as measured by surface mobilization of the degranulation marker CD107a by FACS. hPBMCs were co-cultured with uncoated P815 cells (target alone, open circles) or 5 μg ml−1 anti-CD3-coated P815 cells (target + anti-CD3, filled circles) for 6 h at a 10:1 PBMC:P815 ratio. n = 3. 33.33% male and 66.67% female donors; aged 25–38 years. e, Anti-CD3-loaded P815 cells were co-cultured with CD8 CTLs (black circles, n = 5), Treg cells (blue circles, n = 5) or exTreg cells (red circles, n = 4) at a 1:5 P815:effector cells ratio for 16 h. 60% male and 40% female donors, aged 21–45 years. Cytotoxicity was assessed by measuring lactate dehydrogenase amounts in the supernatant. Results (a and ce) are represented as the mean ± s.e.m. Each dot represents a biological replicate from an independent donor. Statistical comparisons were done using a two-tailed Mann–Whitney U test (a and e) and a two-tailed unpaired t-test (d). *P = 0.0357 (a). ***P = 0.0008 (d, exTreg cells); P = 0.7707 (d; NKs). **P = 0.0079 (e, Treg cells versus CTLs); *P = 0.0159 (e; Treg cells versus exTreg cells).
Fig. 6 |
Fig. 6 |. Human exTreg cells express cytotoxic proteins, inflammatory cytokines, chemokines and chemokine receptors.
a, Frequencies of GzmB+perforin+ and TNF+ cells in Treg cells (blue circles) and exTreg cells (red circles) were assessed in an ICS assay by FACS. n = 6. 50% male and 50% female donors; aged 24–39 years. b, Representative contour plots (left) showing intracellular expression of IFN-γ under unstimulated and PMA–ionomycin-stimulated conditions in exTreg cells and Treg cells. Right, frequency of PMA-induced IFN-γ in exTreg cells (red circles) and Treg cells (blue circles). n = 5. 40% male and 60% female donors; aged 23–39 years. c, hPBMCs were stained for intracellular expression of CCL3 (MIP-1α), CCL4 (MIP-1β) and CCL5 (RANTES). Top, representative contour FACS plots showing expression among all CD4+T cells and in exTreg cells. Bottom, frequencies of CCL3+, CCL4+ and CCL5+ cells among the parent subset (all CD4+T cells (black circles), exTreg cells (red circles)). n = 6. 50% male and 50% female donors, aged 26–33 years. d, Frequencies of CCR5 (n = 12), CXCR2 (n = 5), CXCR3 (n = 12), CXCR4 (n = 12) and CX3CR1 (n = 13) chemokine receptor-expressing exTreg cells (red circles) and all CD4+T cells (black circles). 40% male and 60% female donors, aged 20–69 years. Results (ad) were plotted as the mean ± s.e.m. Each dot represents a biological replicate from an independent donor. Statistical comparisons were performed using a two-tailed Mann–Whitney U test (ad). **P = 0.0022 (a), **P = 0.0079 (b), **P = 0.0022 (c). In d, **P = 0.0068 (CCR5), **P = 0.0079 (CXCR2), ****P = 7.396 × 10⁻⁷ (CXCR3), **P = 0.0023 (CXCR4), ****P = 1.92 × 10⁻⁷ (CX3CR1).
Fig. 7 |
Fig. 7 |. Inflammatory and cytotoxic human exTreg genes overexpressed in individuals with coronary artery disease.
a, Genes that were significantly upregulated in human exTreg cells compared to Treg cells (2,803 genes) in the human bulk RNA-seq data (Fig. 3) were intersected with the genes present in the published human scRNA-seq panel (Fig. 2). Donor details for human bulk RNA-seq are in Supplementary Table 13 and those for scRNA-seq are in ref. . b, Mean expression of genes in CD16+CD56+ exTreg cells from the scRNA-seq dataset that were significantly increased in CAD+ non-diabetic (brown circles in top, n = 7) or diabetic (red squares in bottom, n = 11) individuals in comparison to control CAD non-diabetic (black circles, n = 12) individuals. Results are shown as the mean ± s.e.m. Each point represents data from exTreg cells from an independent donor. Statistical comparisons were done using a two-tailed Mann–Whitney U test. Top, **P = 0.0064 (CNOT2), *P = 0.0414 (CCL4), **P = 0.009 (IL18RAP), *P = 0.0361 (KLRG1), *P = 0.0163 (KLRC1), *P = 0.0371 (LYN), **P = 0.0095 (SAMD3), *P = 0.0395 (SYNE1). Bottom, *P = 0.0126 (CCL5), *P = 0.0354 (FGFBP2), *P = 0.0373 (ITGA4), *P = 0.018 (ITGAM), *P = 0.031 (KLRB1), *P = 0.032 (KLRC1). c, log2FC and adjusted P values of a DEG analysis (based on a two-tailed Wald test with Benjamini–Hochberg P-value adjustment) between exTreg cells and Treg cells for the 13 CAD-relevant exTreg genes from b.

References

    1. Tse K. et al. Atheroprotective vaccination with MHC-II restricted peptides from ApoB-100. Front. Immunol 4, 493 (2013). - PMC - PubMed
    1. Kimura T. et al. Atheroprotective vaccination with MHC-II-restricted ApoB peptides induces peritoneal IL-10-producing CD4 T cells. Am. J. Physiol 312, H781–H790 (2017). - PMC - PubMed
    1. Kimura T. et al. Regulatory CD4+ T cells recognize major histocompatibility complex class II molecule-restricted peptide epitopes of apolipoprotein B. Circulation 138, 1130–1143 (2018). - PMC - PubMed
    1. Wolf D. et al. Pathogenic autoimmunity in atherosclerosis evolves from initially protective apolipoprotein B 100 –reactive CD4+ T-regulatory cells. Circulation 142, 1279–1293 (2020). - PMC - PubMed
    1. Marchini T, Hansen S. & Wolf D. ApoB-specific CD4+ T cells in mouse and human atherosclerosis. Cells 10, 446 (2021). - PMC - PubMed

Publication types