. 2023 Sep;24(9):1443-1457.
doi: 10.1038/s41590-023-01579-x. Epub 2023 Aug 10.

Fibrosis induced by resident macrophages has divergent roles in pancreas inflammatory injury and PDAC

Affiliations

Fibrosis induced by resident macrophages has divergent roles in pancreas inflammatory injury and PDAC

John M Baer et al. Nat Immunol. 2023 Sep.

Abstract

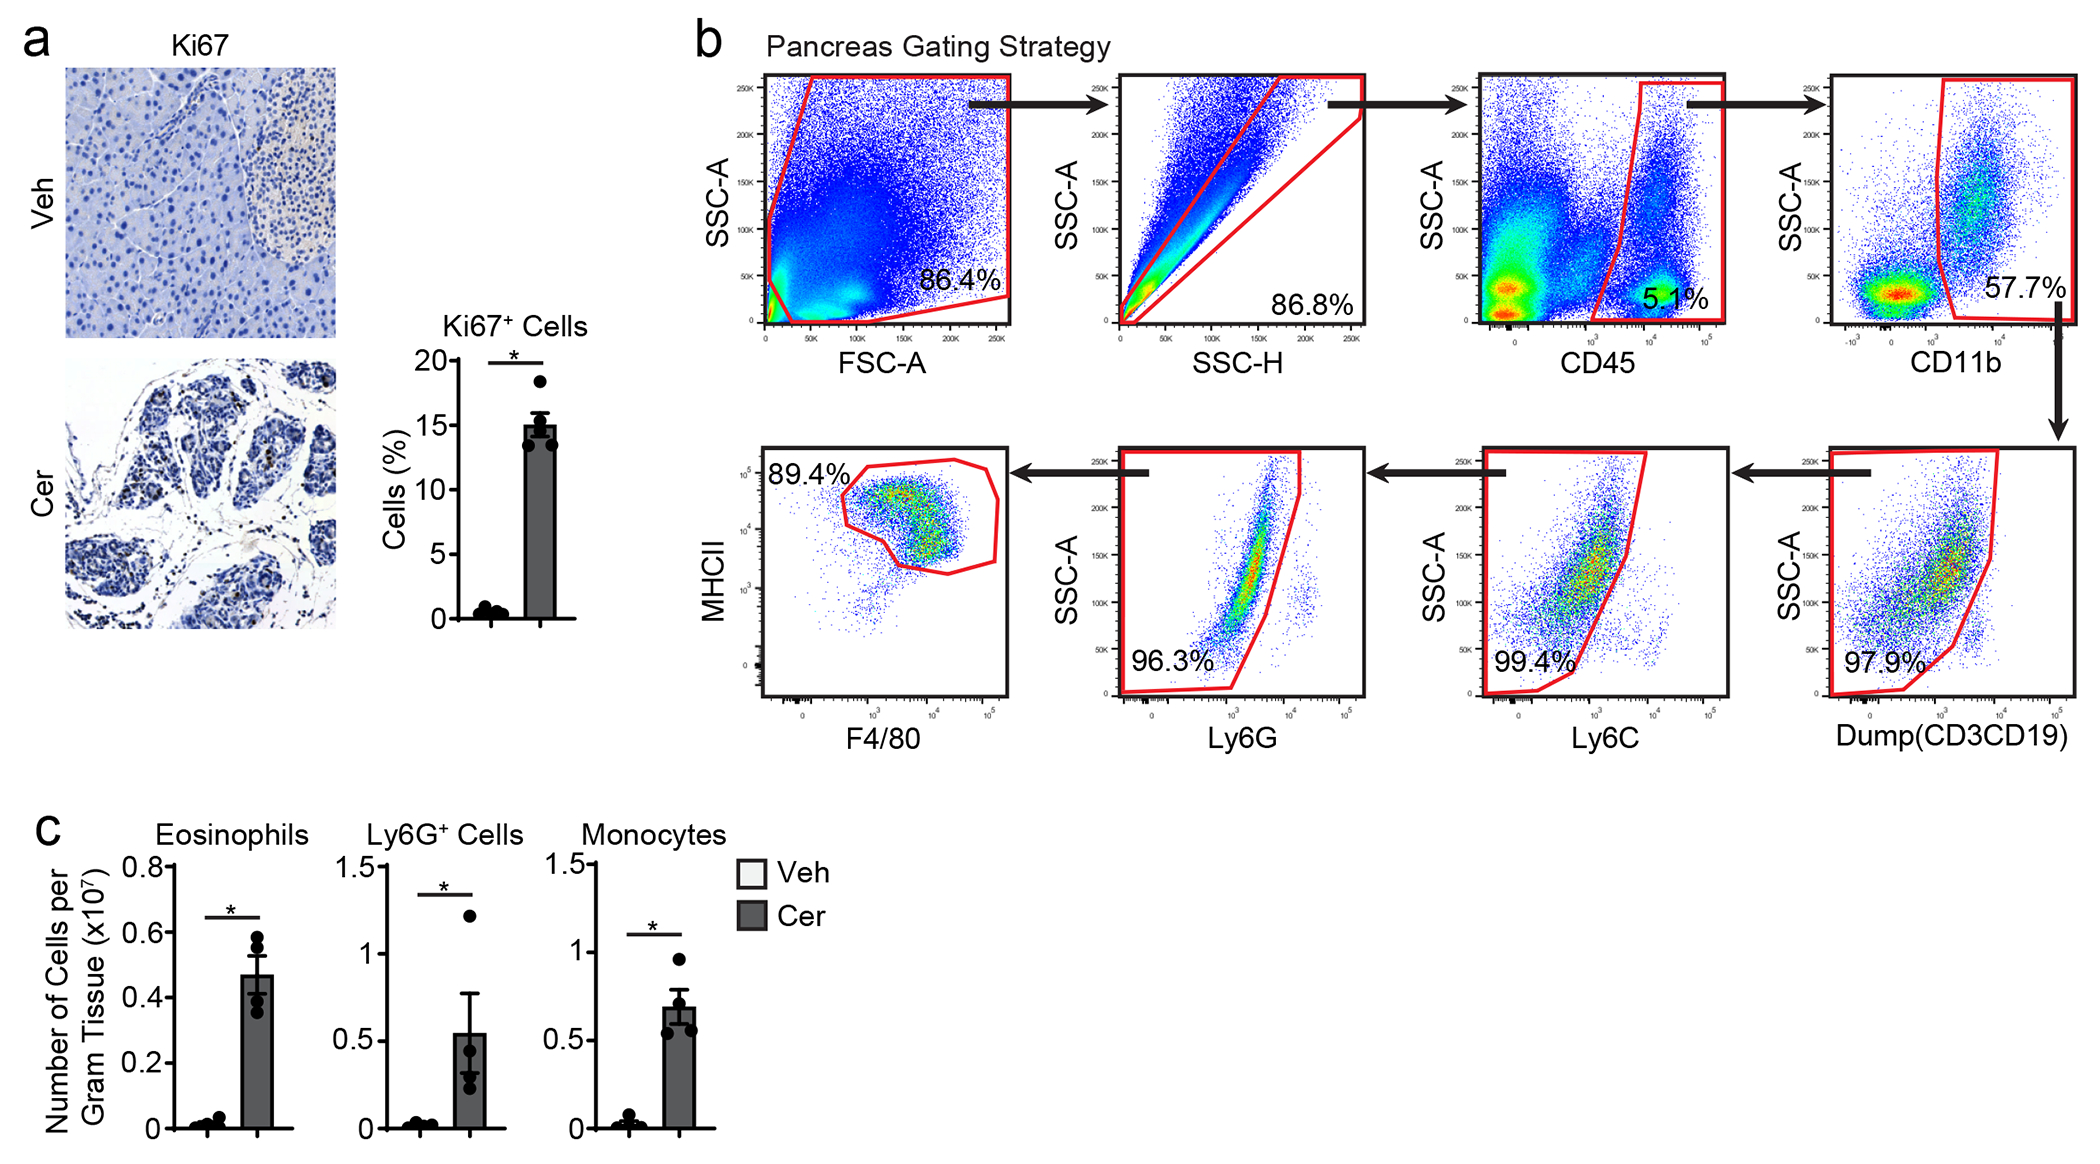
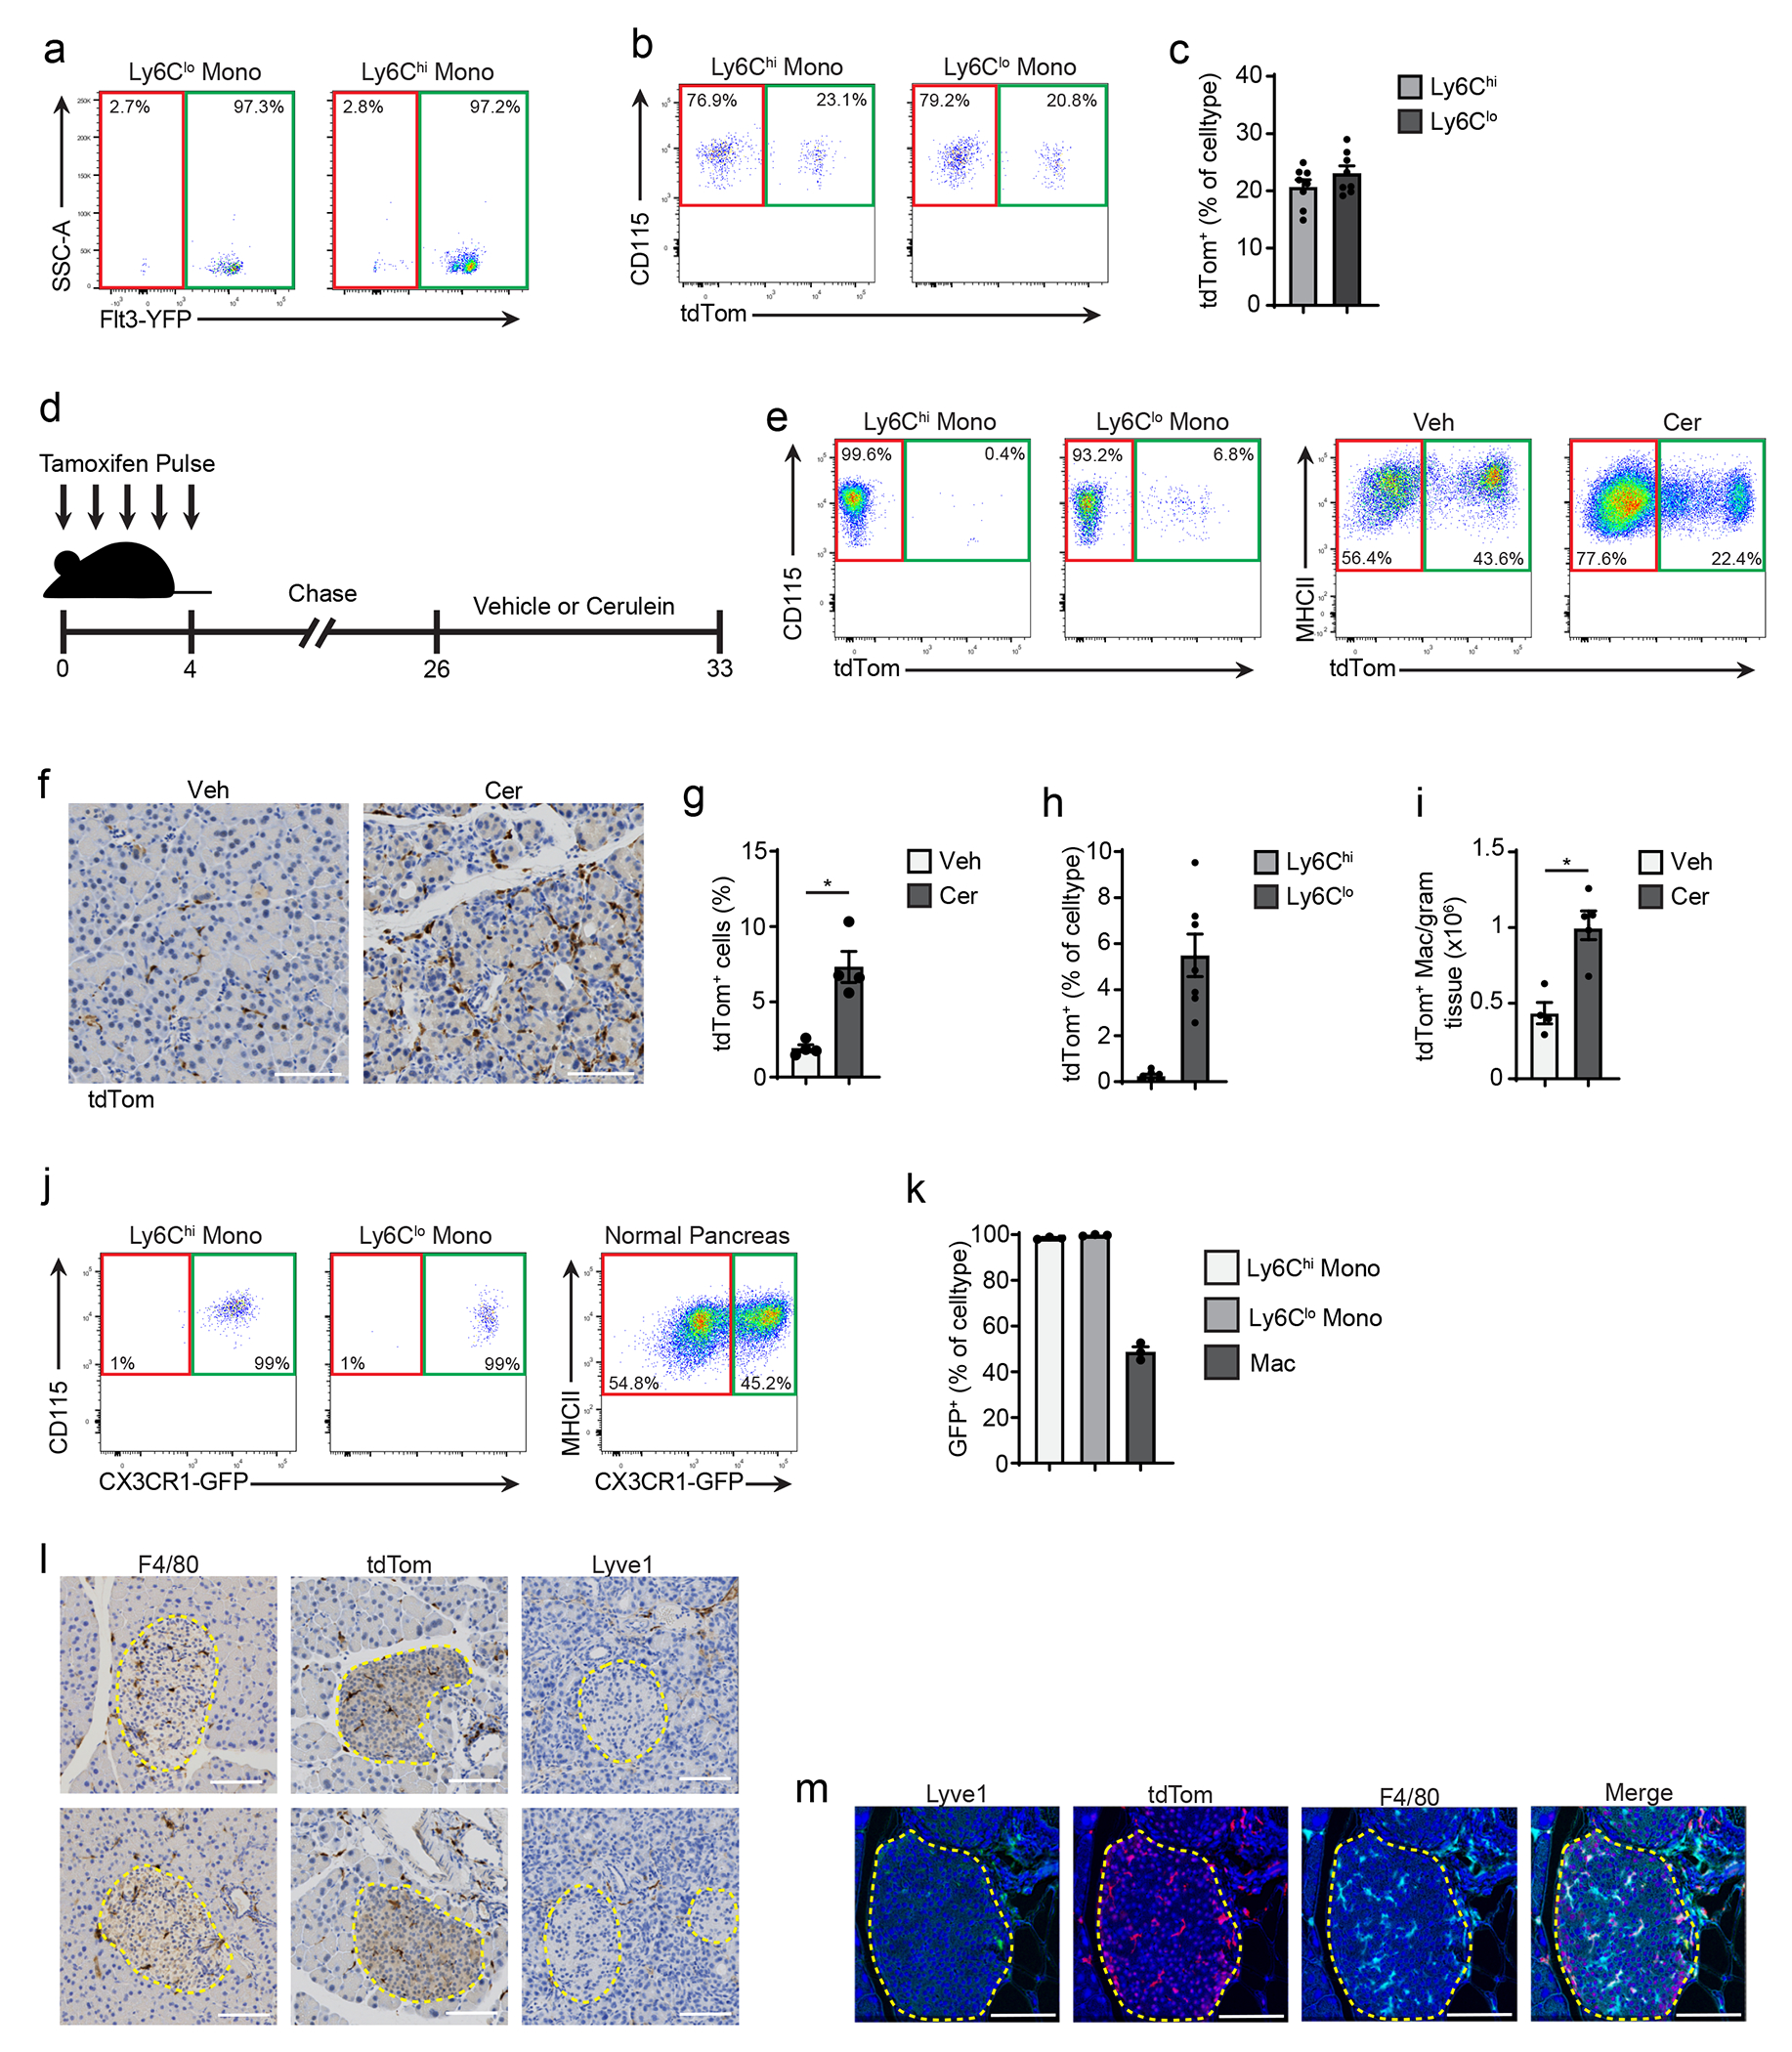
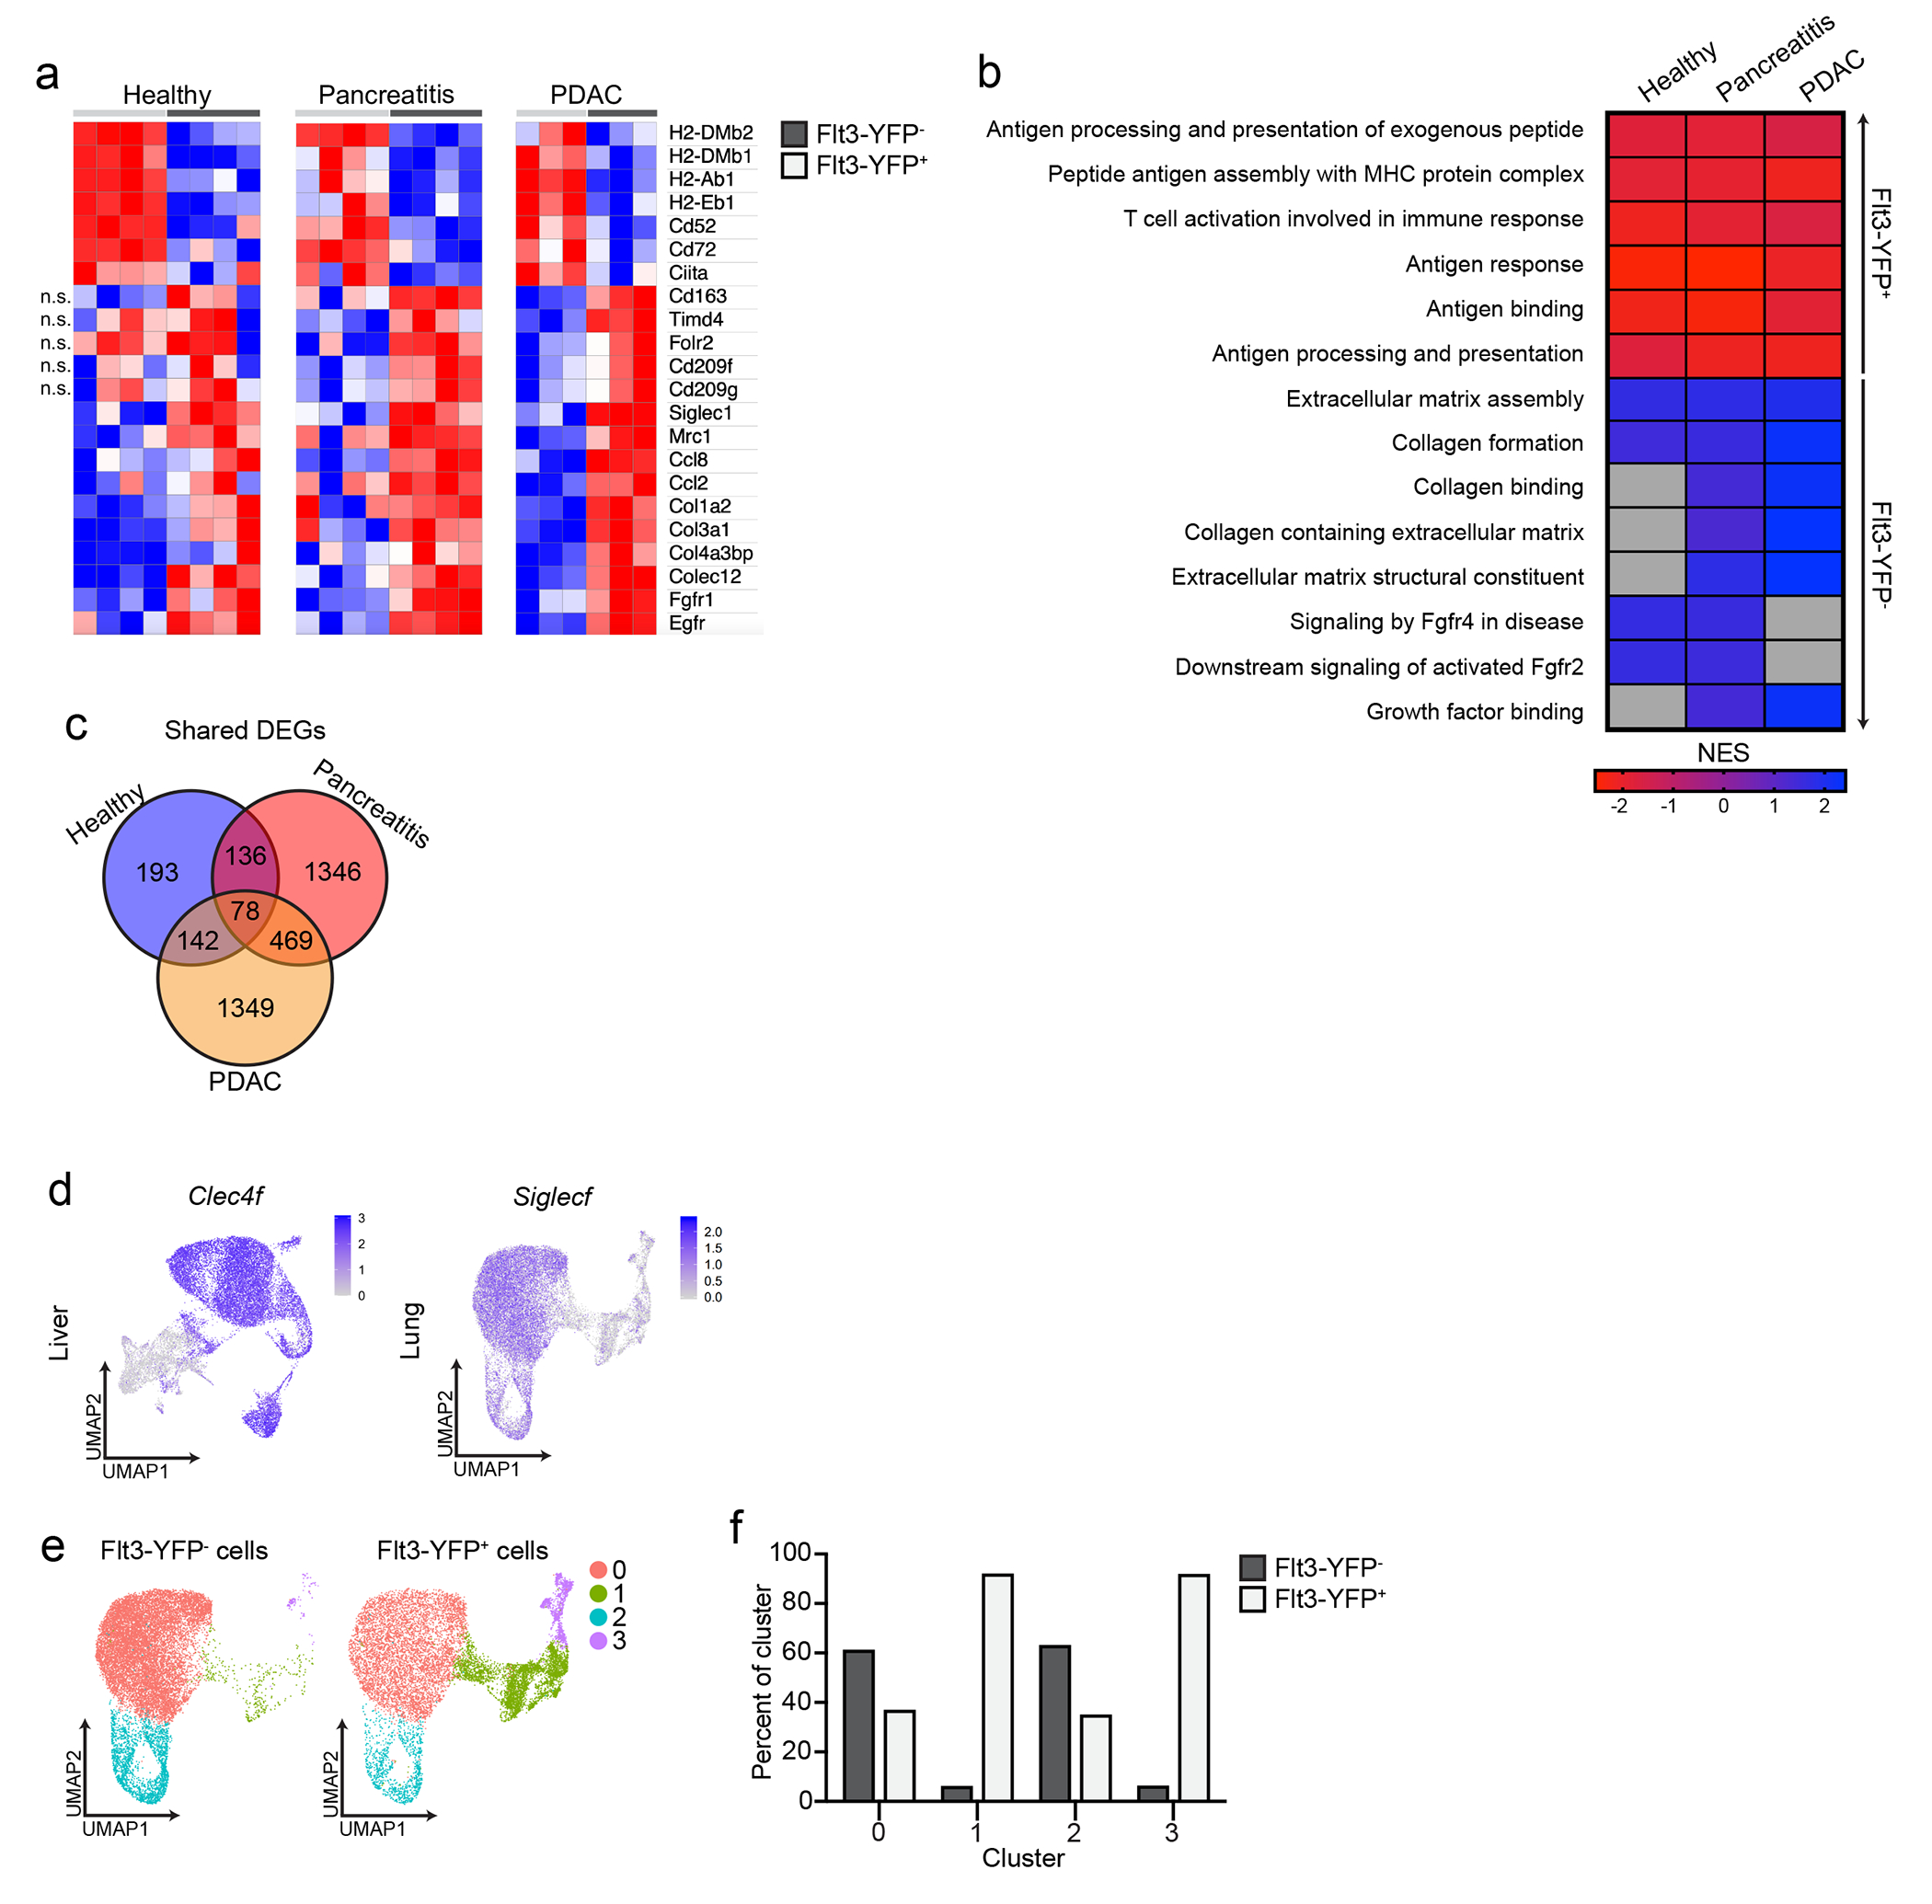
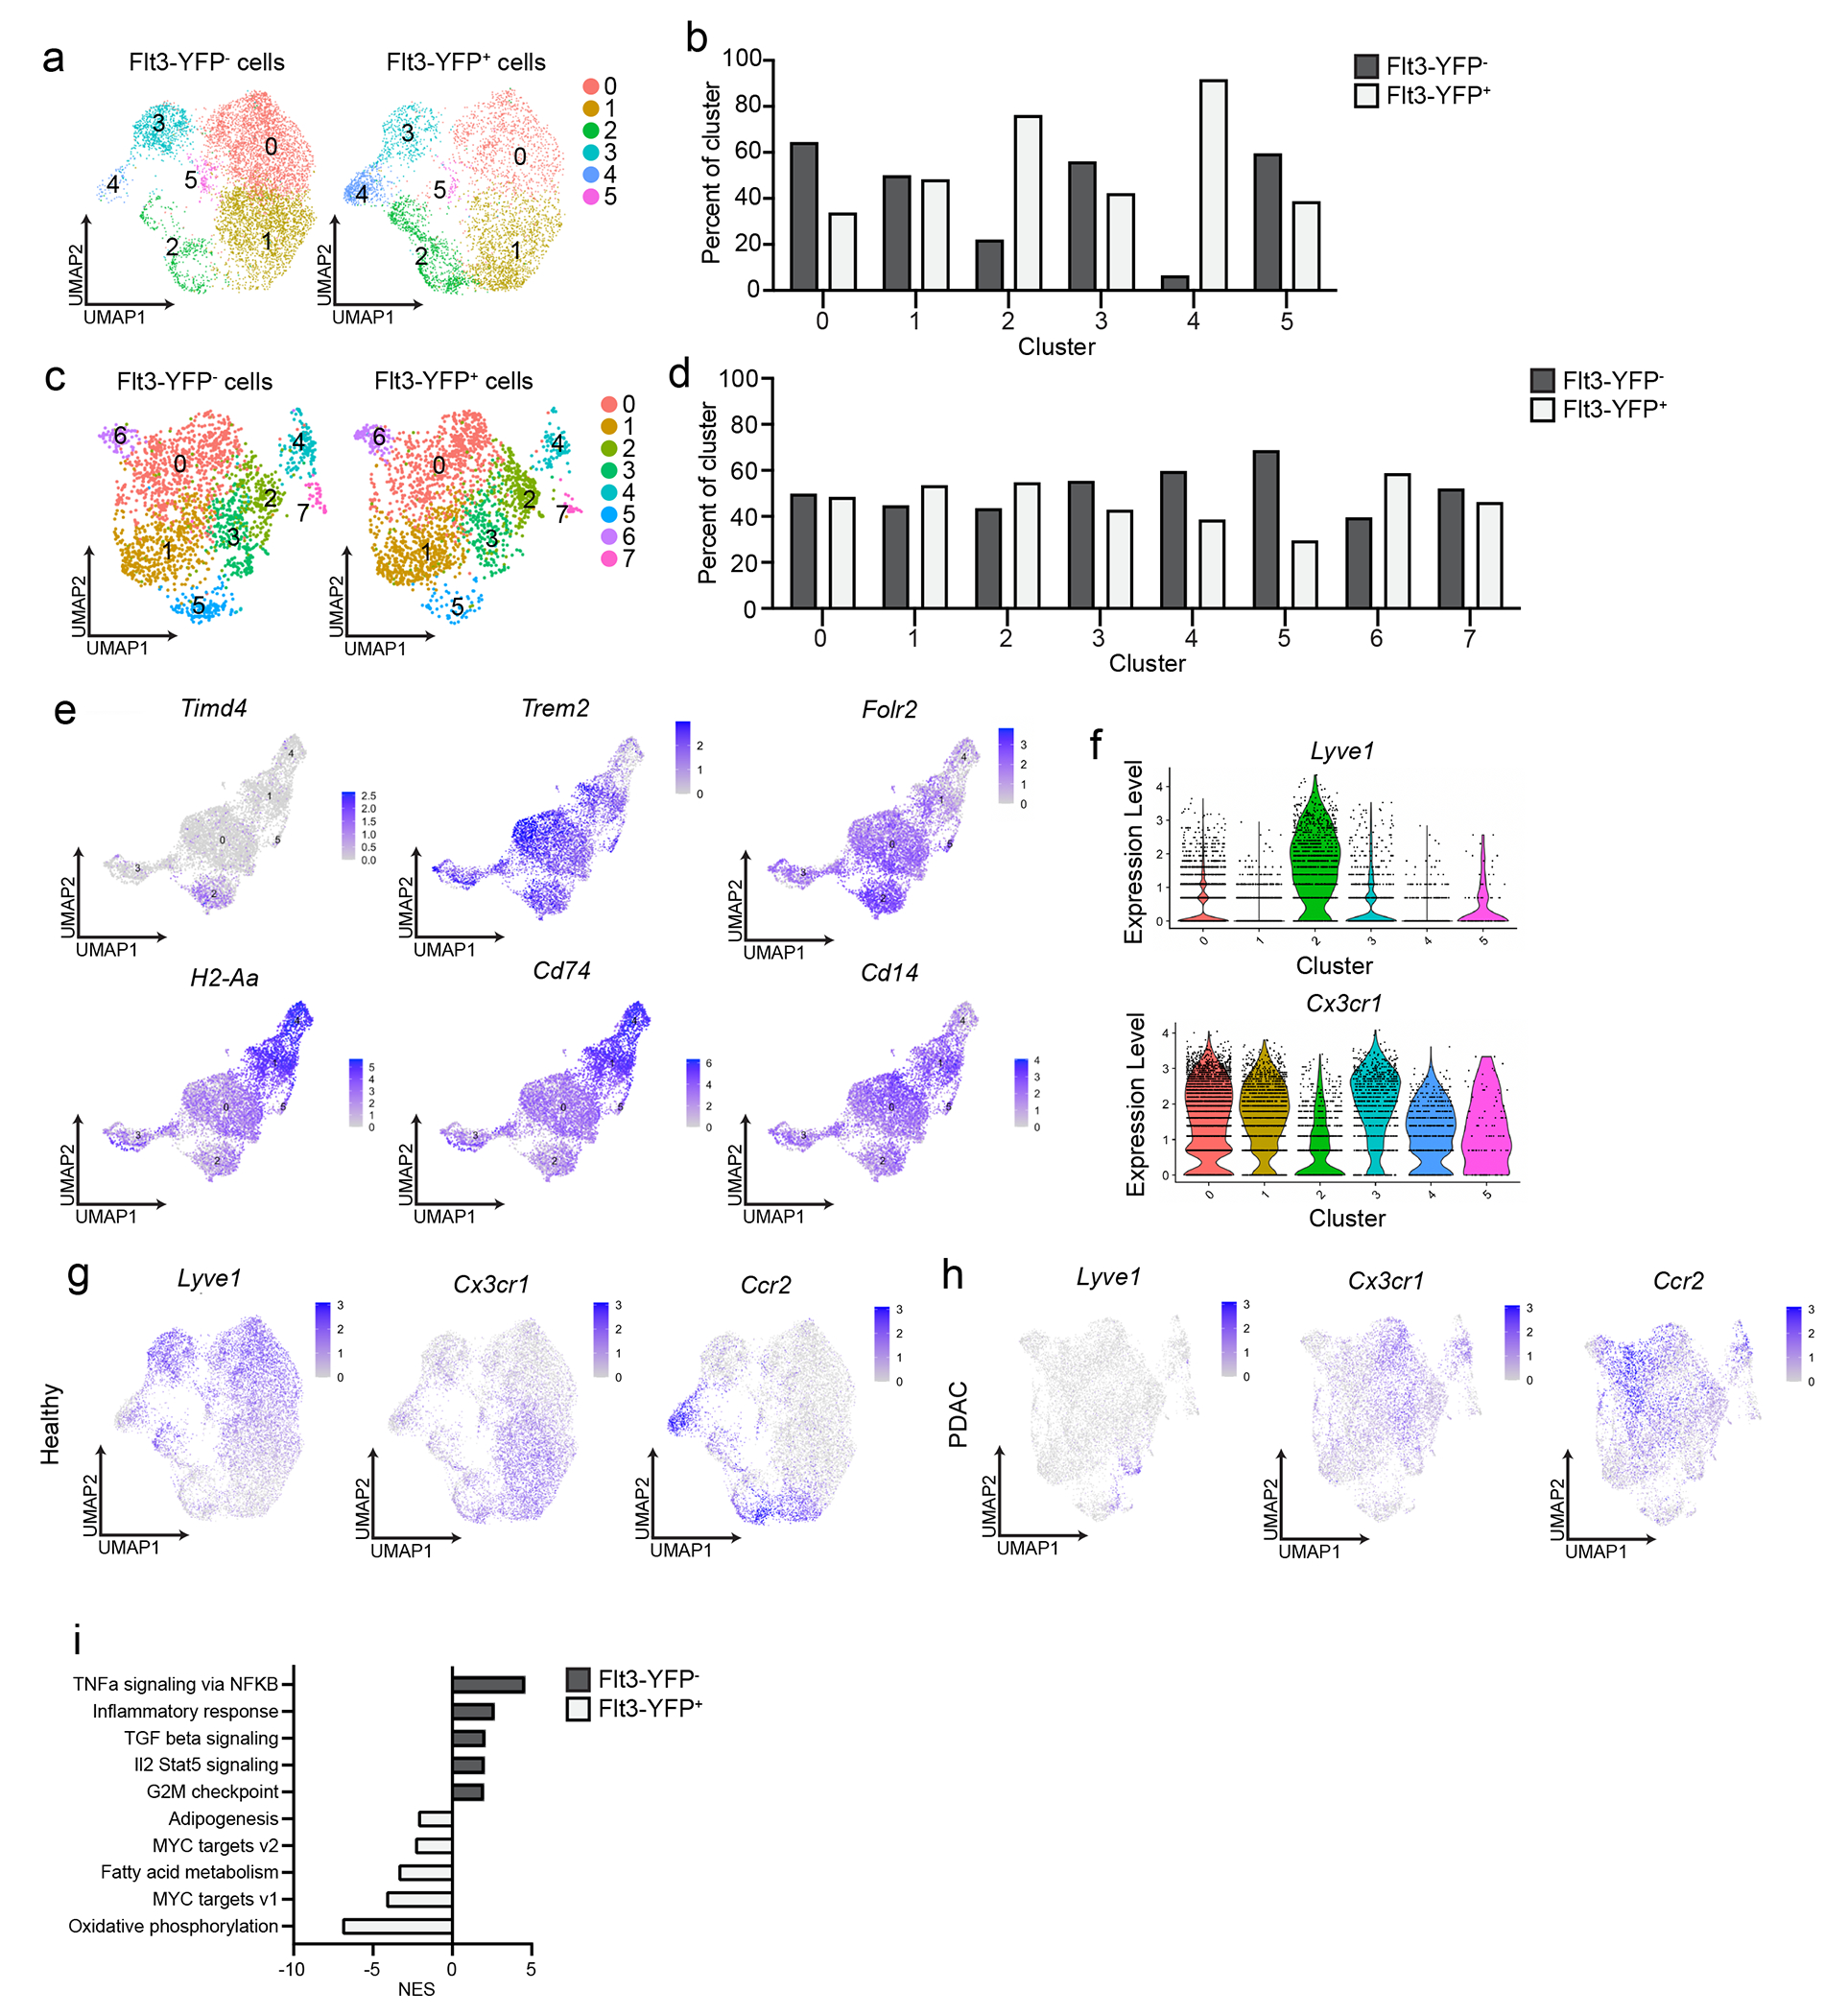
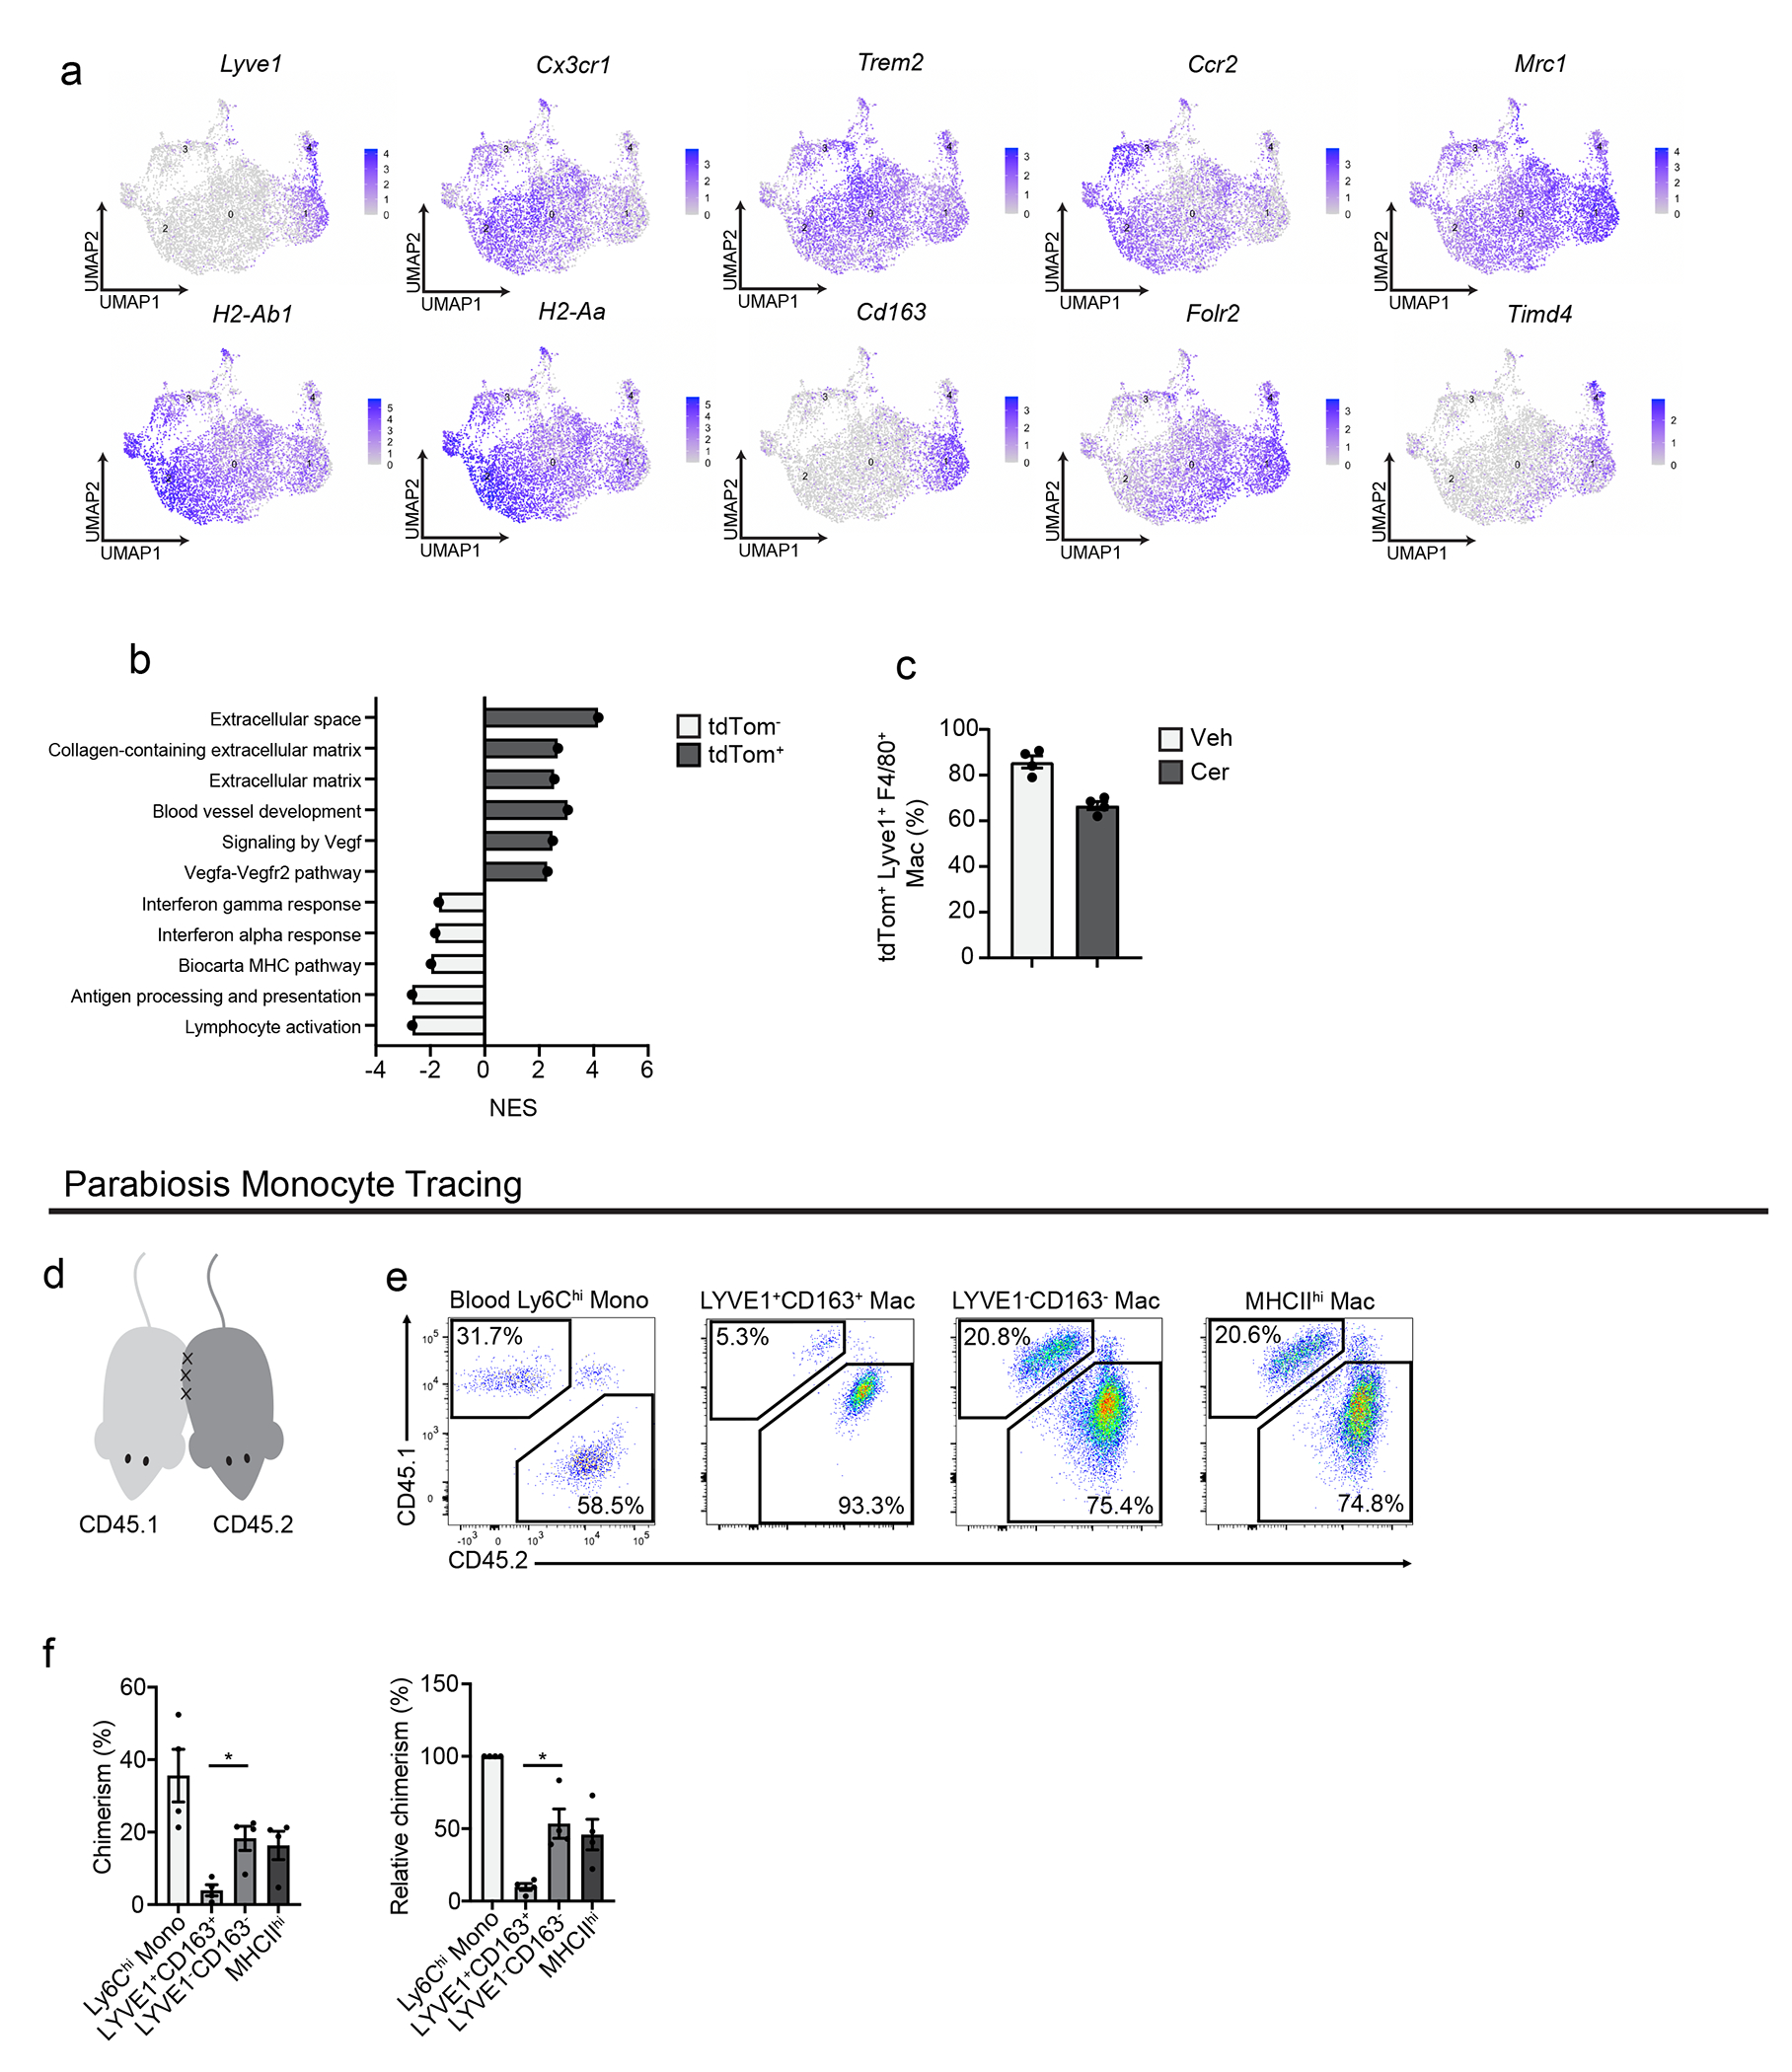
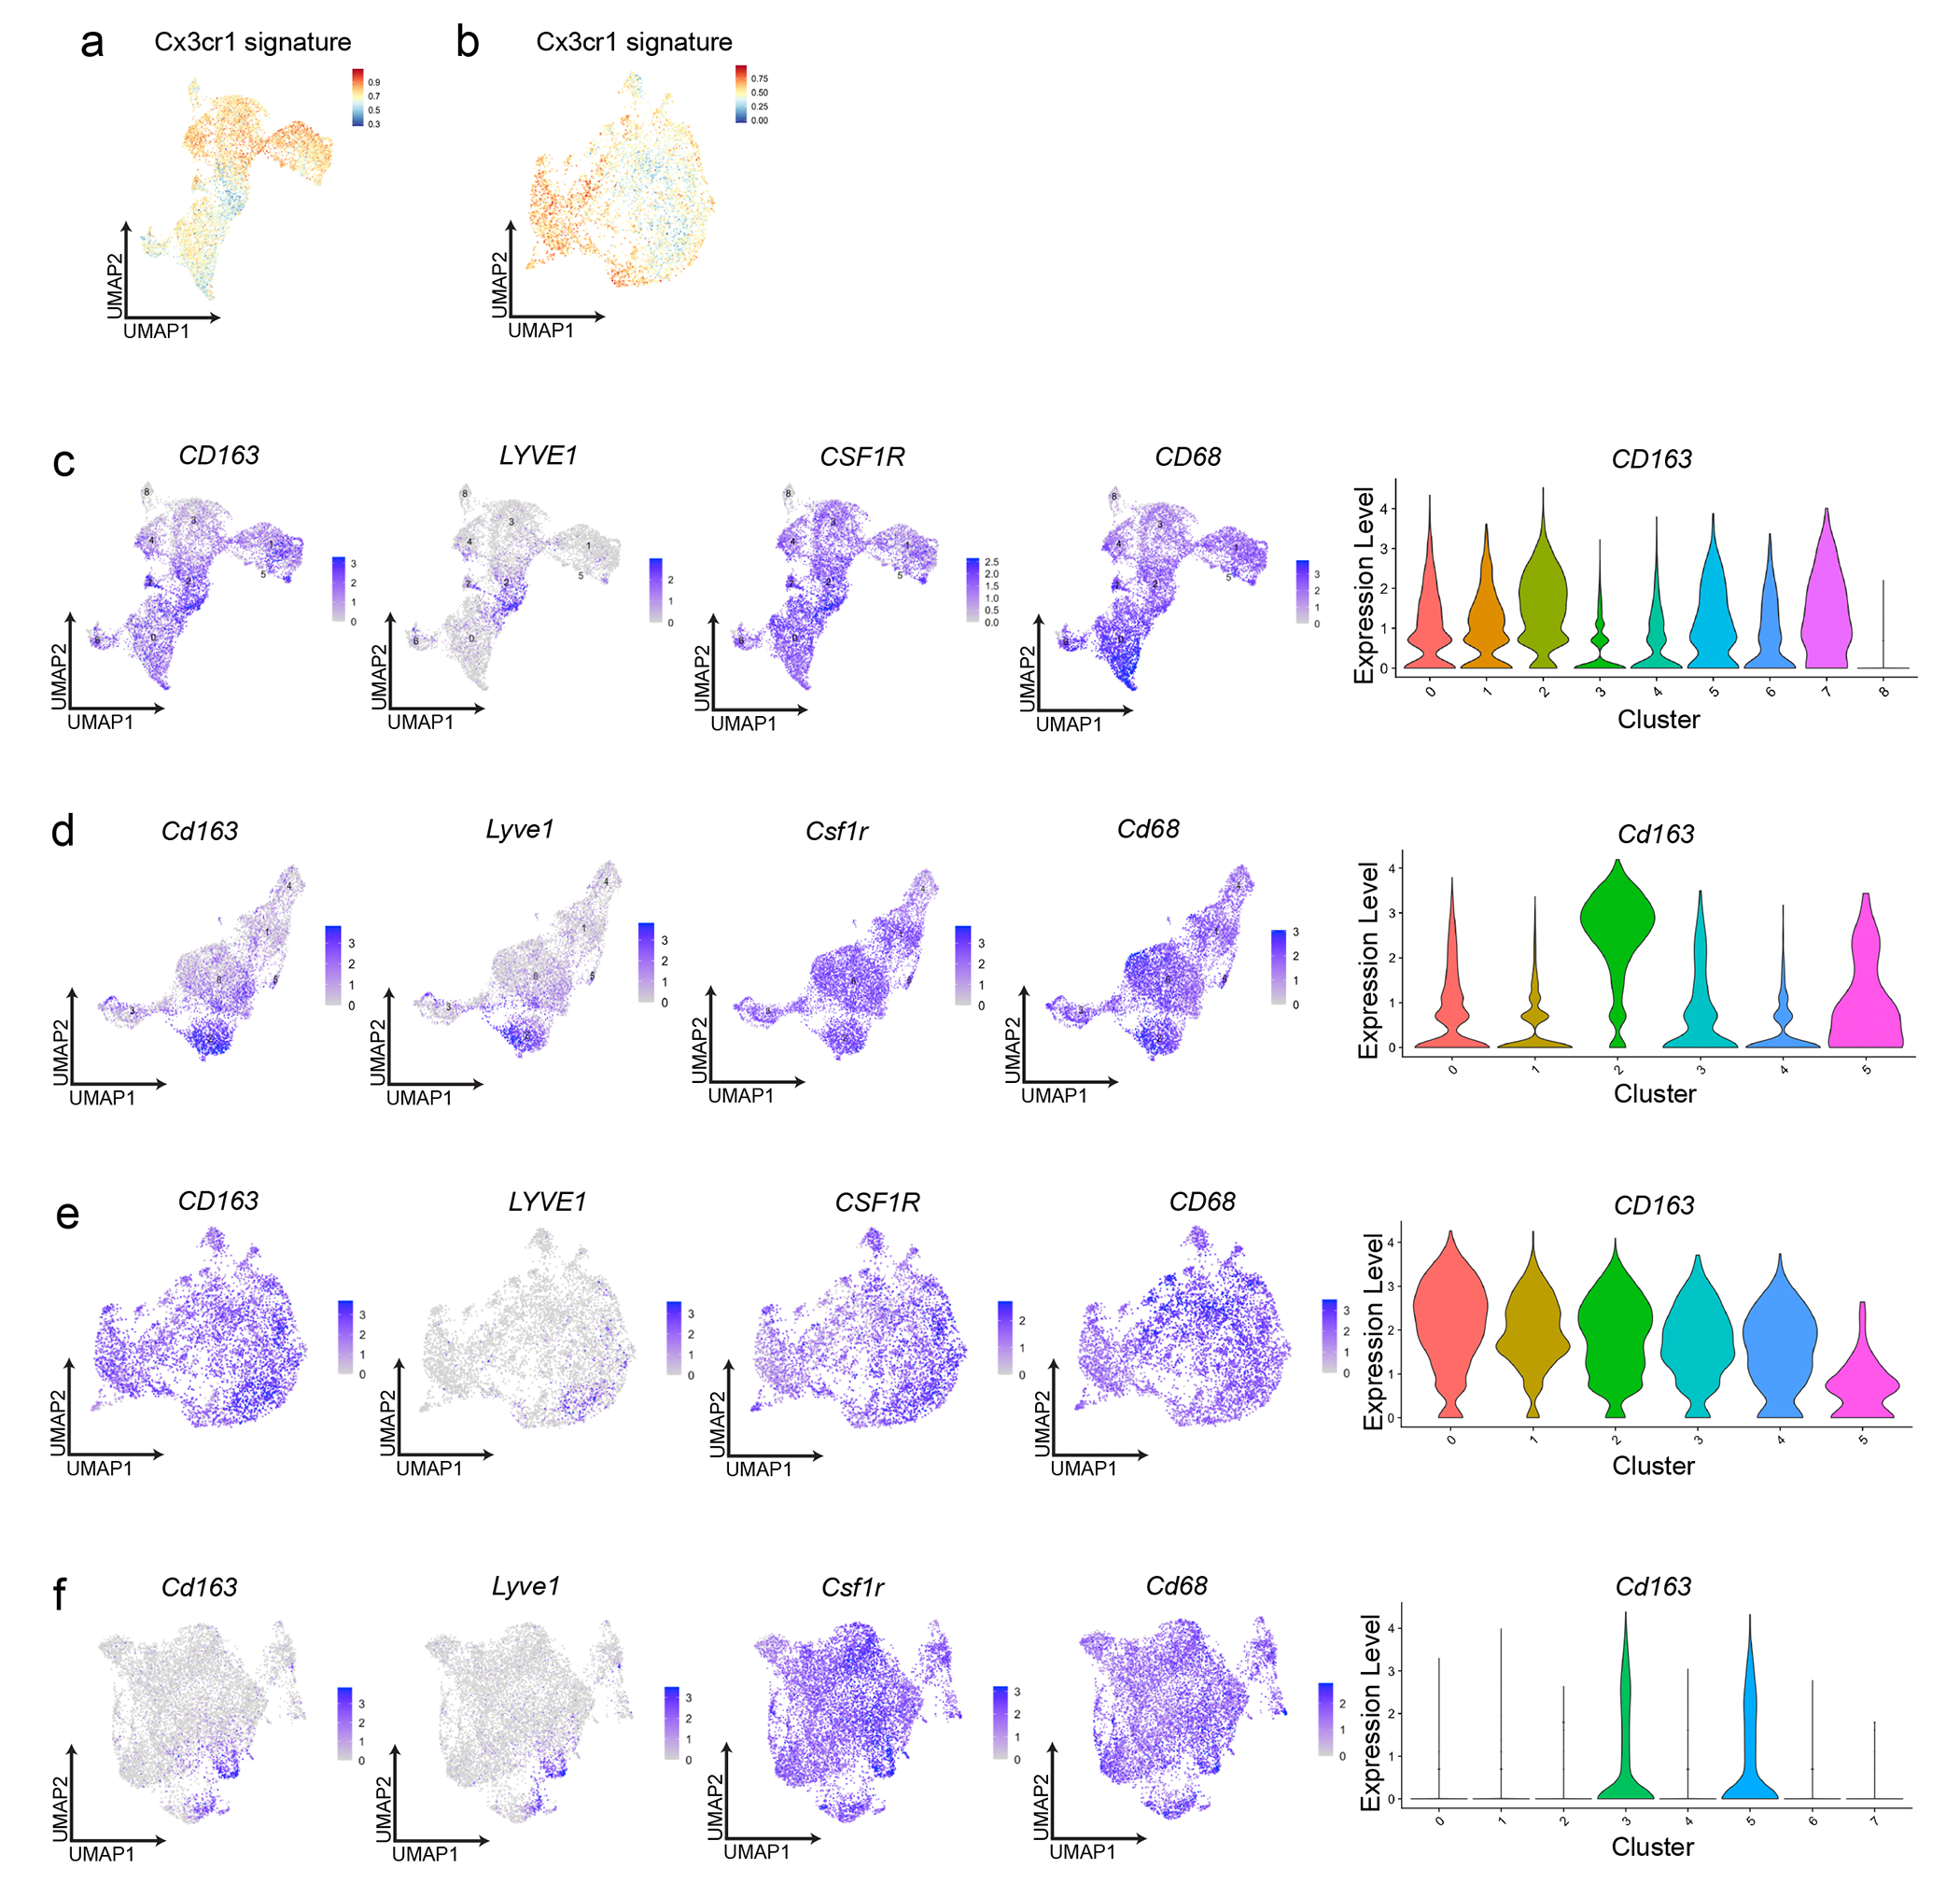
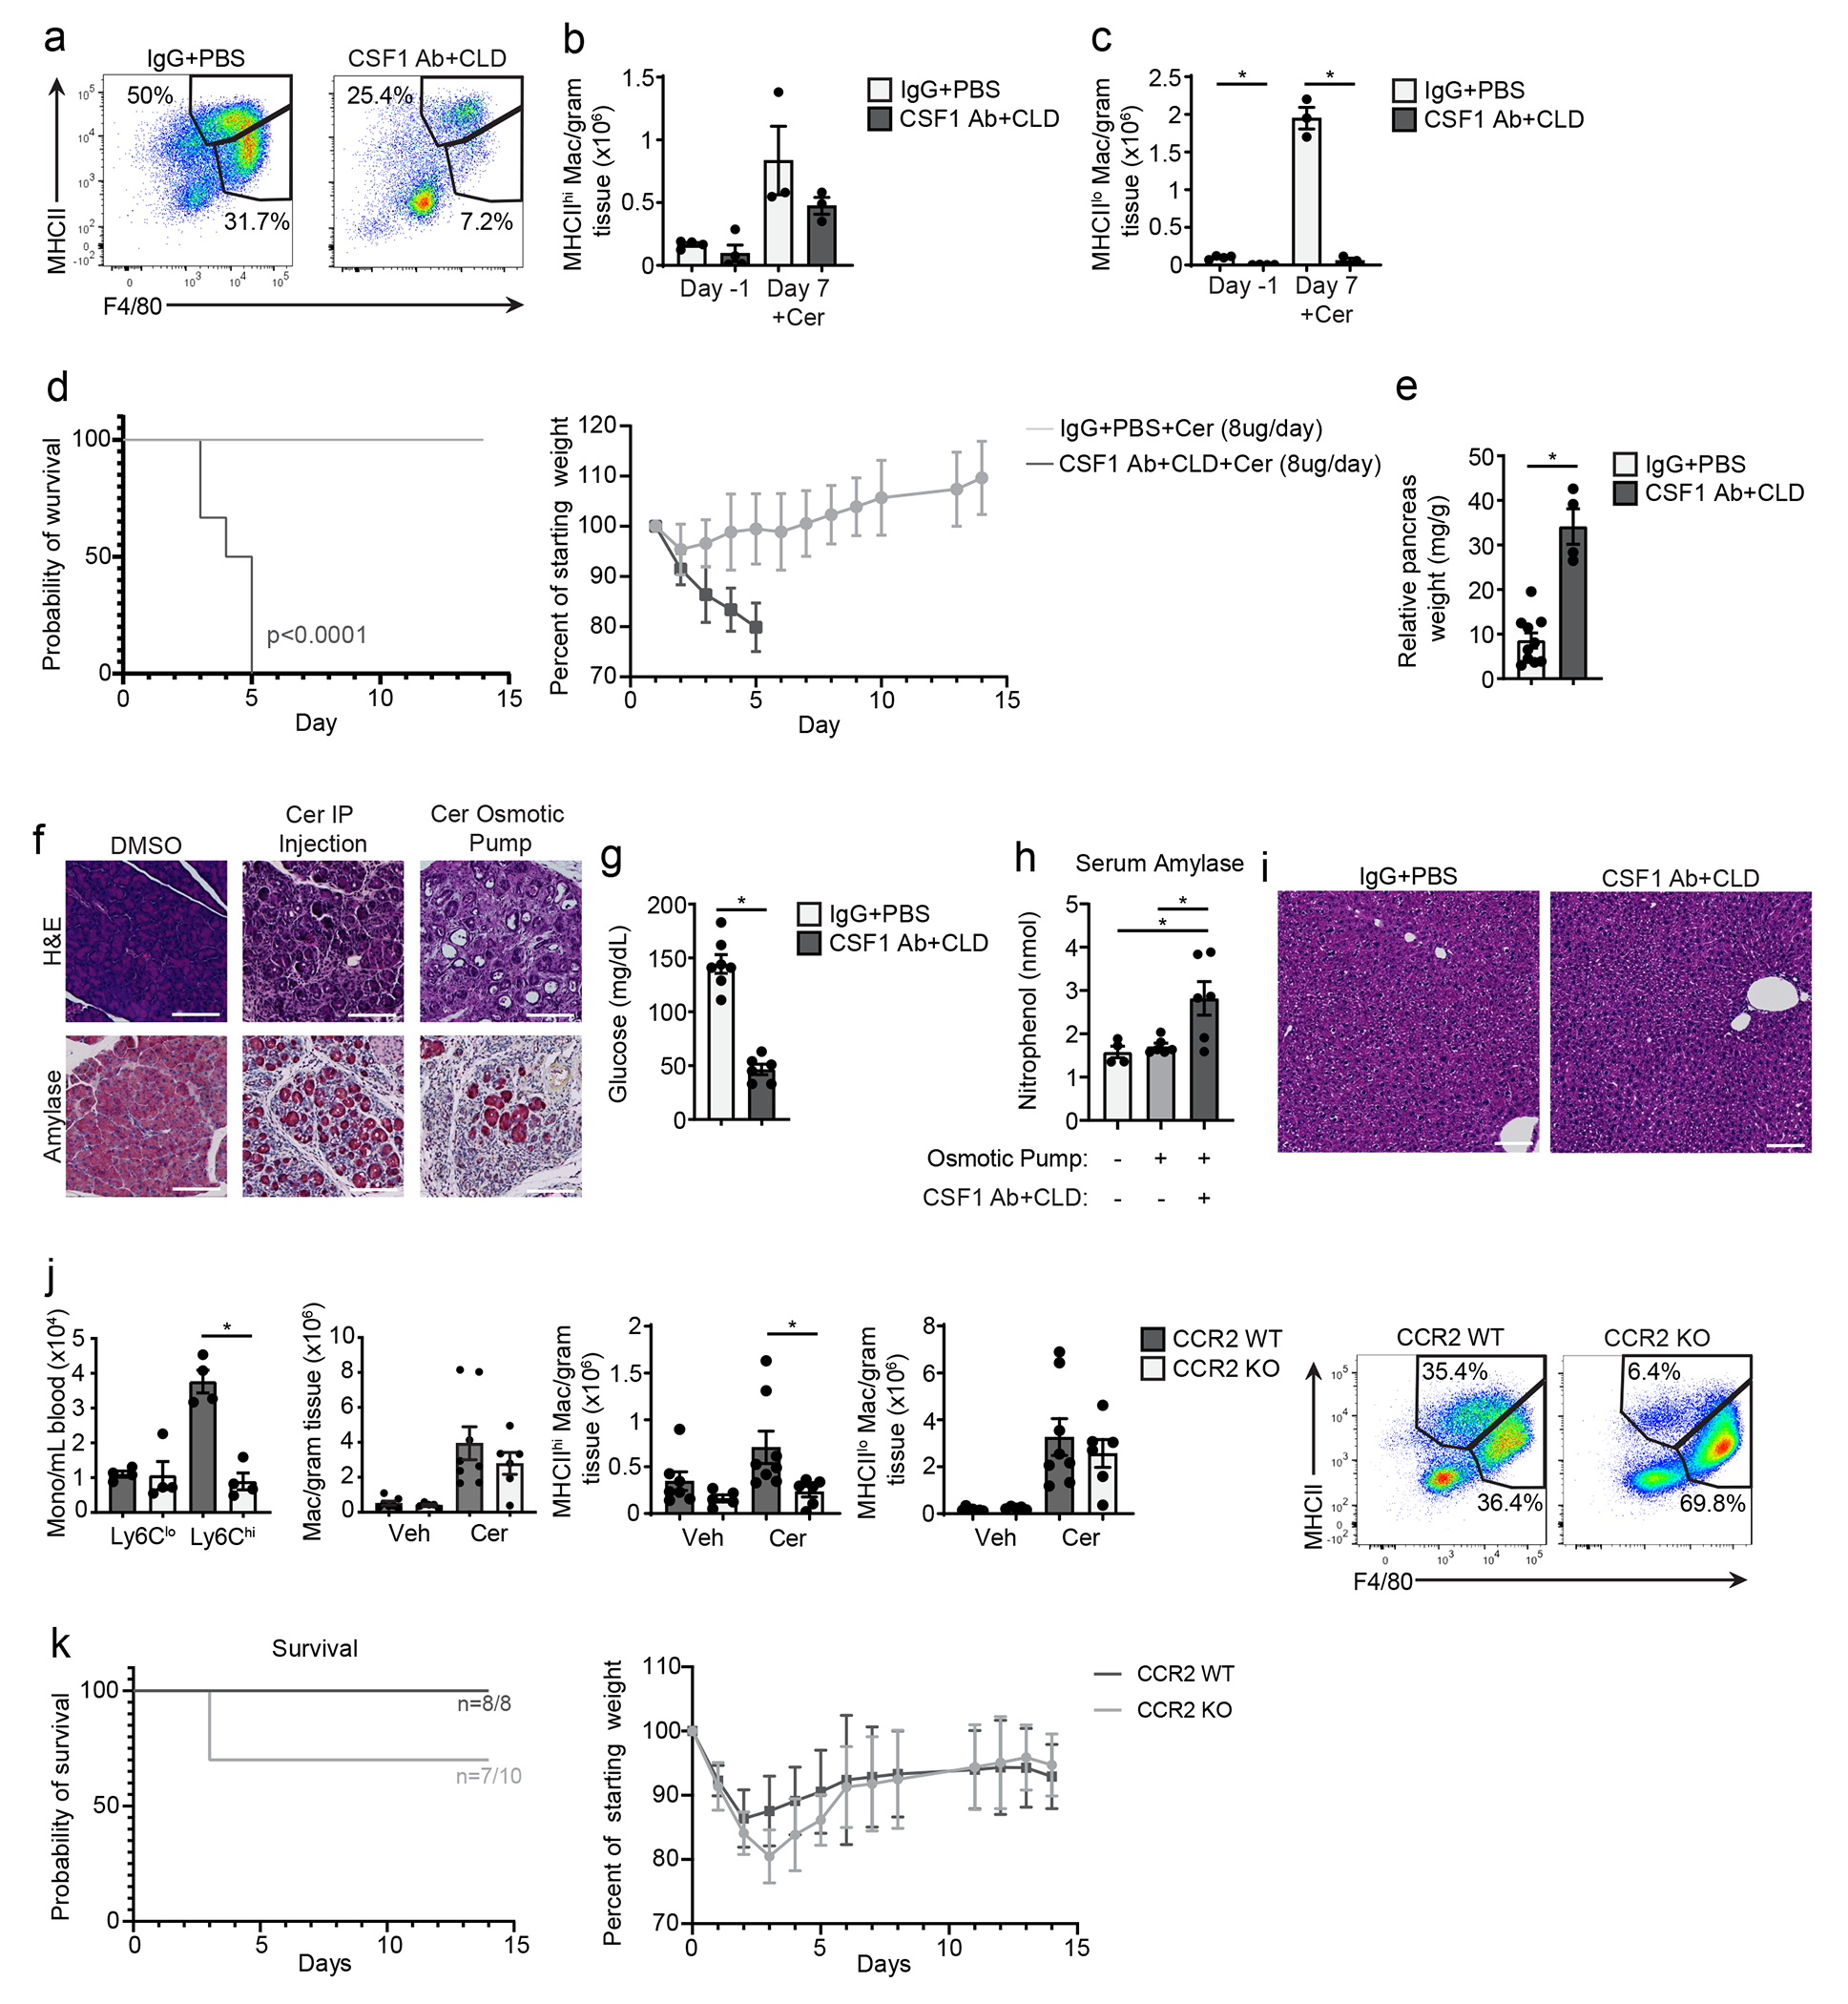
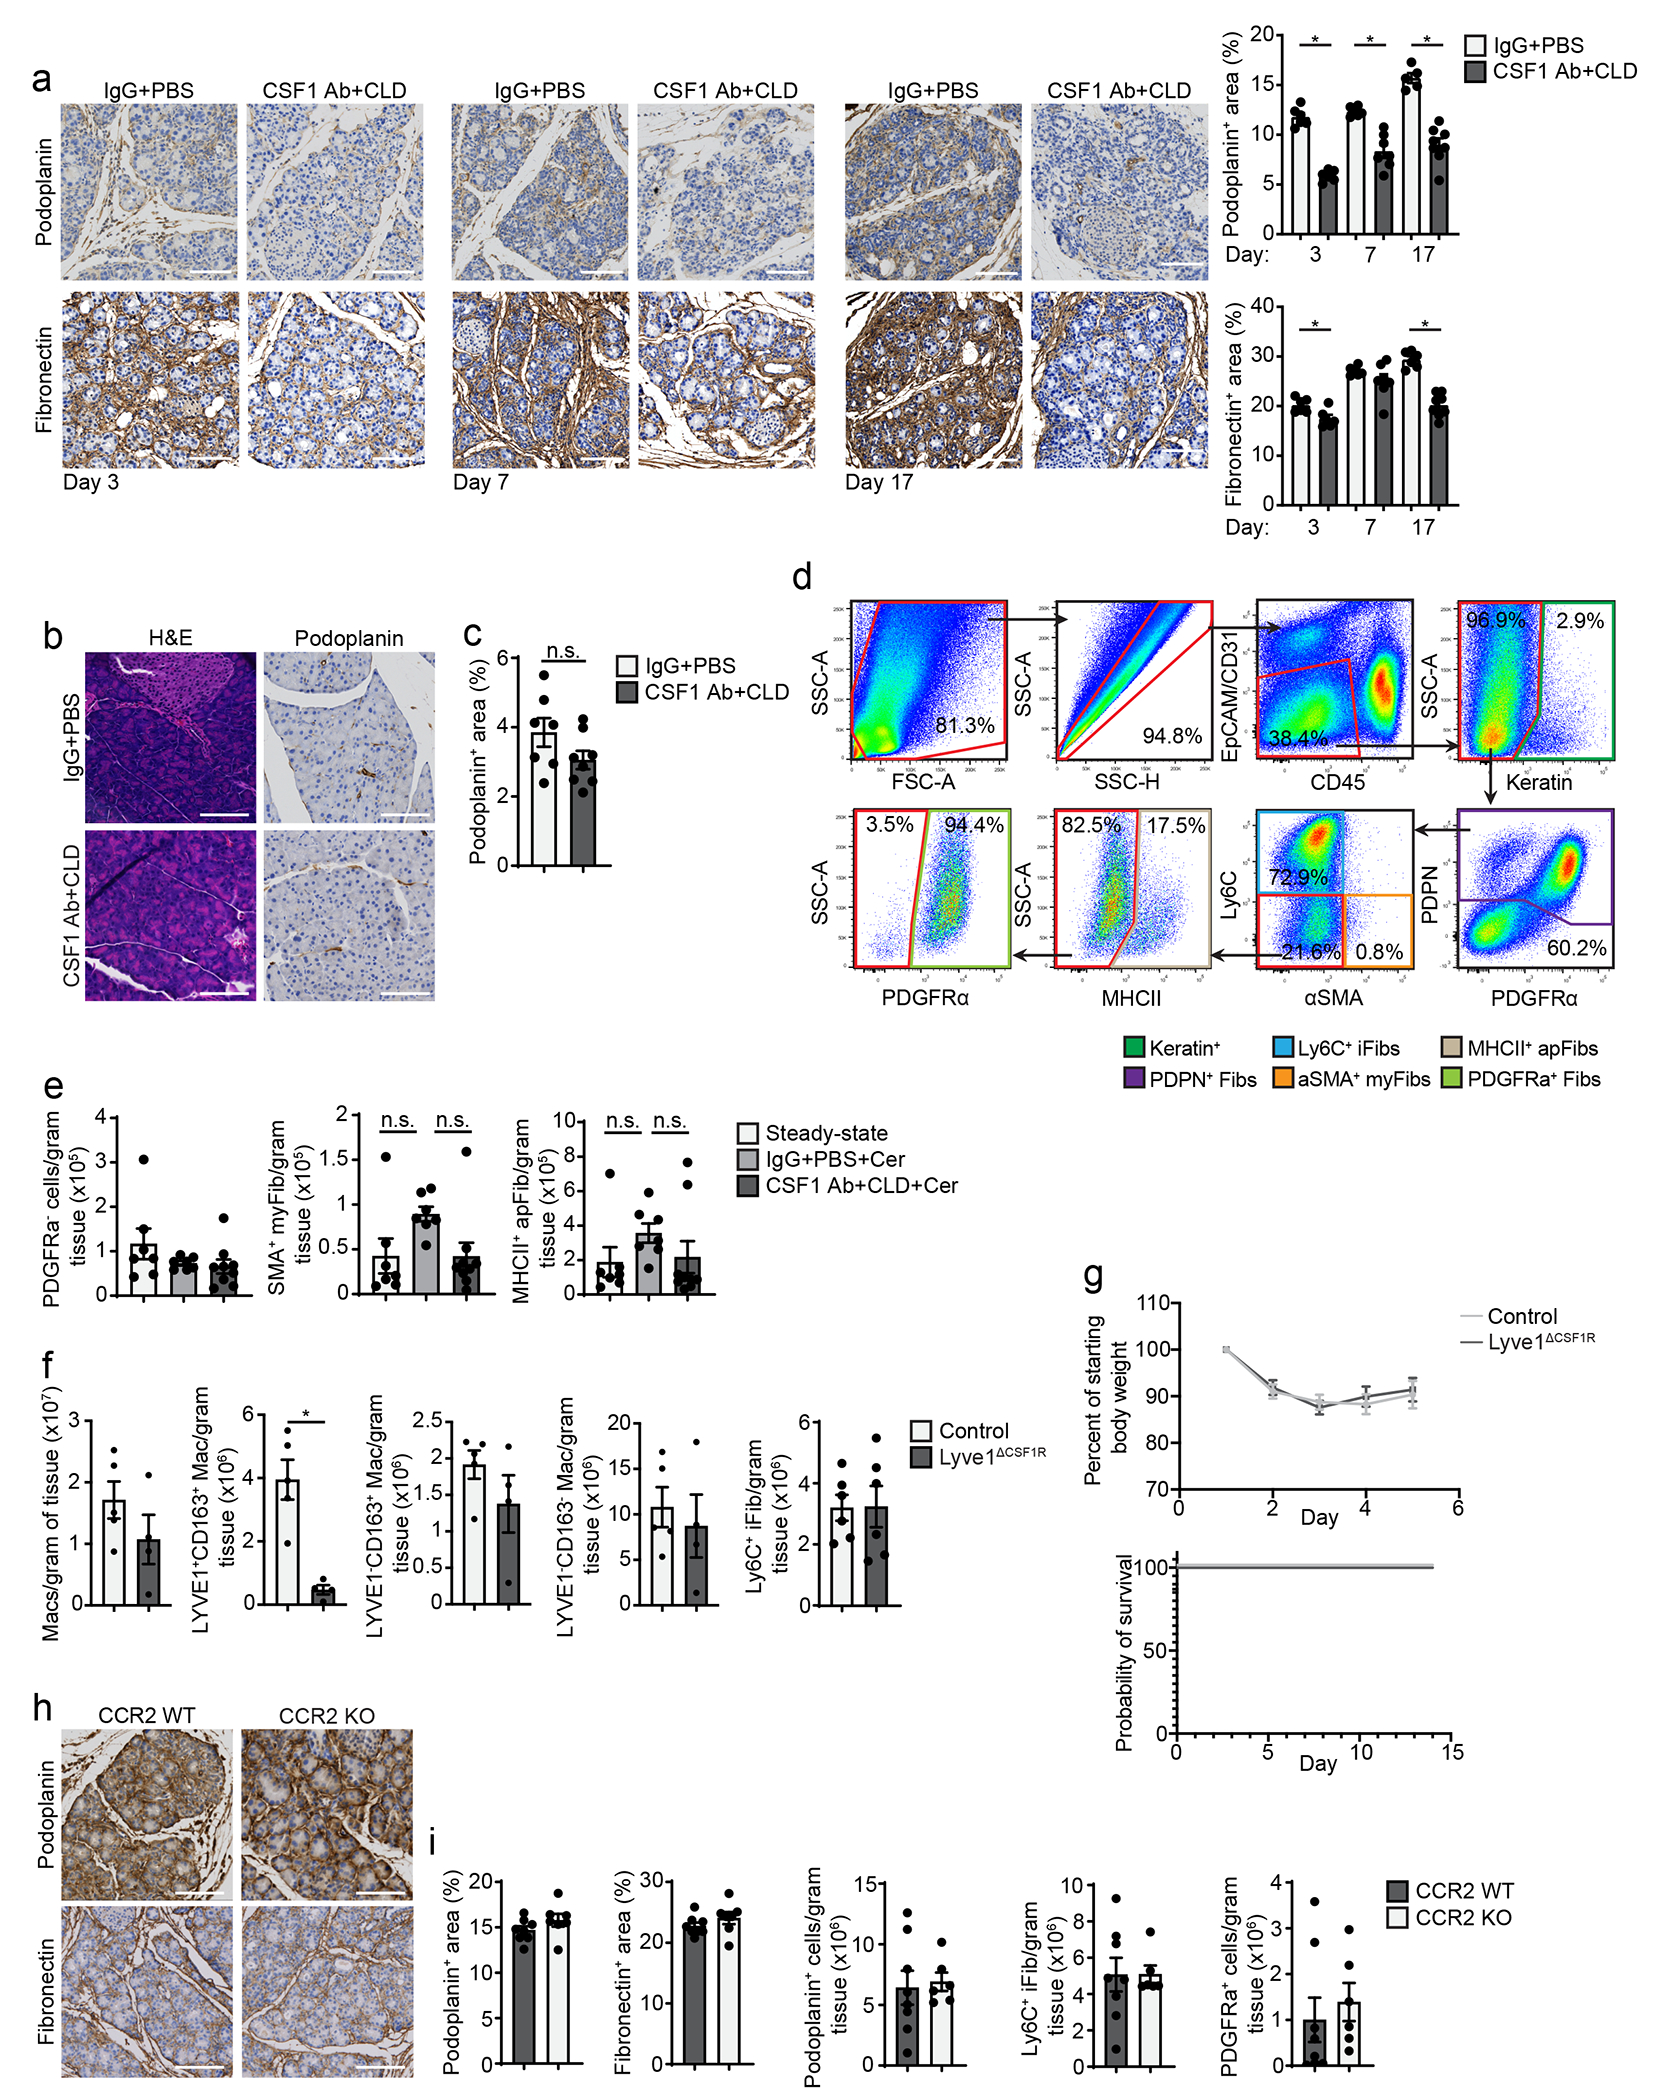
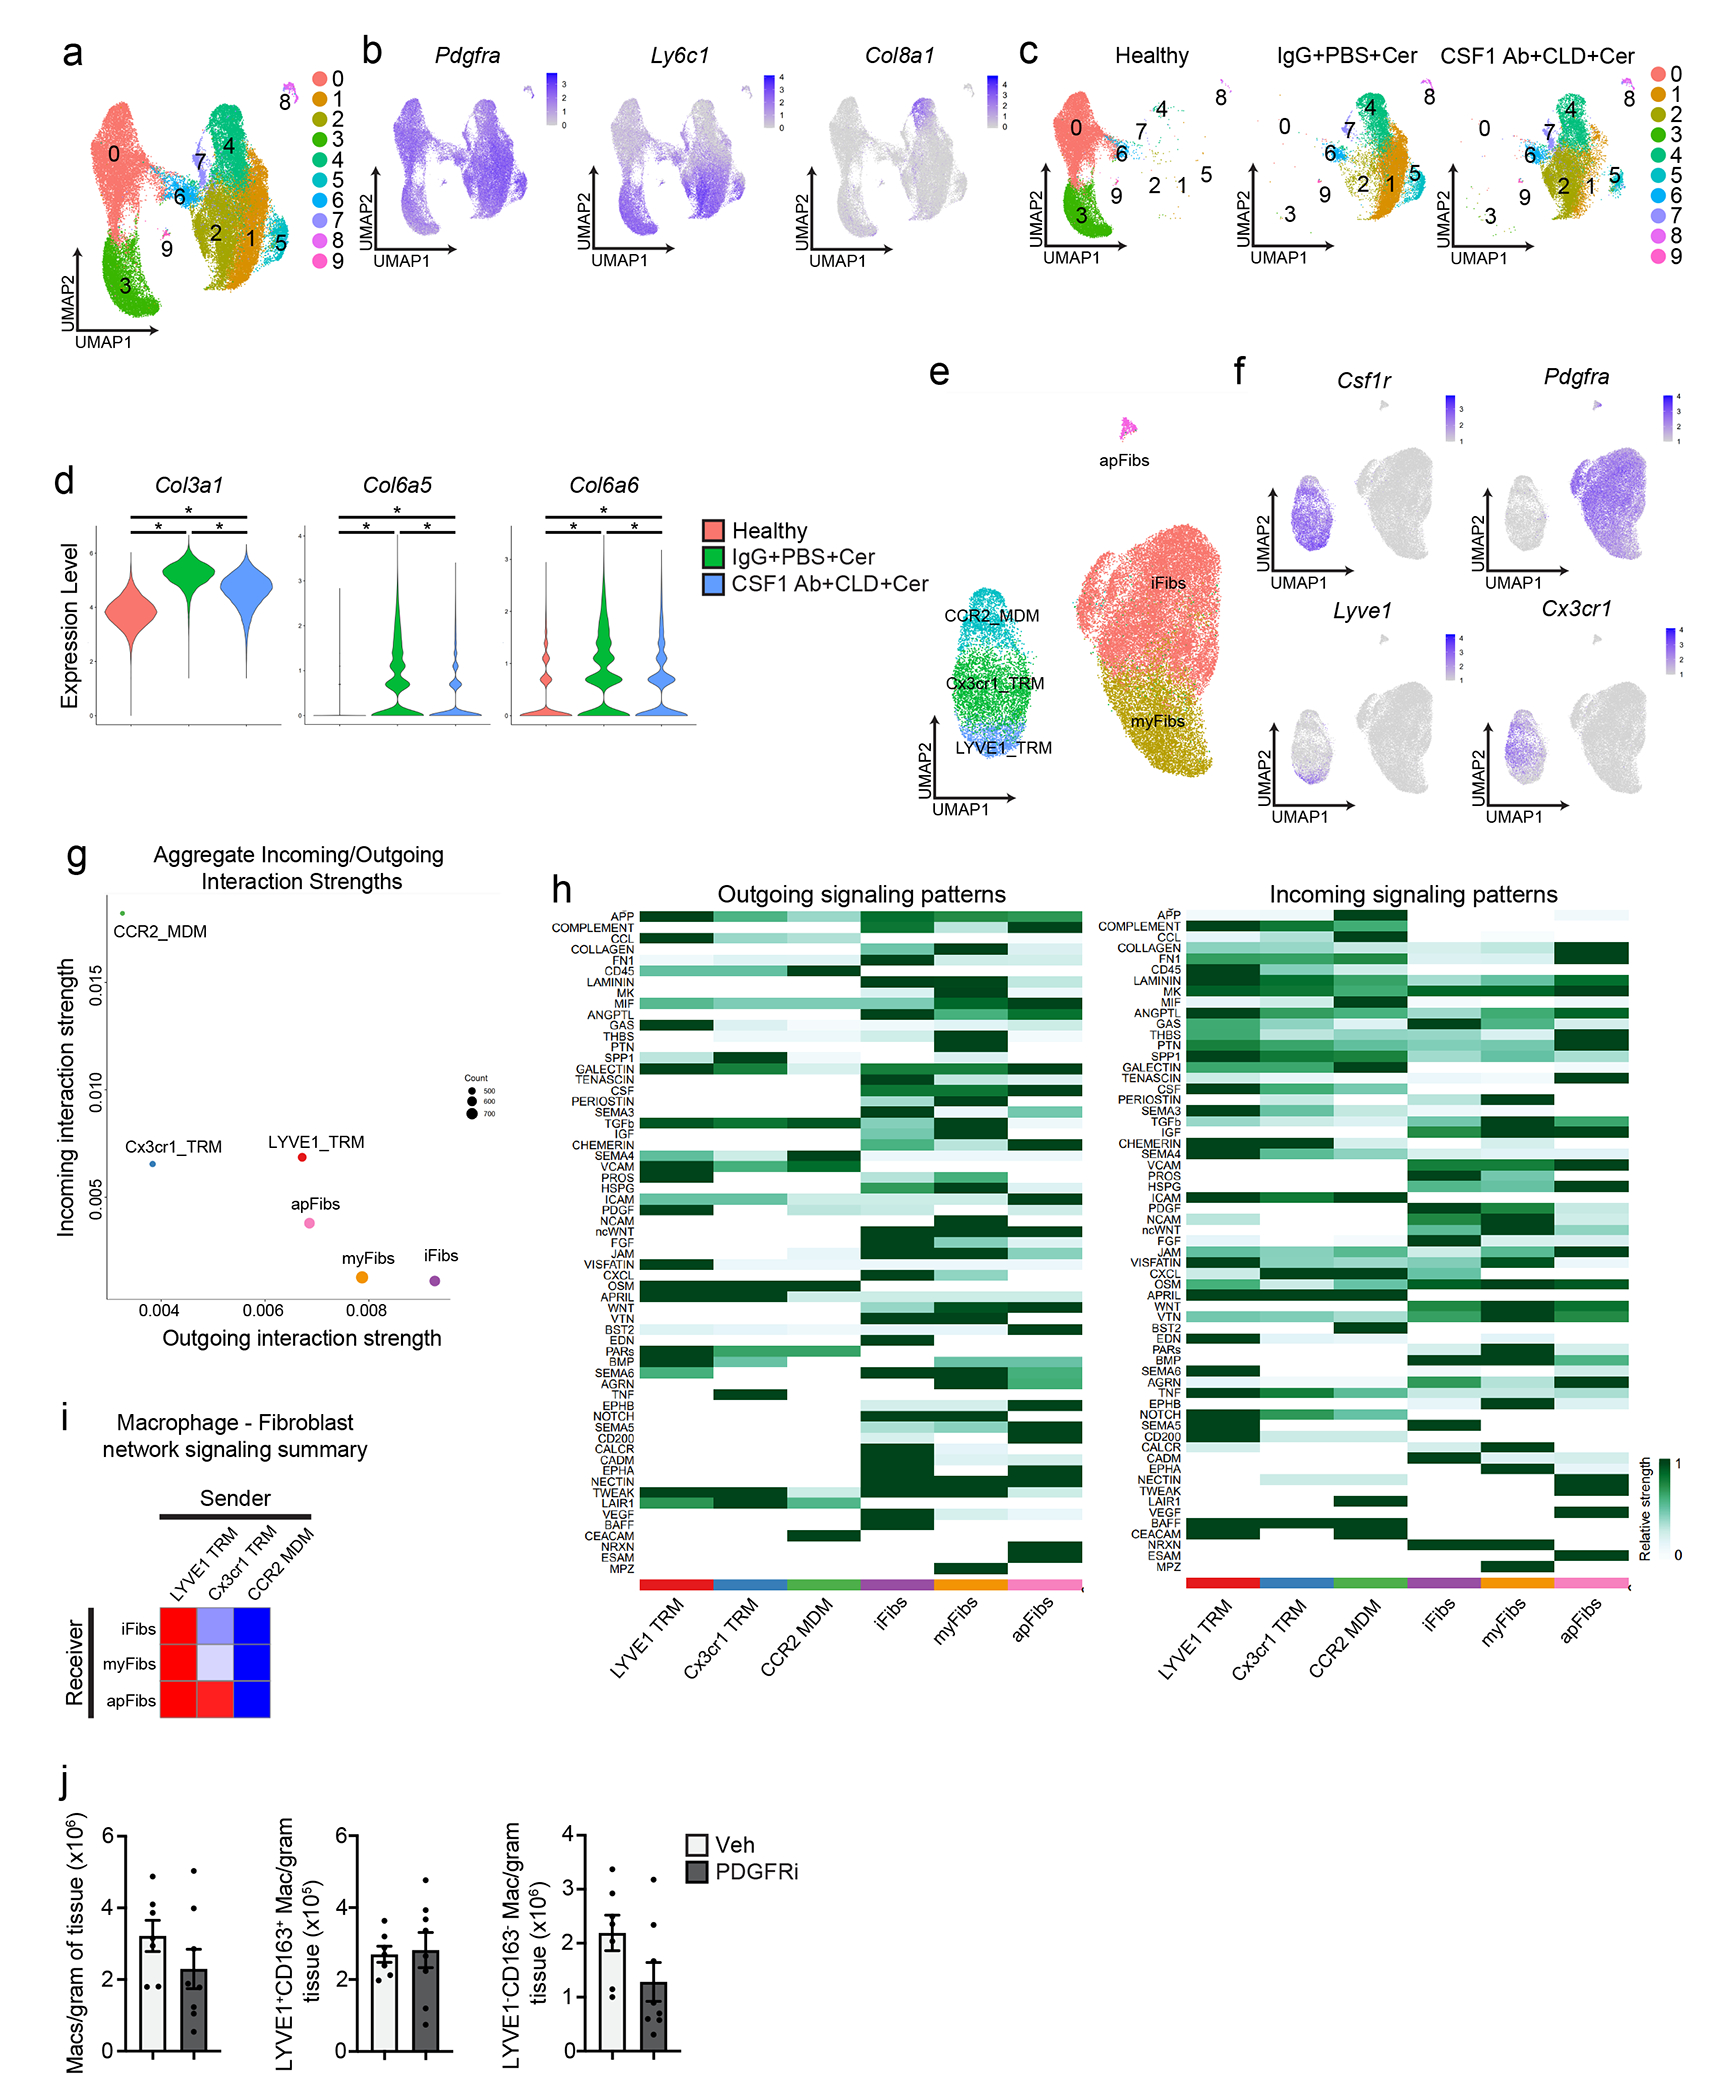
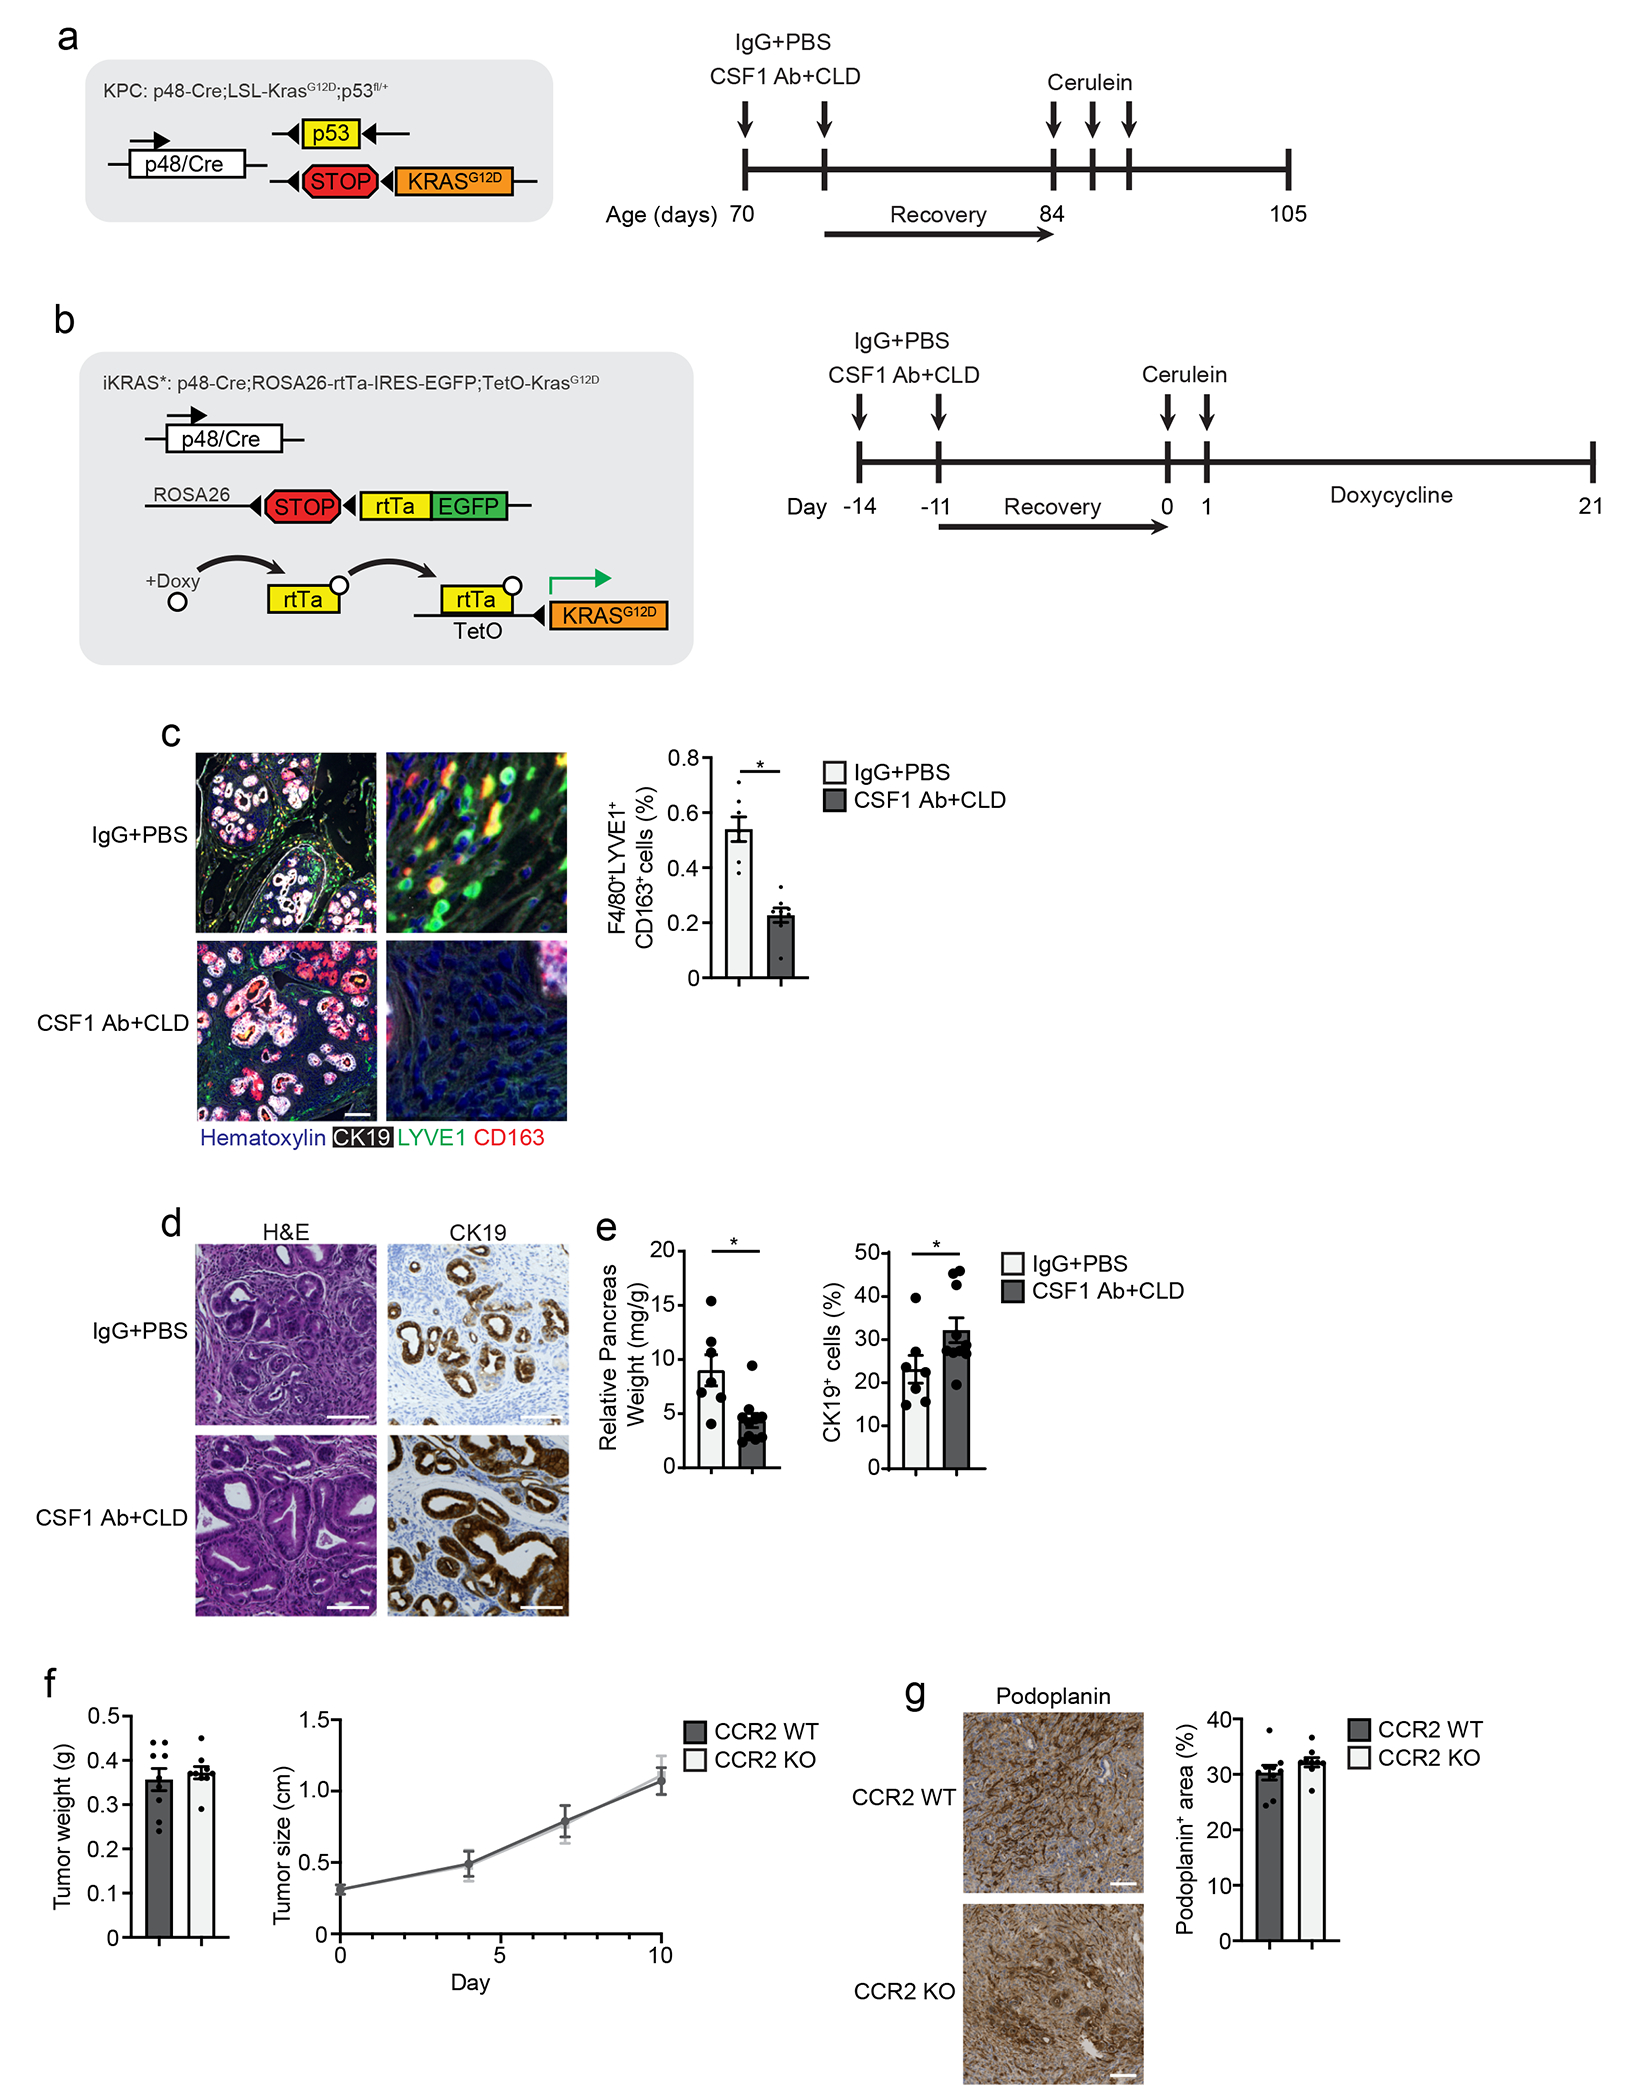
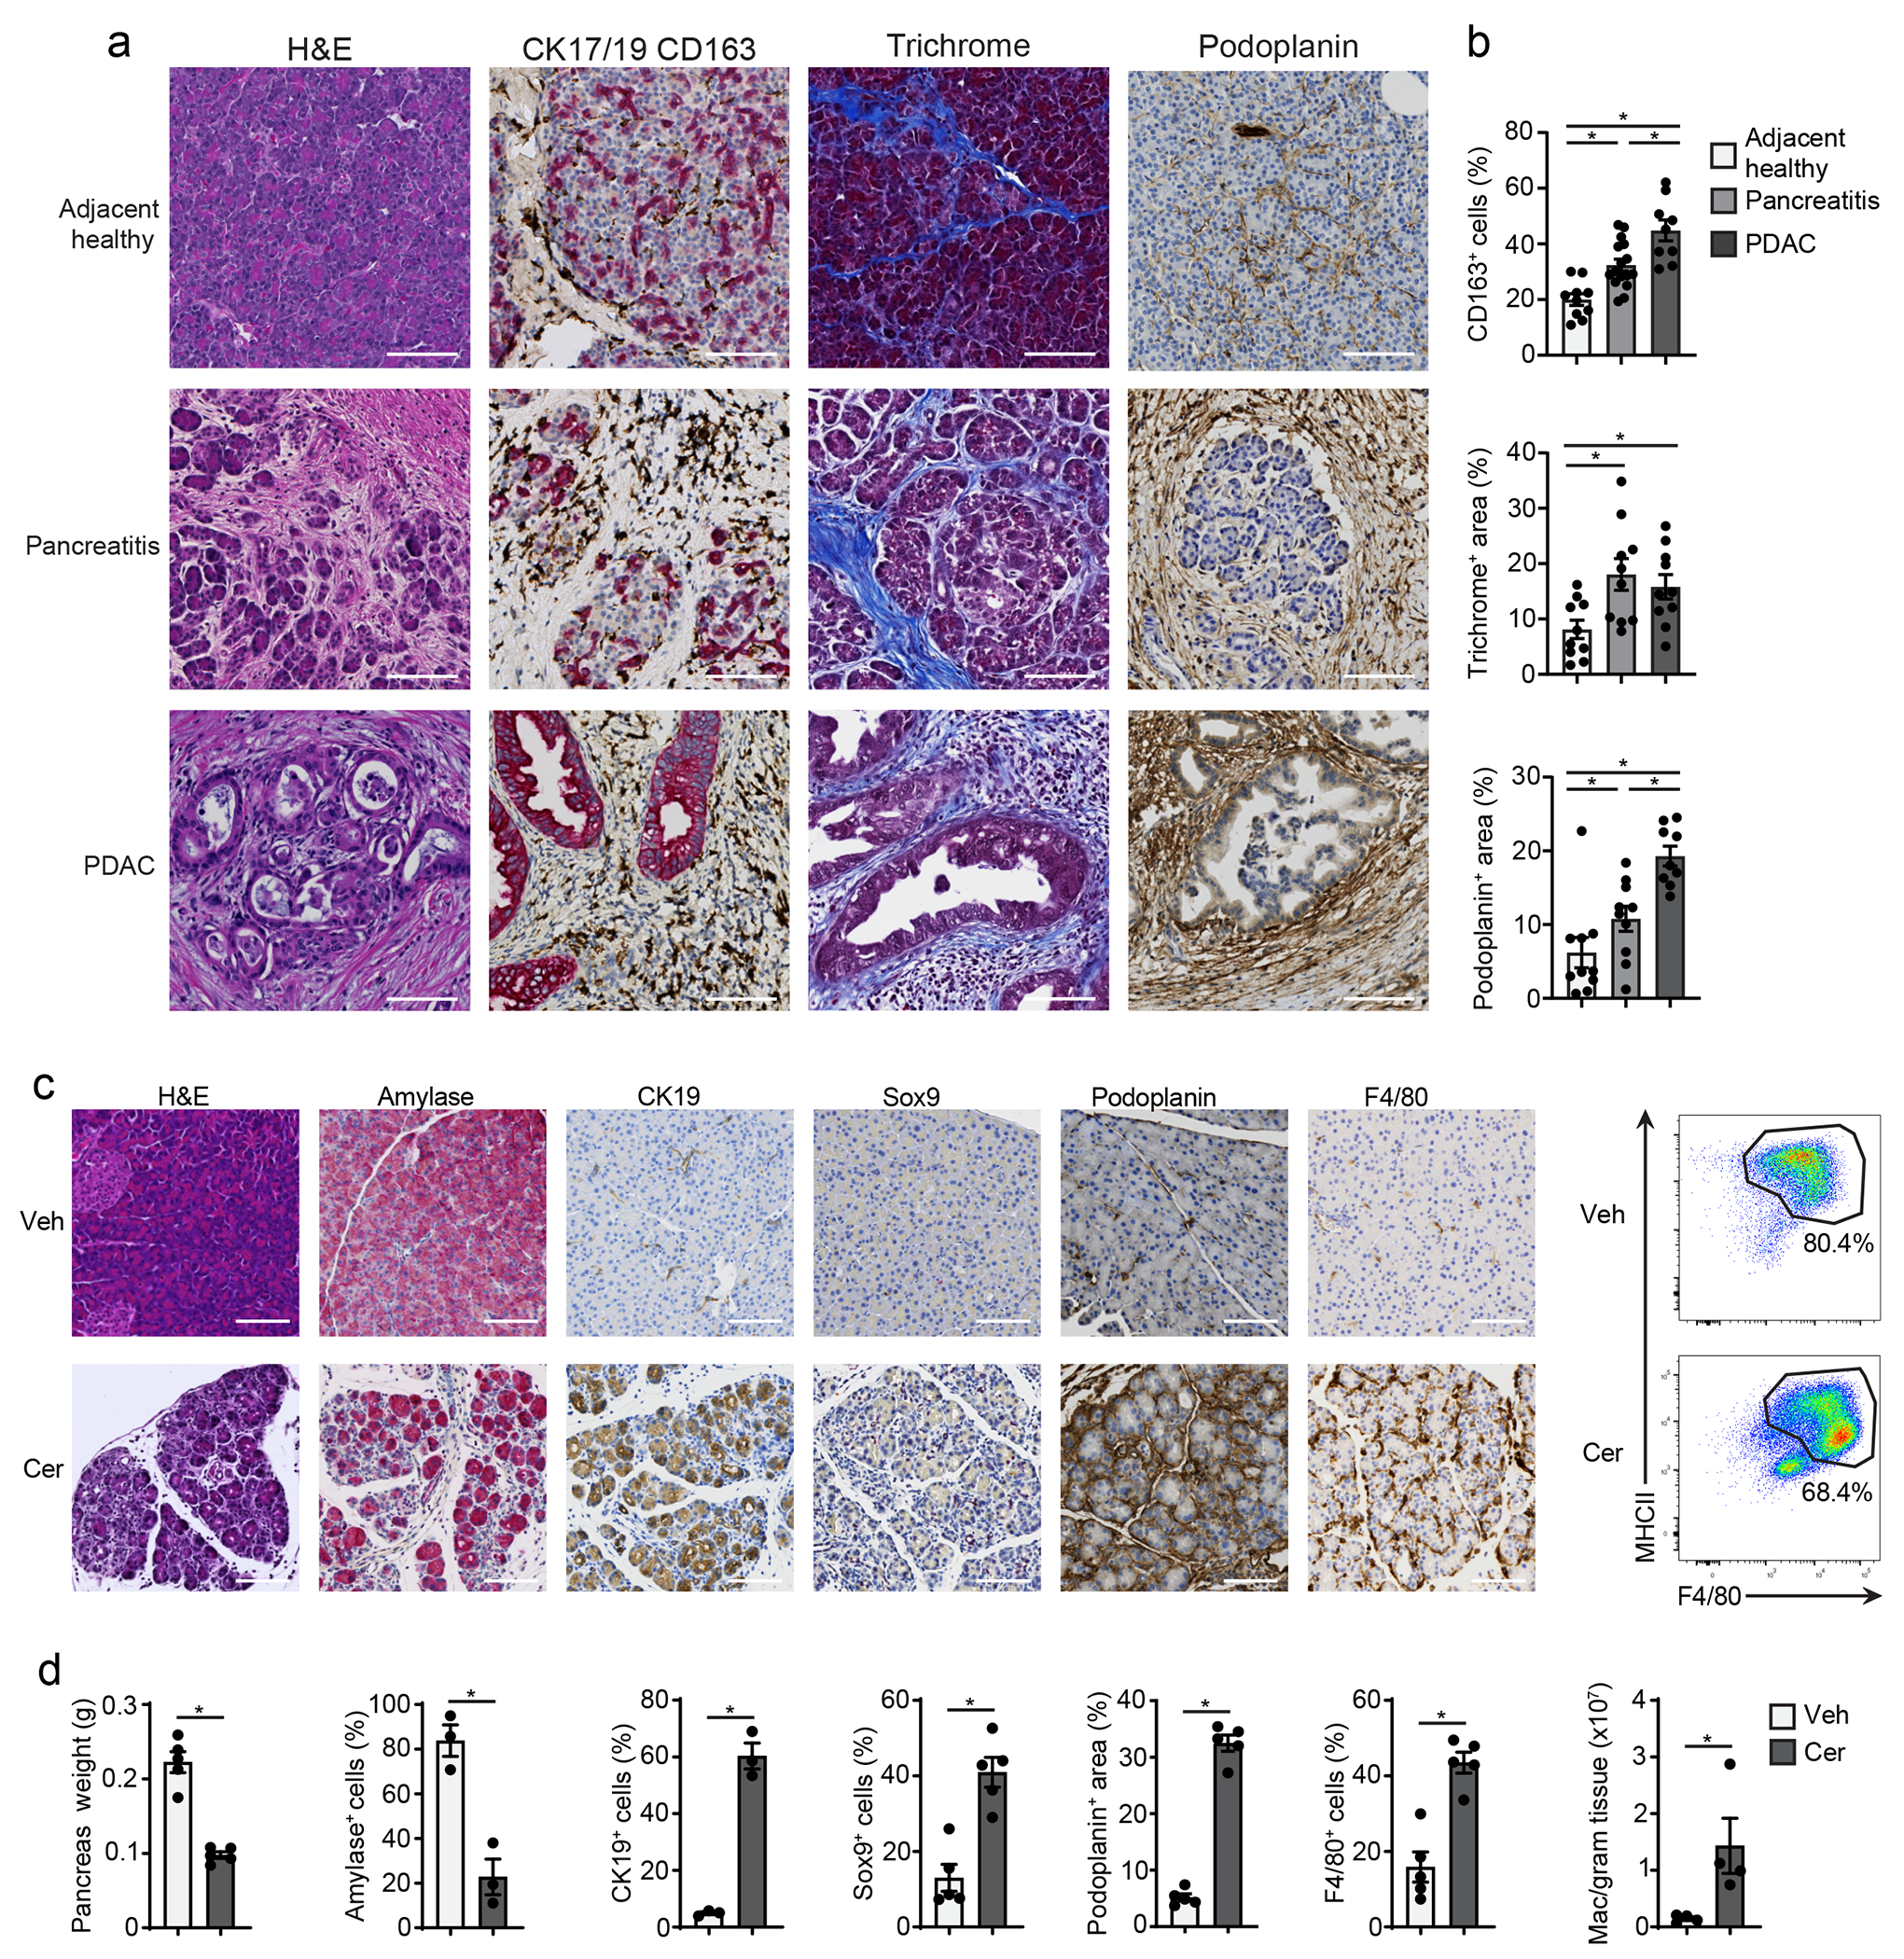
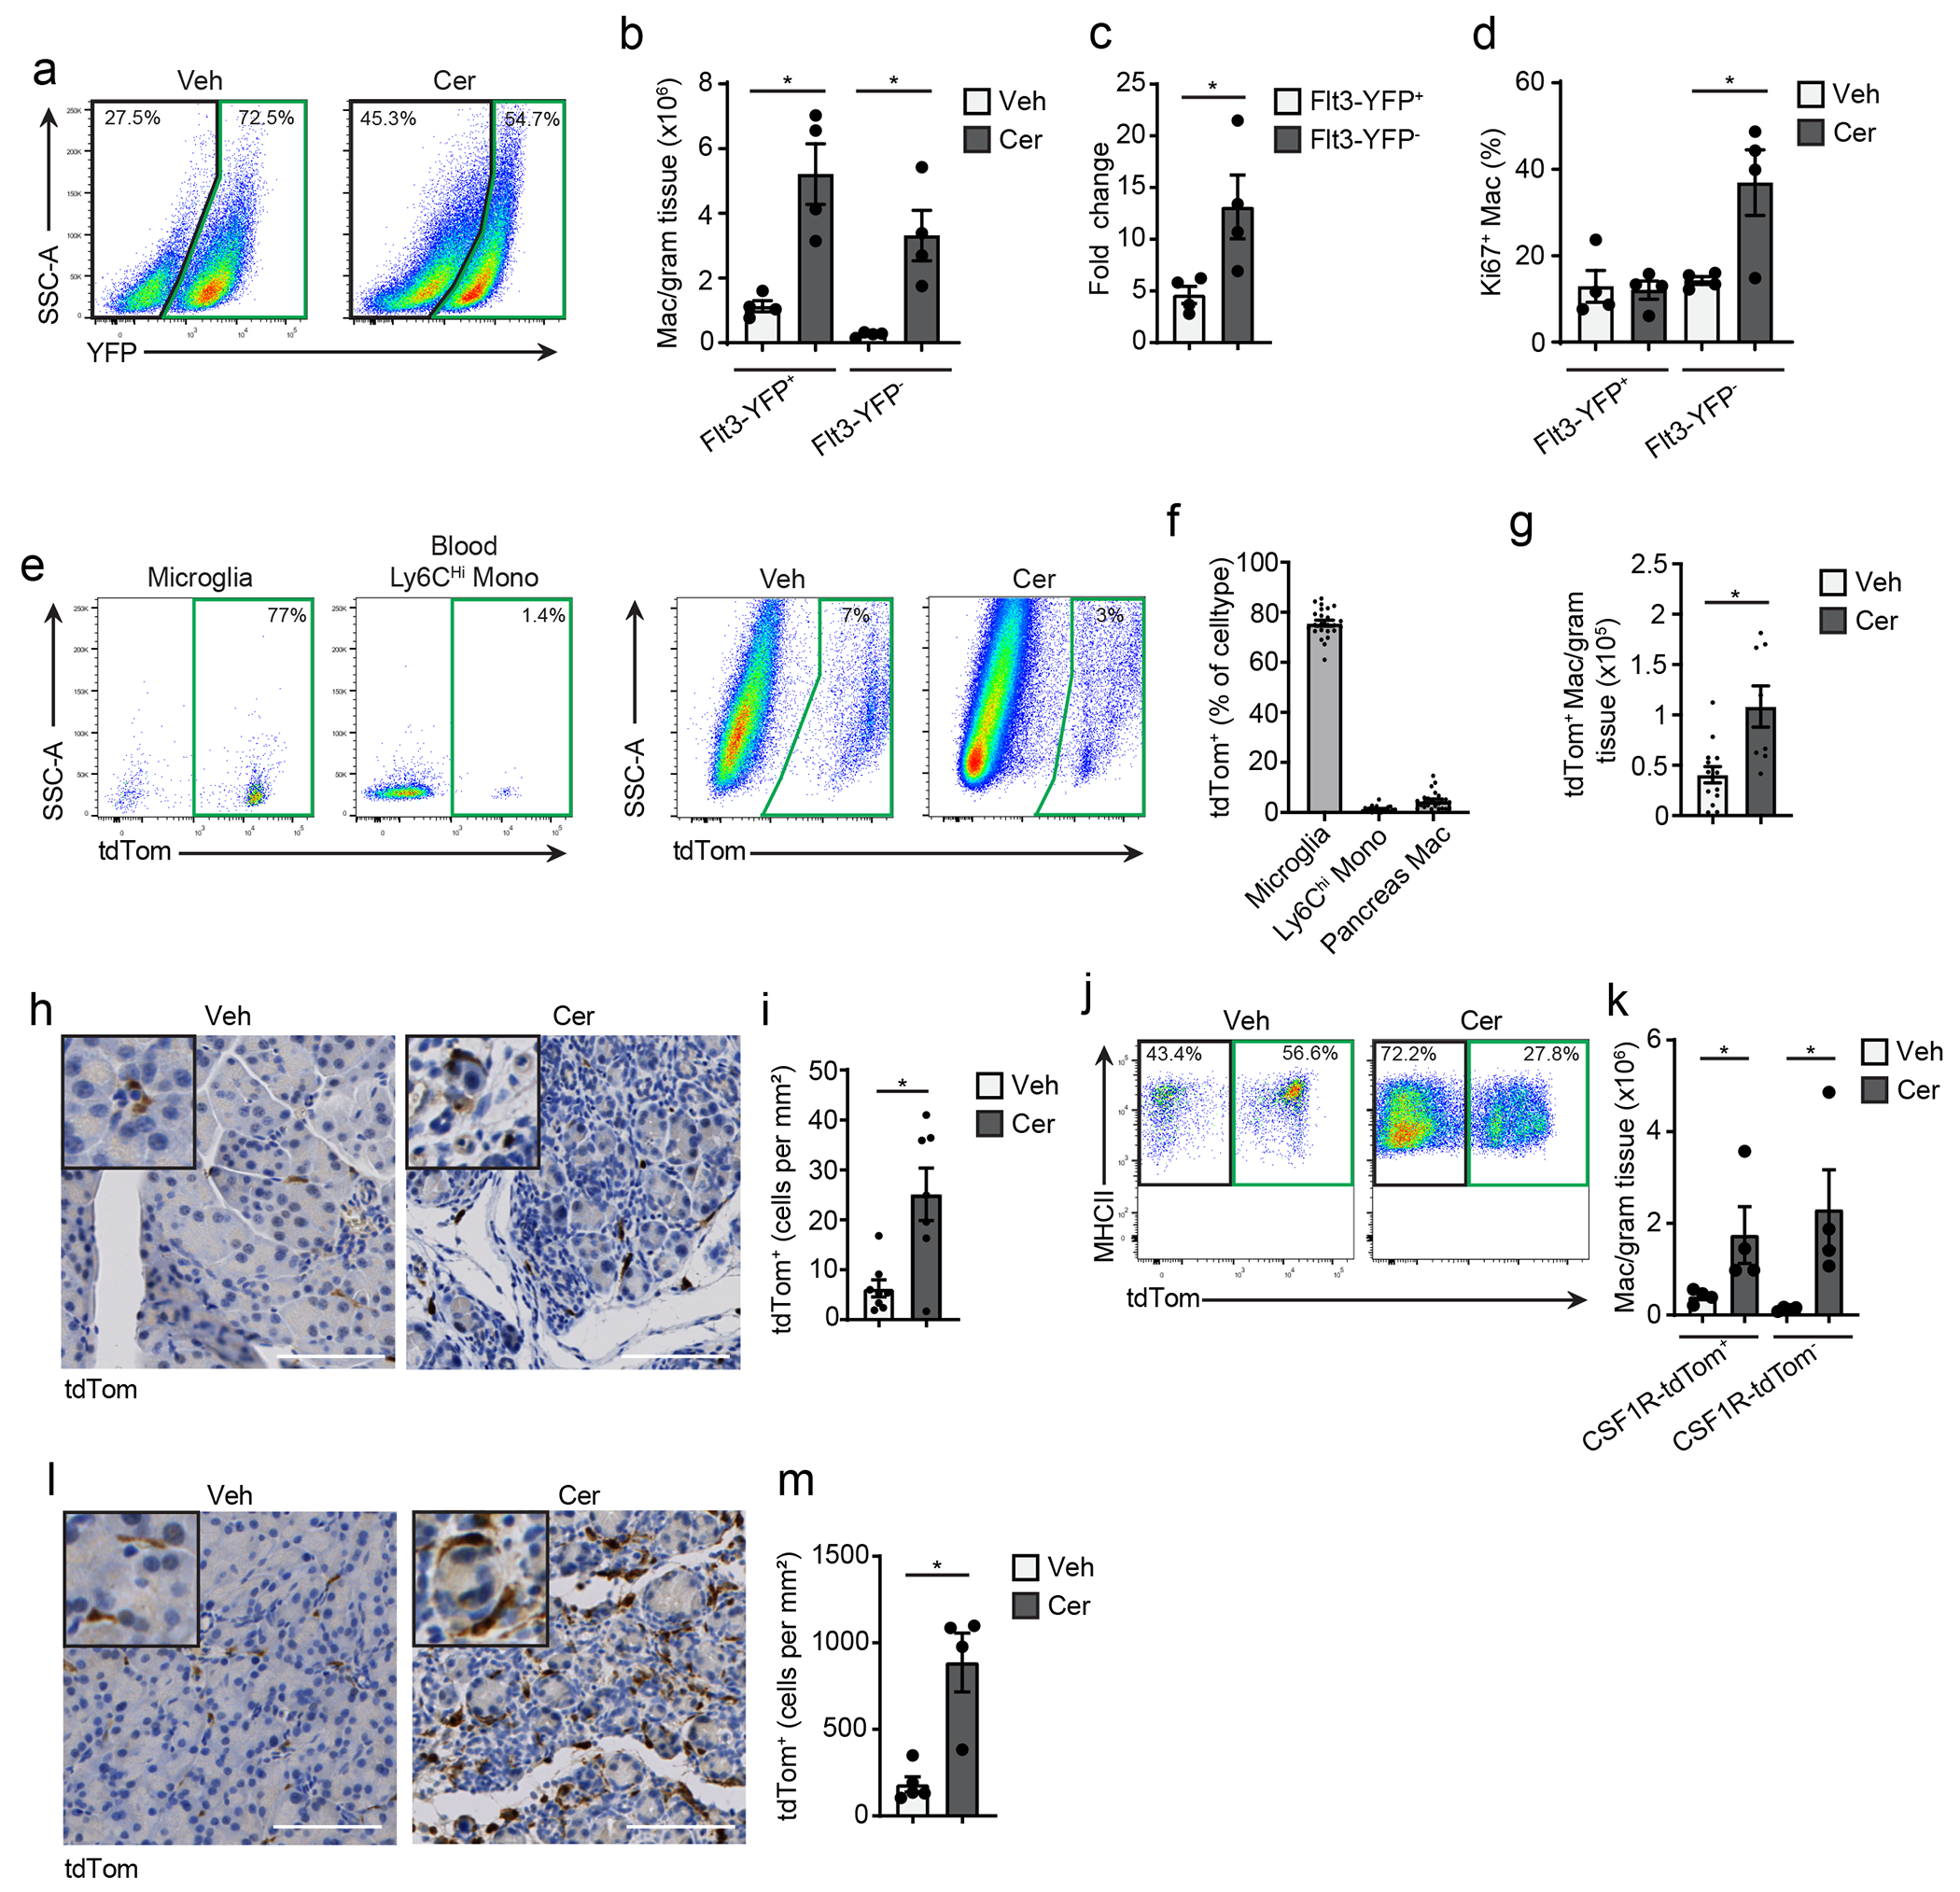
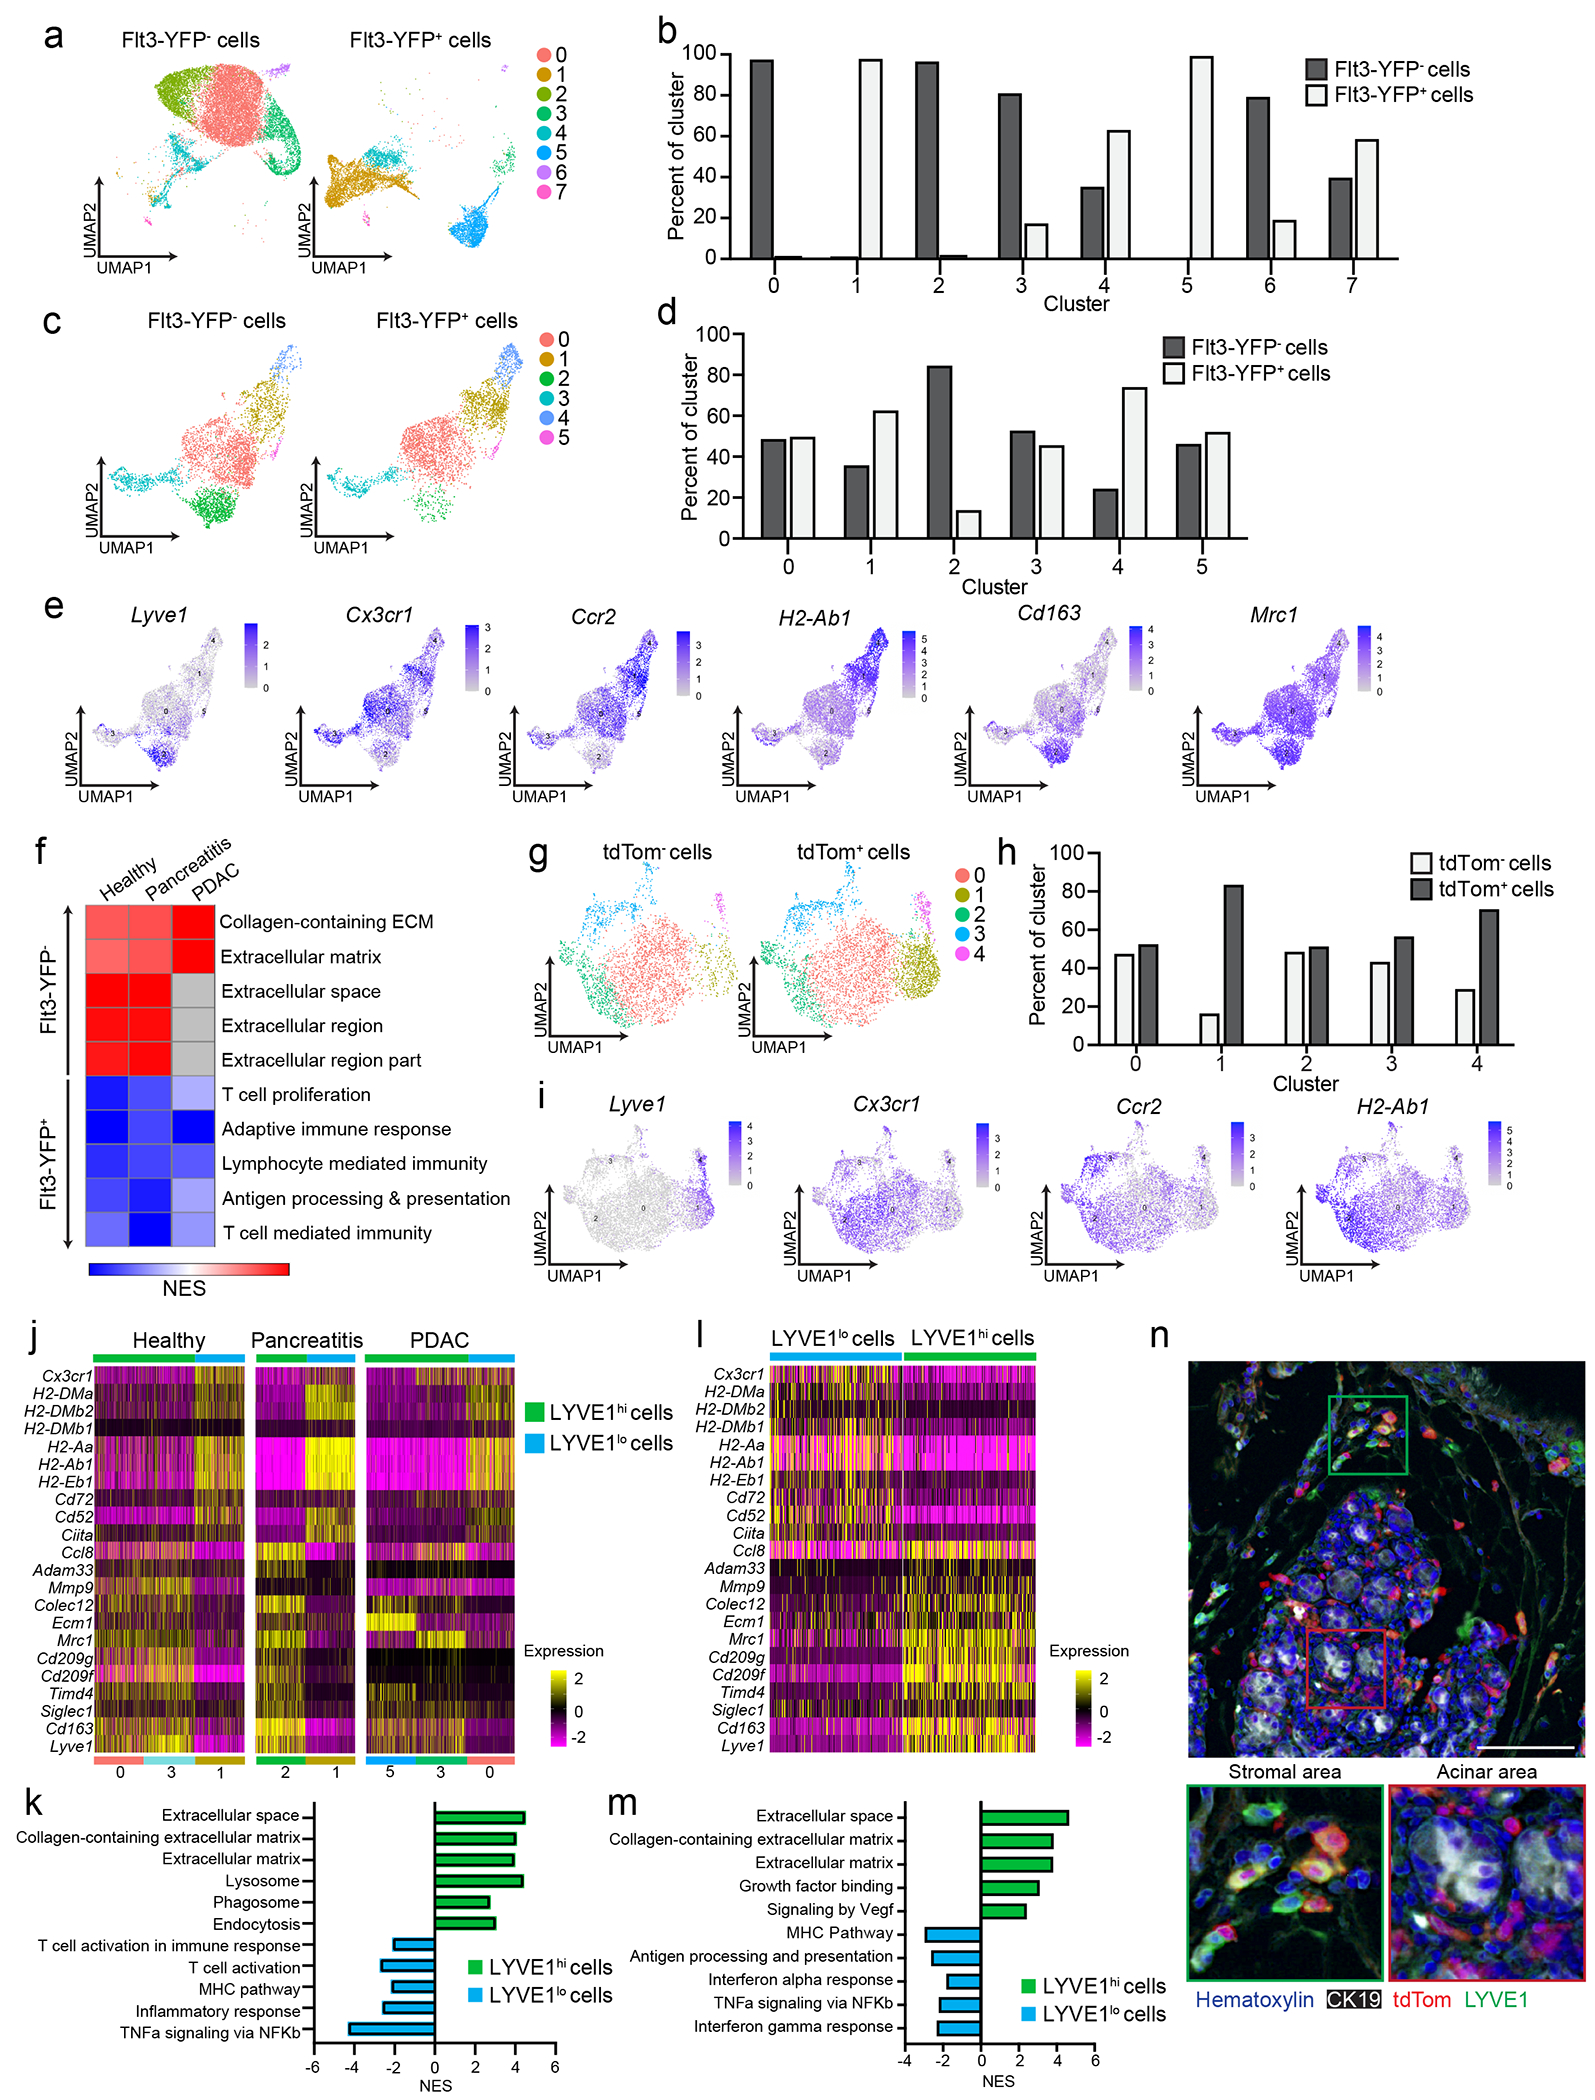
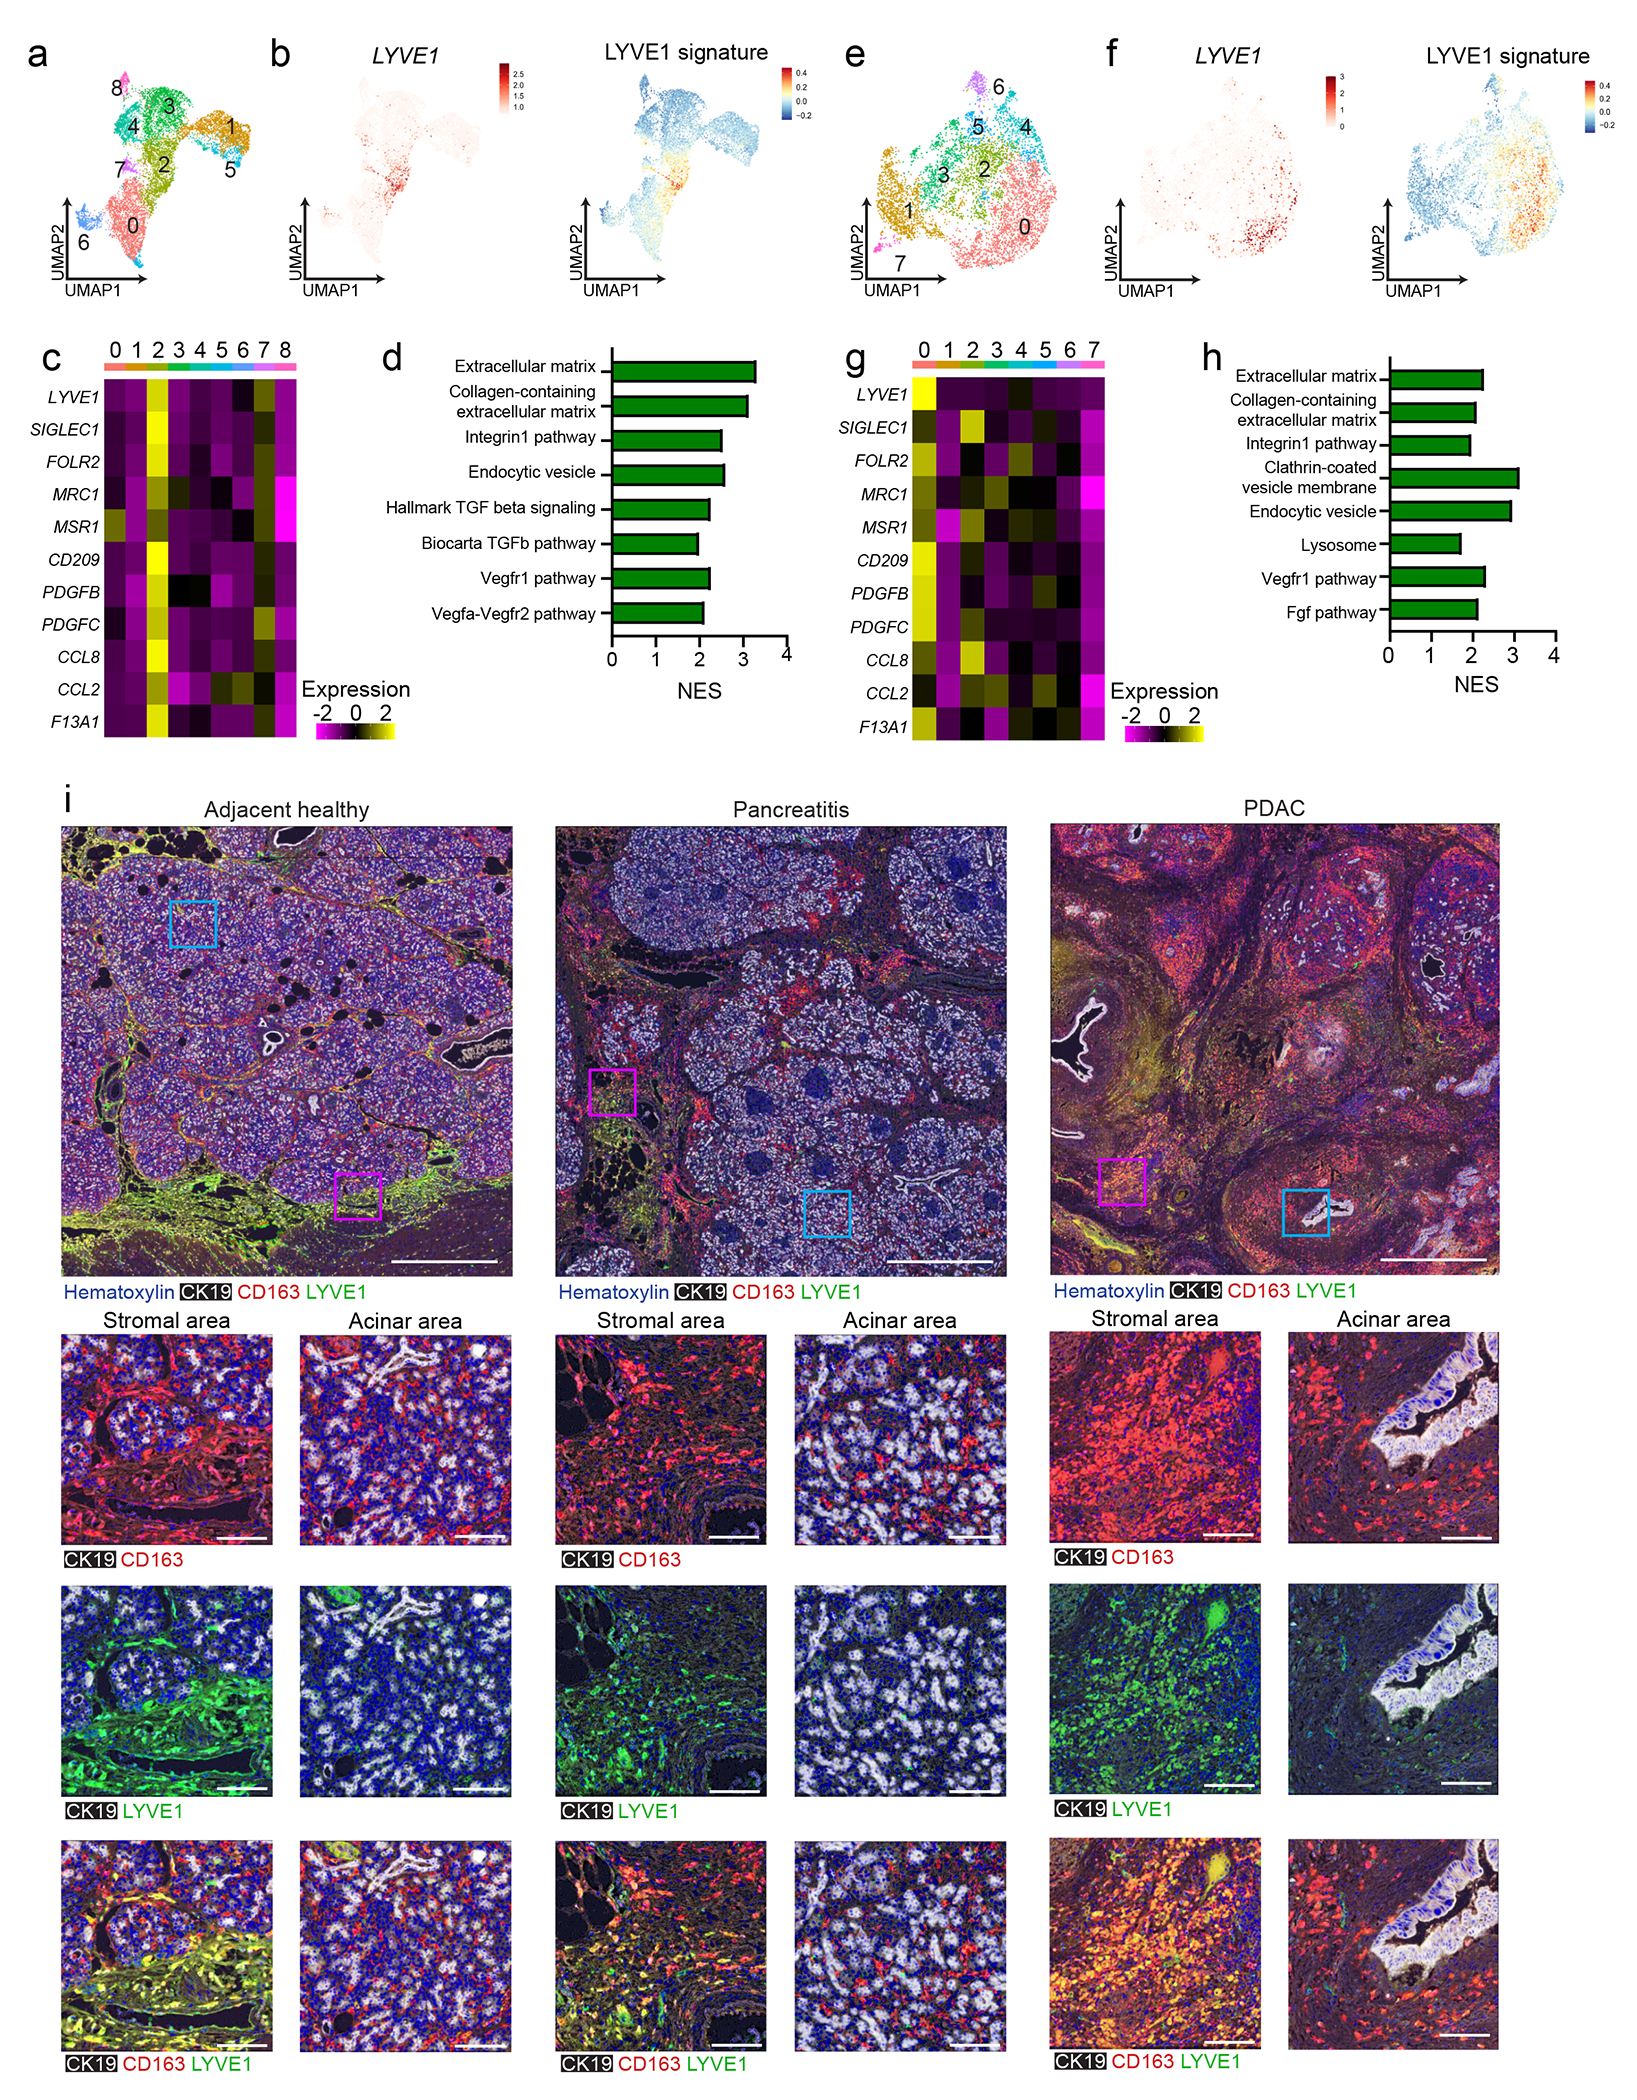
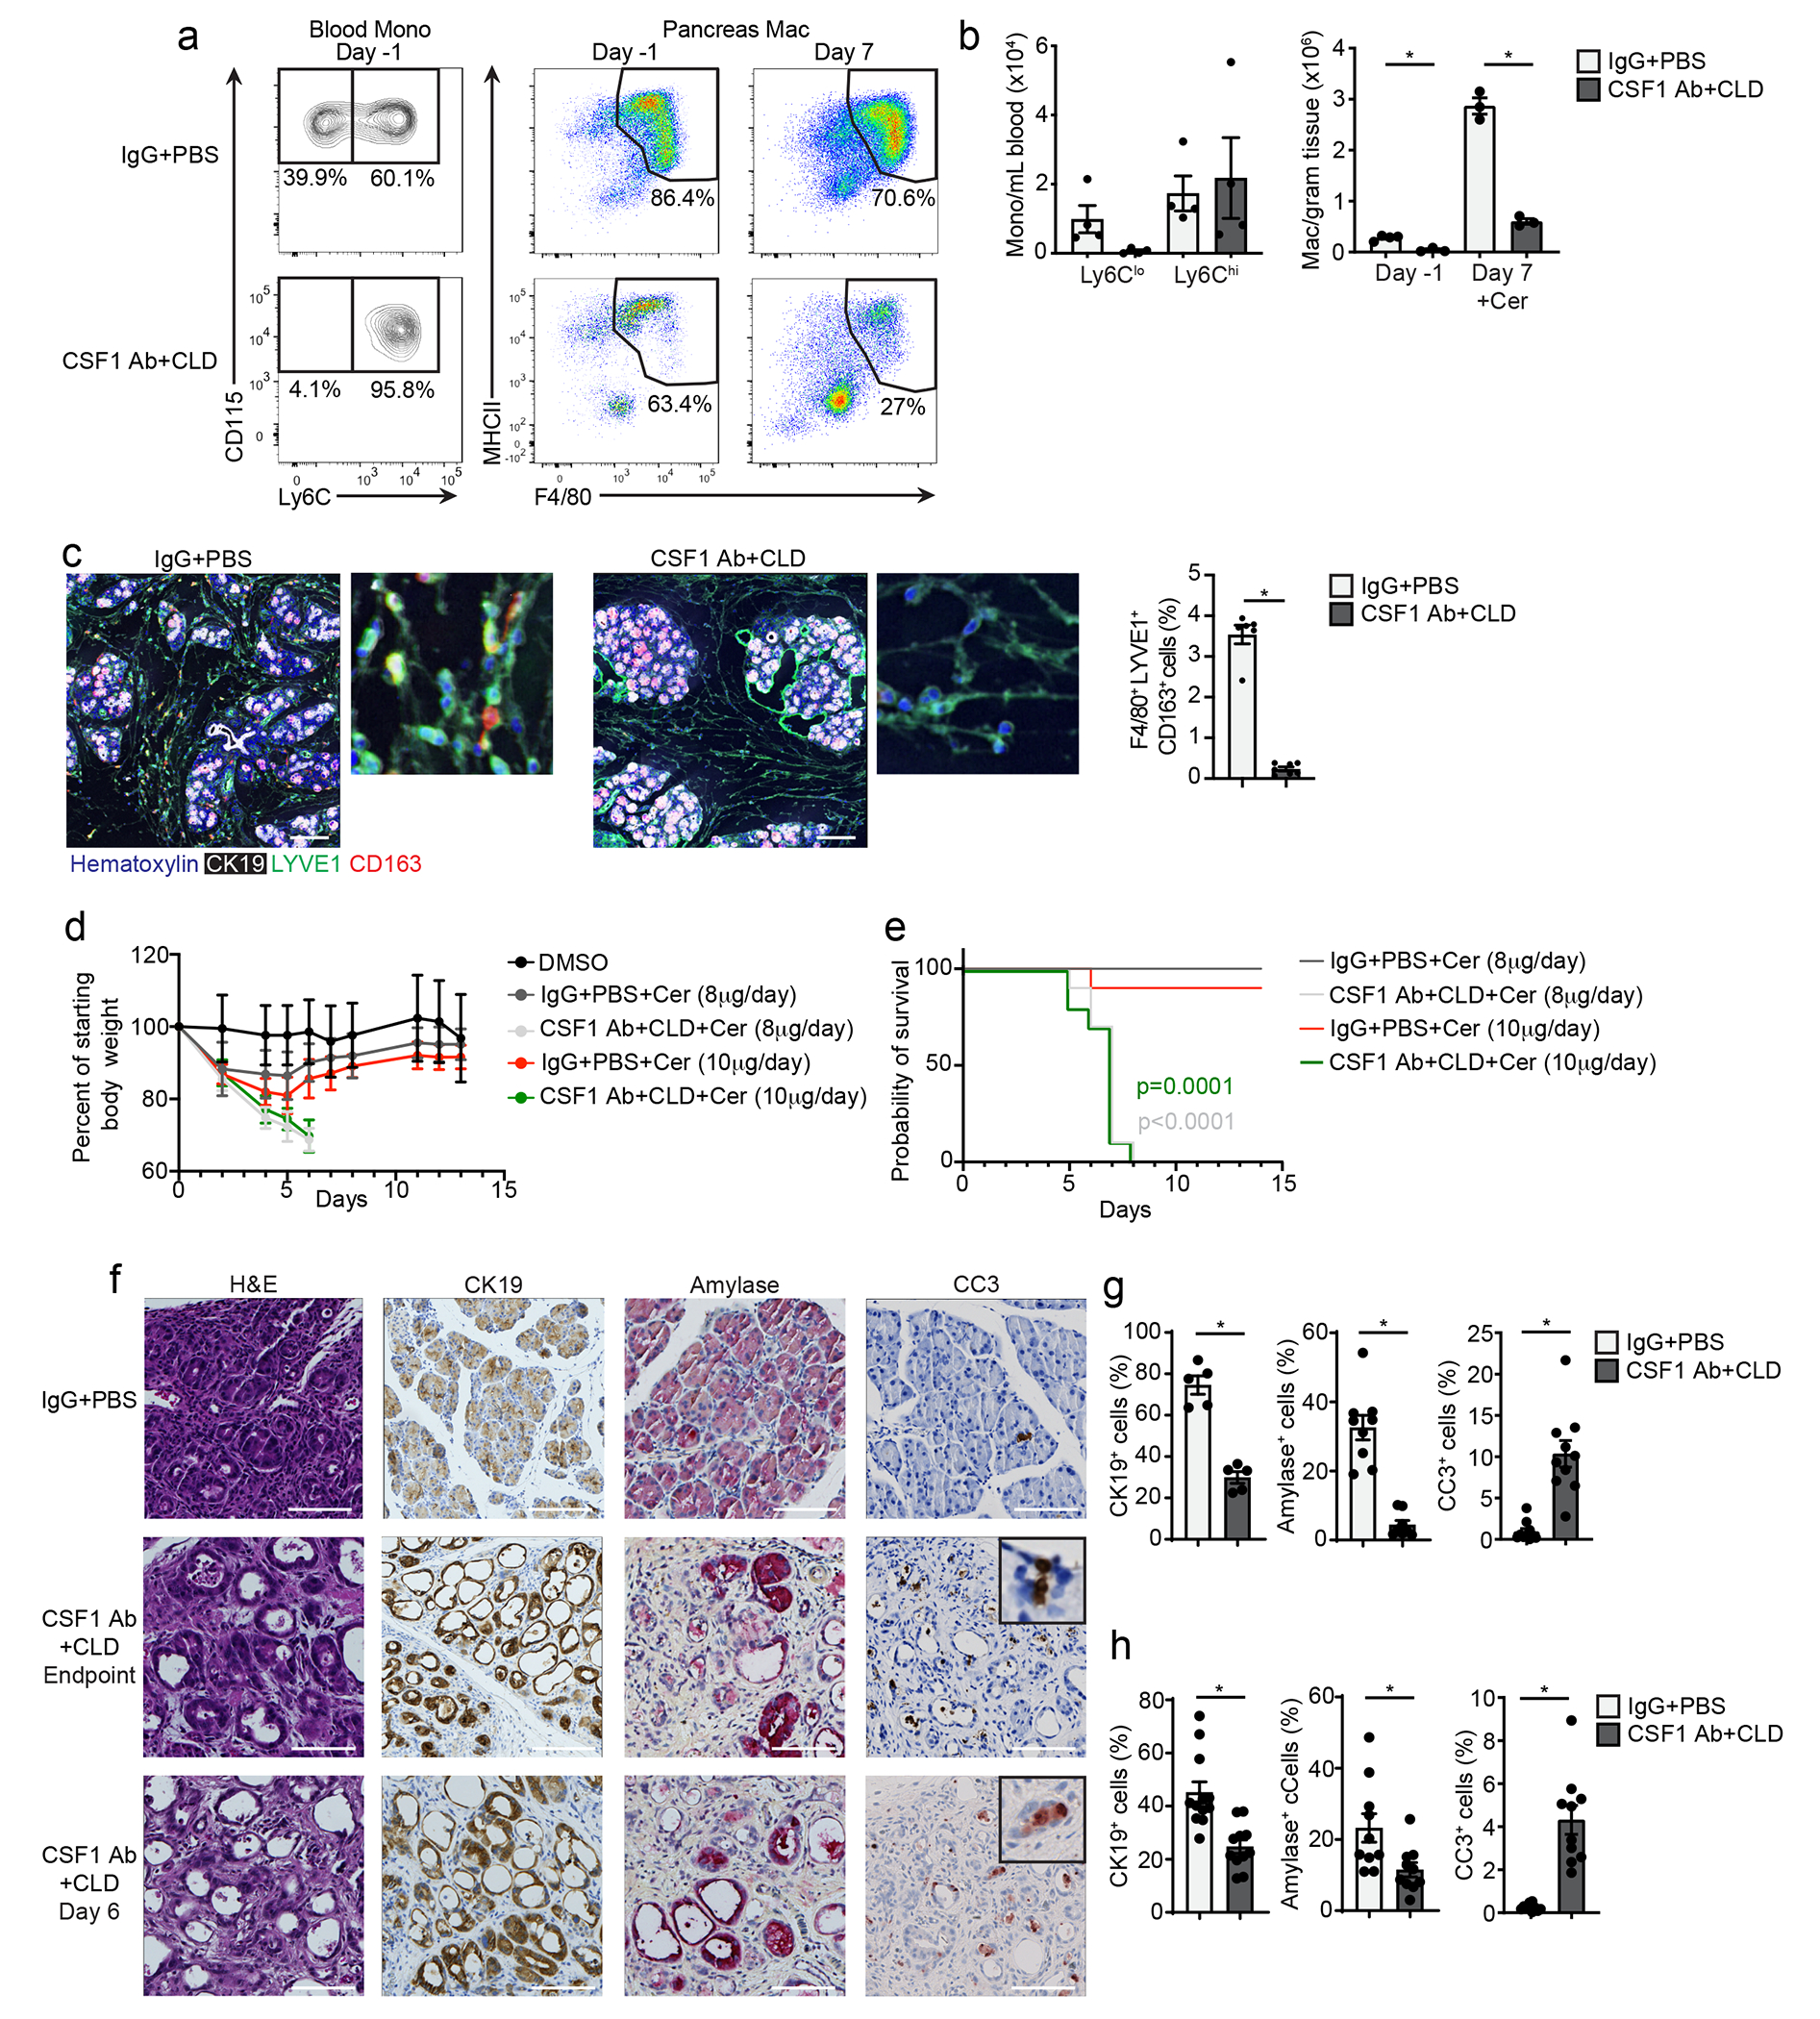
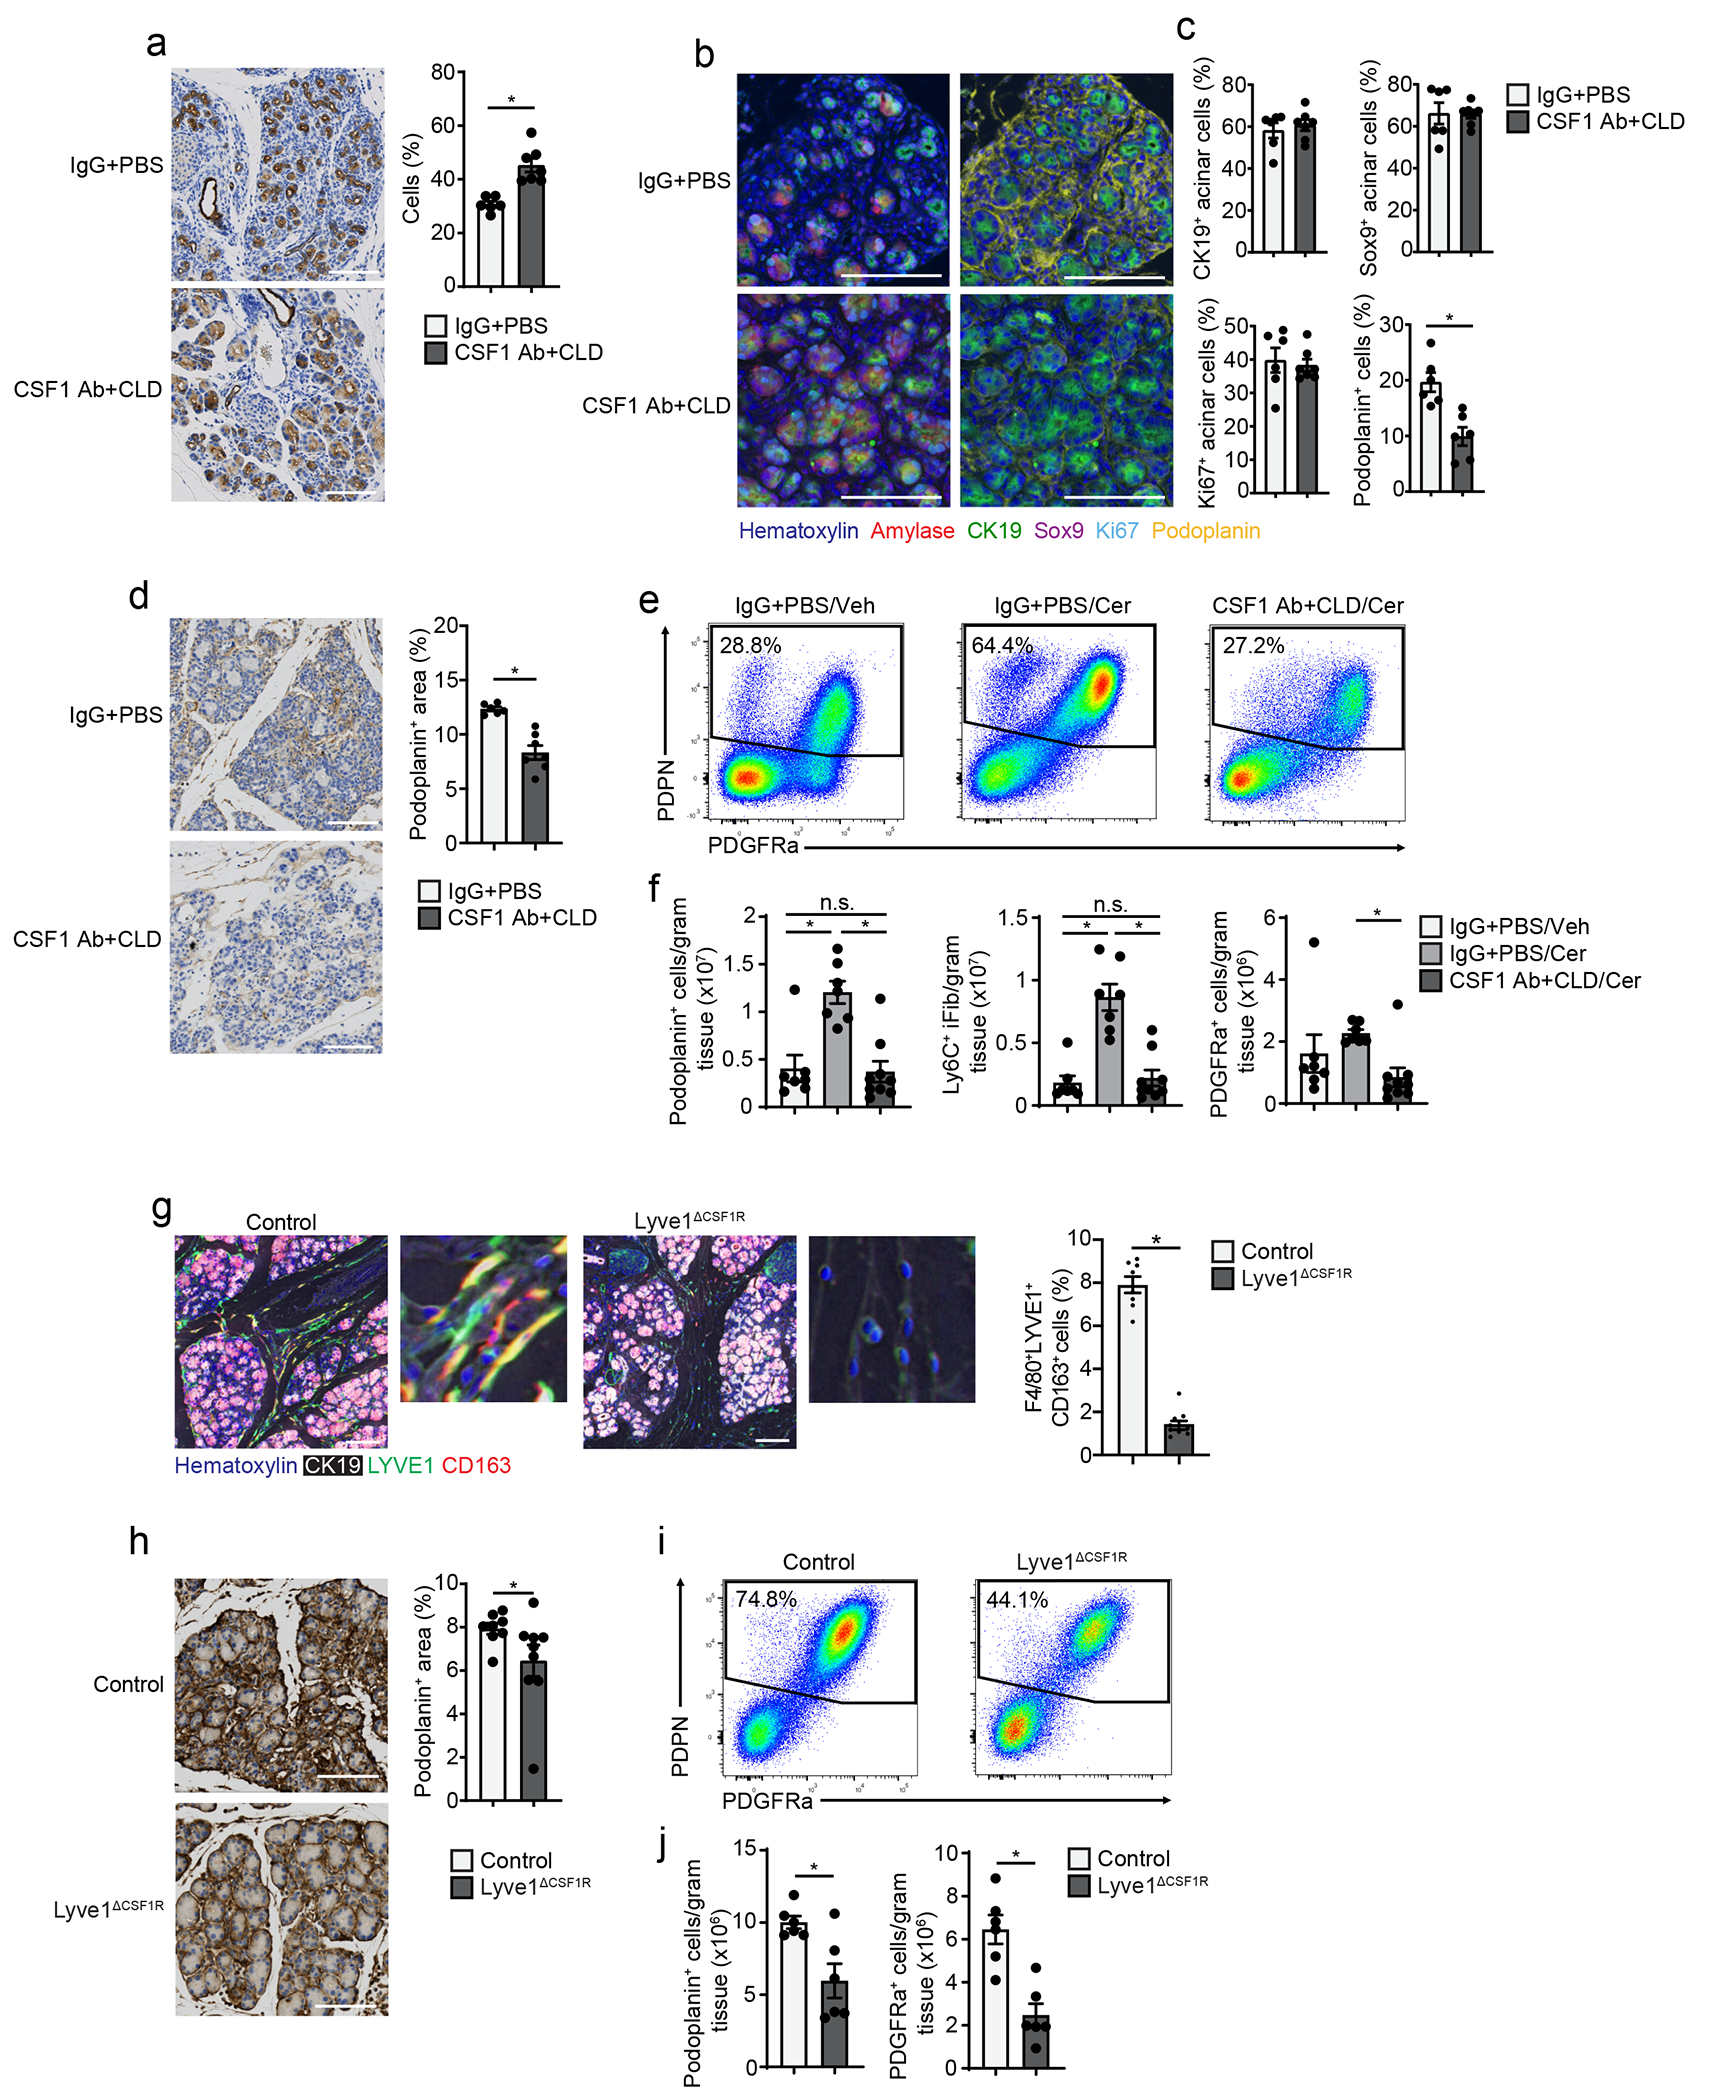
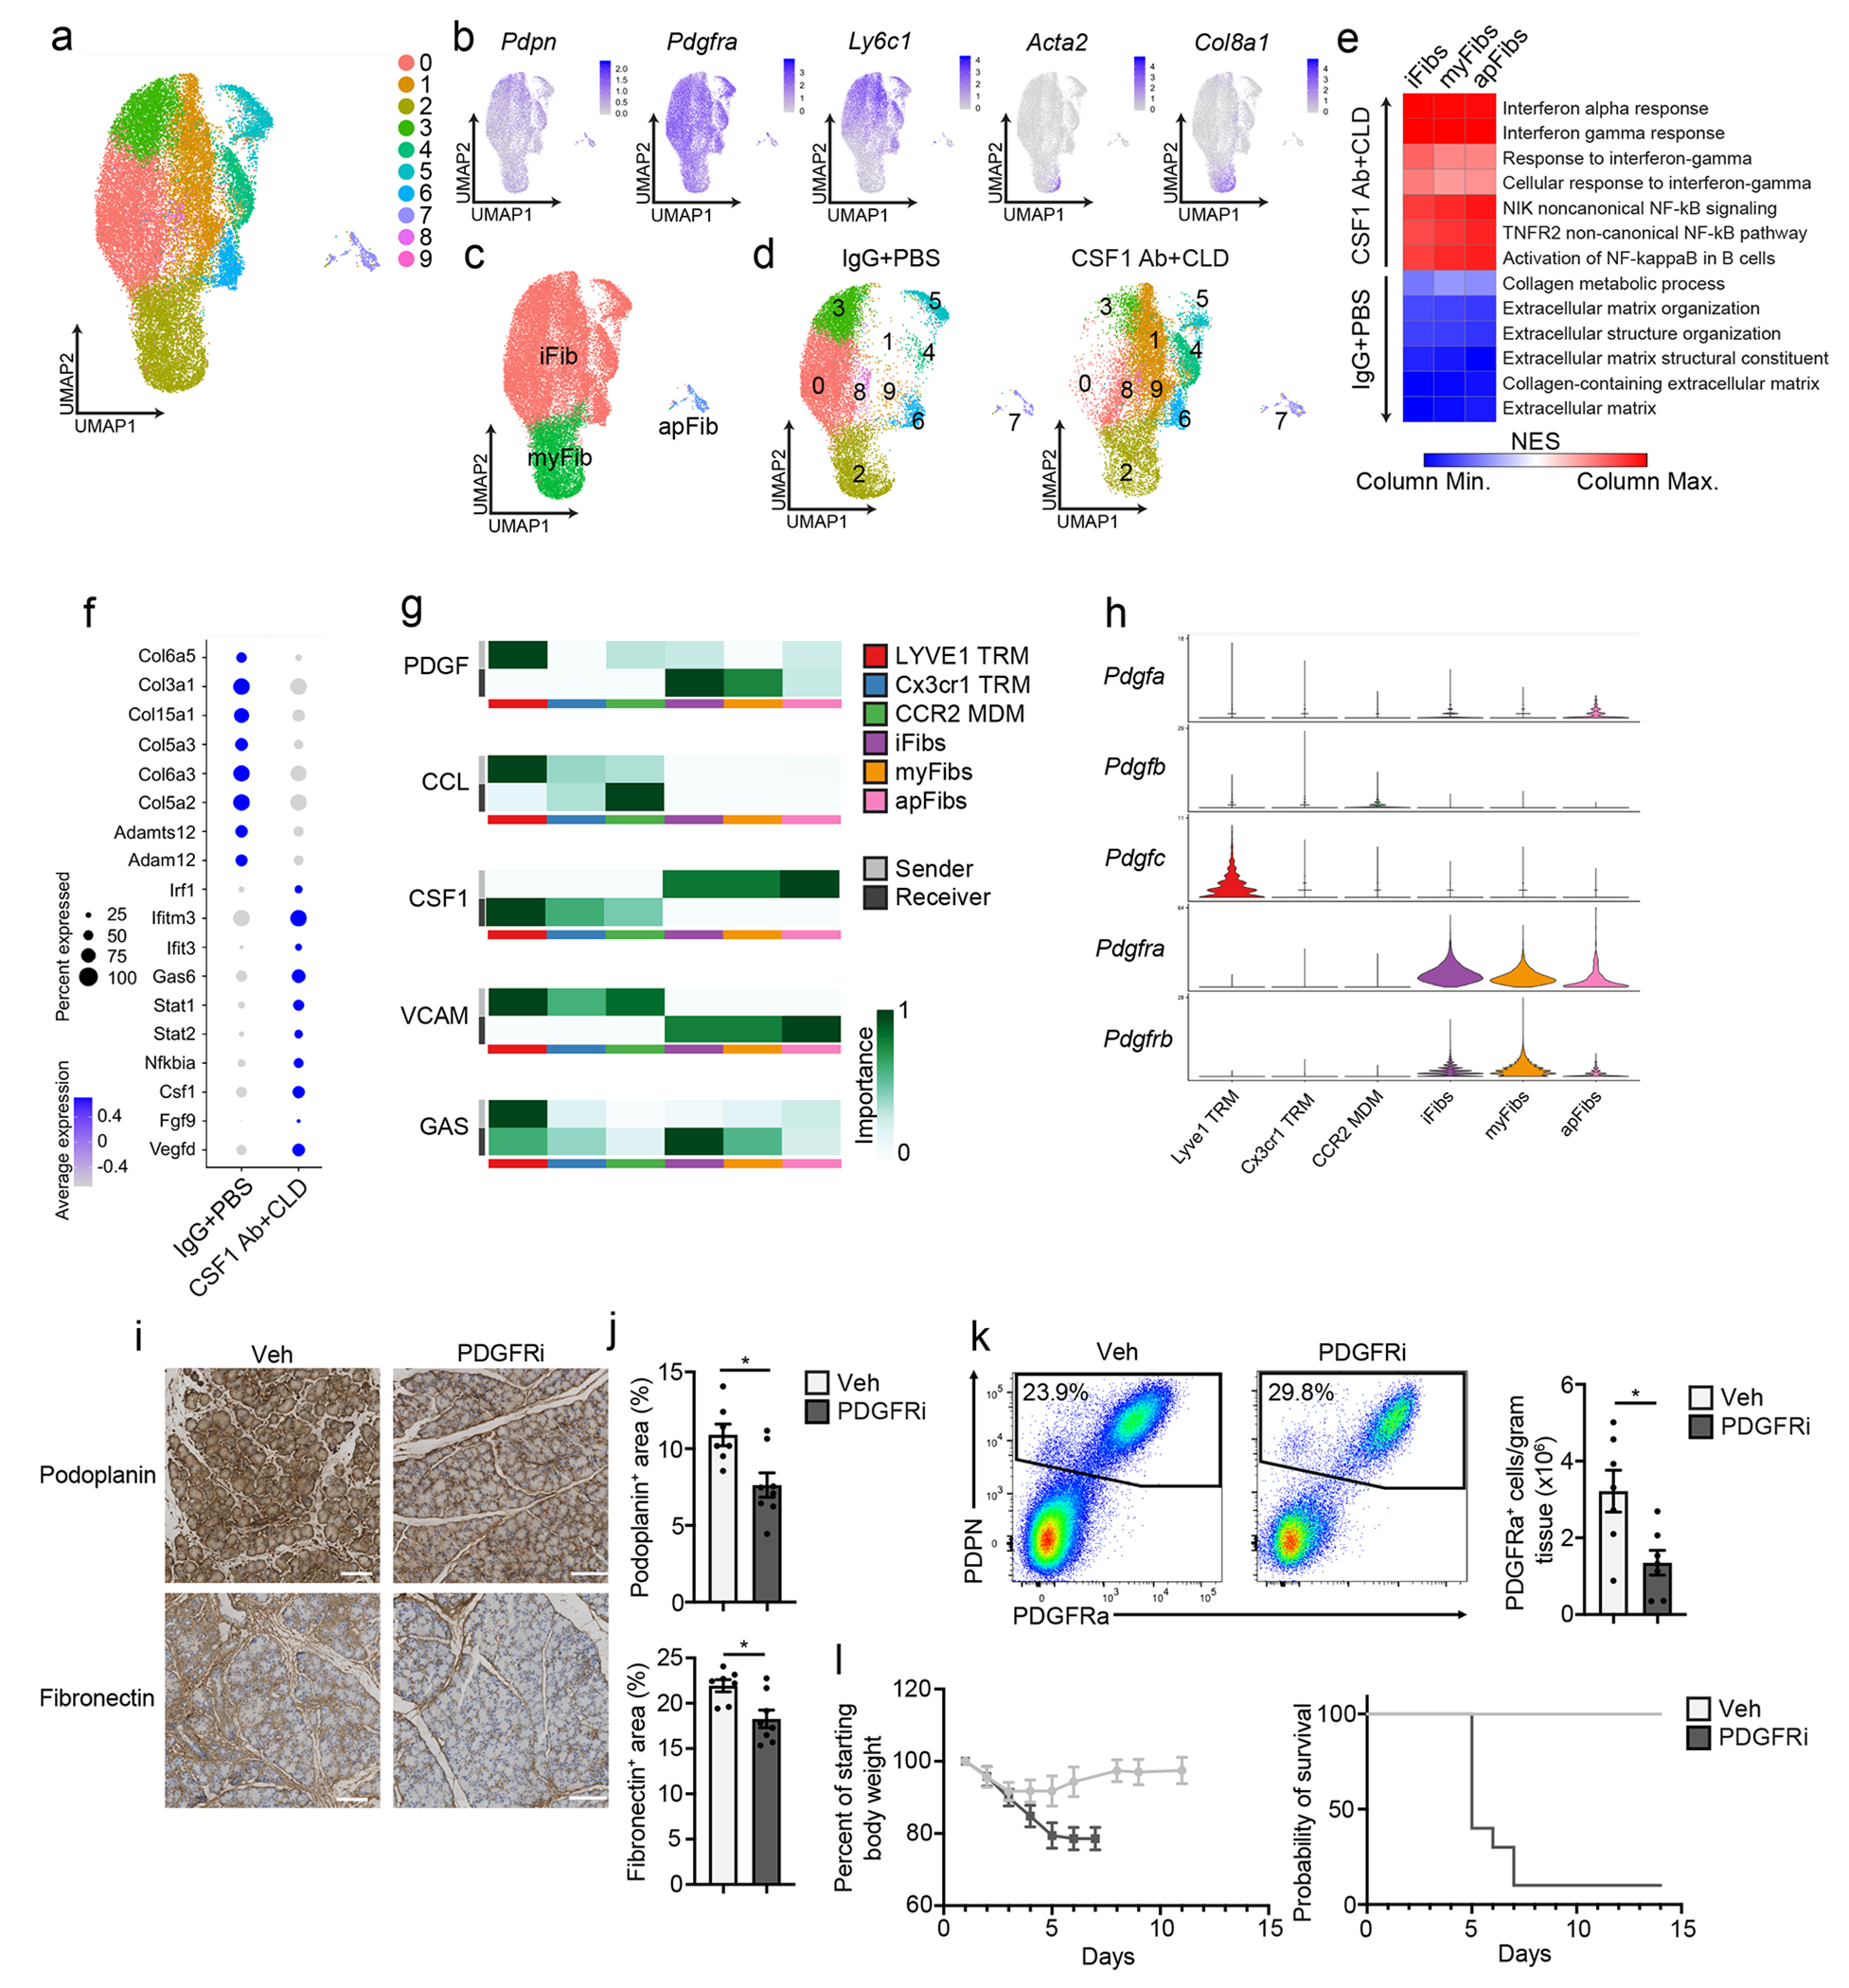
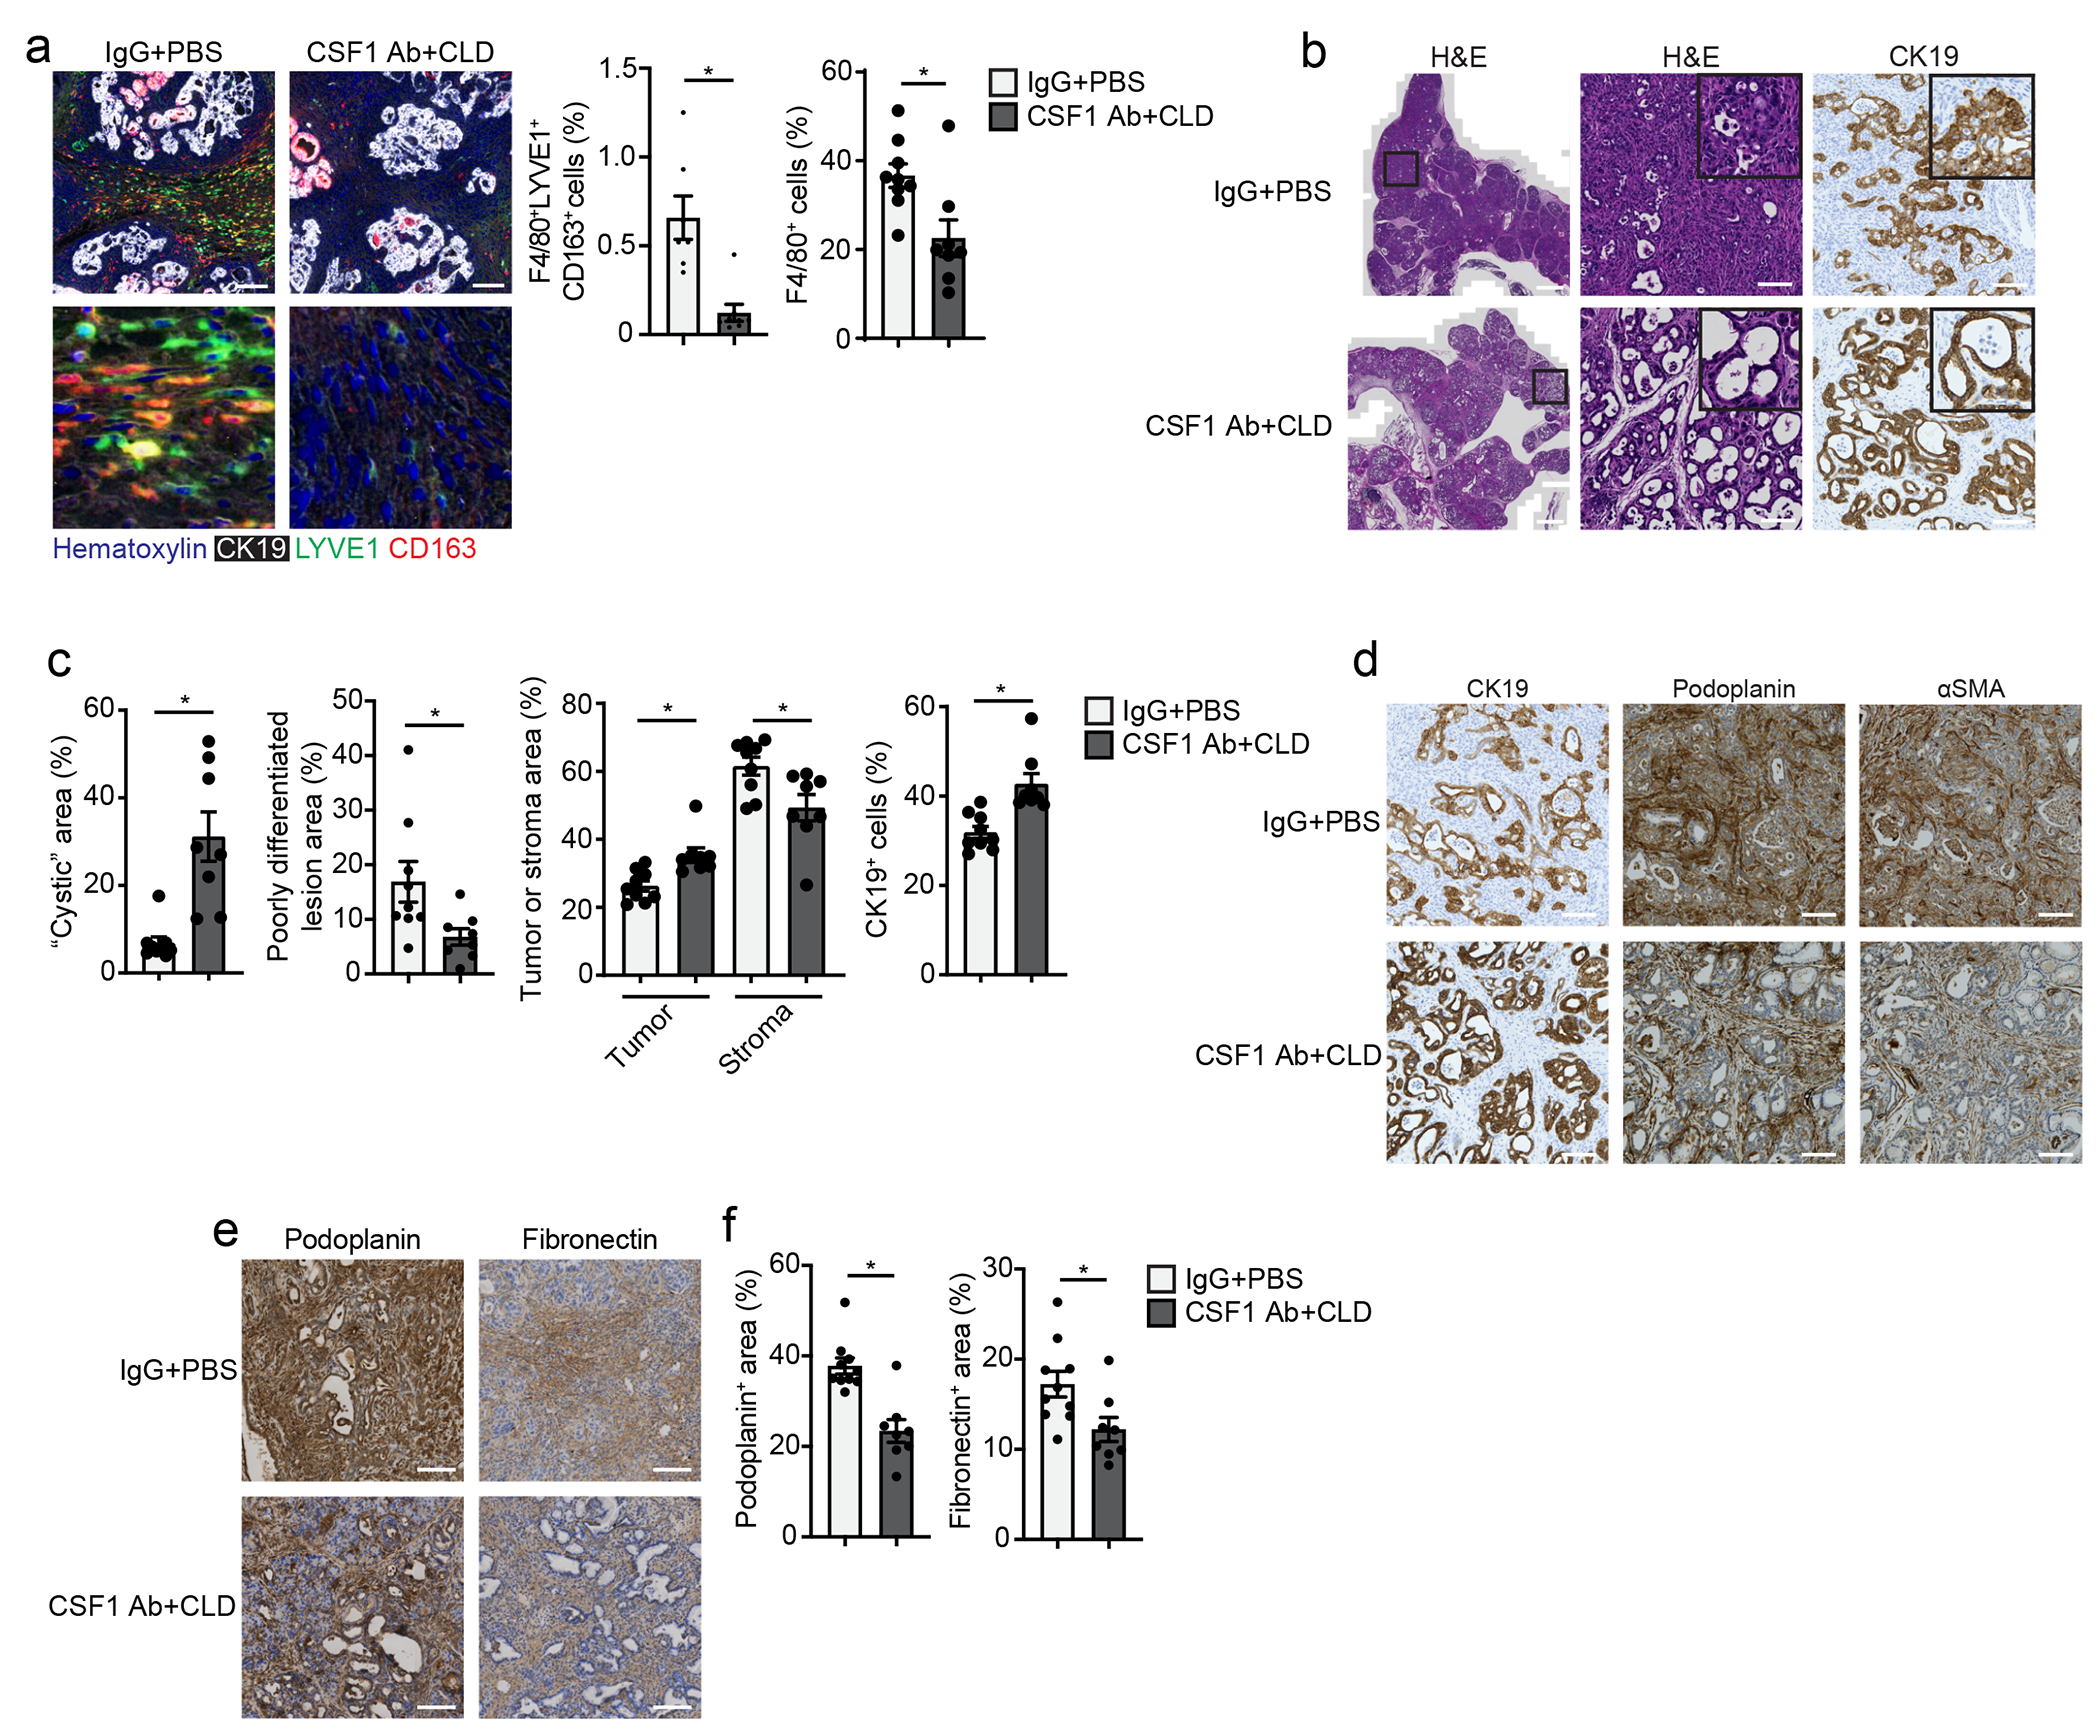
Tissue-resident macrophages (TRMs) are long-lived cells that maintain locally and can be phenotypically distinct from monocyte-derived macrophages. Whether TRMs and monocyte-derived macrophages have district roles under differing pathologies is not understood. Here, we showed that a substantial portion of the macrophages that accumulated during pancreatitis and pancreatic cancer in mice had expanded from TRMs. Pancreas TRMs had an extracellular matrix remodeling phenotype that was important for maintaining tissue homeostasis during inflammation. Loss of TRMs led to exacerbation of severe pancreatitis and death, due to impaired acinar cell survival and recovery. During pancreatitis, TRMs elicited protective effects by triggering the accumulation and activation of fibroblasts, which was necessary for initiating fibrosis as a wound healing response. The same TRM-driven fibrosis, however, drove pancreas cancer pathogenesis and progression. Together, these findings indicate that TRMs play divergent roles in the pathogenesis of pancreatitis and cancer through regulation of stromagenesis.


Conflict of interest statement

Competing Interests

Authors declare no competing interests.

Figures

Extended Data Figure 1:
a. Representative immunohistochemistry images and quantification of Ki67 staining in pancreas tissue of vehicle and cerulein treated mice as in a; n=4 mice/group, *P=0.0079. b. Flow cytometry plots of gating strategy used for pancreas F4/80+MHCIIhi/lo macrophages. c. Density of F4/80loMHCII eosinophils, Ly6G+ granulocytes, and Ly6C+ monocytes in pancreas of mice treated with vehicle or cerulein by 6 hourly i.p. injections every other day for one week; n=4 mice/group, *P=0.0286 for eosinophil analysis, *P=0.0286 for granulocyte analysis, and *P=0.0286 for monocyte analysis. Data are presented as mean ± SEM unless otherwise indicated. n.s., not significant; *p <0.05. For comparisons between two groups, Student’s two-tailed t-test was used.
Extended Data Figure 2:
a. Flow cytometry of Flt3-YFP+/− cells pre-gated on blood Ly6Clo/hi monocytes. b. Flow cytometry of CSF1R-tdTom mice given tamoxifen by oral-gavage for five consecutive days, then tamoxifen was stopped for 10 weeks, pre-gated on Ly6Chi/lo blood monocytes. c. Quantification of tdTomato+ Ly6Chi/lo blood monocytes after treatment as in b, displayed as percentage of each cell type; n=8mice/group. d. Schematic of tamoxifen treatment in CX3CR1-CreERT2;LSL-tdTomato mice (hereafter CX3CR1-tdTom mice). e. Flow cytometry of tdTomato−/+ cells in CX3CR1-tdTom mice treated as in d followed by vehicle or cerulein by 6 hourly i.p. injections every other day for one week, pre-gated on Ly6Chi/lo blood monocytes, and F4/80+MHCIIhi/lo pancreas macrophages. f. Representative images of IHC staining of tdTomato in pancreas tissue of CX3CR1-tdTom mice treated as in e, scale bars, 100μM. g. Quantification of tdTomato+ cells from pancreas tissue of CX3CR1-tdTom mice treated as in e, displayed as percentage of cells; n=4mice/group, *P=0.0286. h. Quantification of tdTomato+ blood Ly6Chi/lo monocytes from CX3CR1-tdTom mice treated as in e, displayed as percentage of each cell type; n=7mice/group. i. Density of tdTomato+ pancreas F4/80+MHCIIhi/lo macrophages from CX3CR1-tdTom mice treated as in e; vehicle, n=4 mice; cerulein, n=5 mice, *P=0.0159. j. Flow cytometry of GFP in CX3CR1-GFP mice, pre-gated on Ly6Chi/lo blood monocytes, and pancreas F4/80+MHCIIhi/lo macrophages. k. Quantification of GFP+ blood Ly6Chi/lo monocytes and pancreas F4/80+MHCIIhi/lo pancreas macrophages from CX3CR1-GFP mice, displayed as percentage of each cell type; n=3mice/group. l. Representative images of IHC staining of pancreas tissue from CX3CR1-tdTom mice treated as in e and stained for F4/80, tdTomato, and LYVE1, islets of Langerhans outlined in yellow, scale bars, 100μM, staining was repeated for 8 mice. m. Representative images of multiplex-IHC (mIHC) staining of pancreas tissue from CSF1R-tdTom mice treated with tamoxifen as in b, followed by cerulein treatment as in e, and stained for LYVE1, tdTomato, and F4/80, islet of Langerhans outlined in yellow dash, scale bars, 100μM, staining was repeated for 4 vehicle- and 4 cerulein-treated mice. Data are presented as mean ± SEM unless otherwise indicated. n.s., not significant; *p <0.05. For comparisons between two groups, Student’s two-tailed t-test was used.
Extended Data Figure 3:
a. Heatmap displaying DEGs in bulk RNAseq data upregulated in Flt3-YFP+ or Flt3-YFP pancreas macrophages from mice treated with 6 hourly i.p. injections every other day for one week of vehicle (healthy), cerulein (pancreatitis), or orthotopically implanted with the KP1 pancreatic cancer cell line (PDAC). b. Heatmap displaying normalized enrichment score (NES) of significantly enriched gene sets in bulk RNAseq data upregulated in Flt3-YFP+ or Flt3-YFP pancreas macrophages of mice treated as in a, pathways selected by FDR < 0.05. c. Venn diagram of overlap in number of DEGs upregulated in Flt3-YFP+ or Flt3-YFP pancreas macrophages from mice treated as in a. d. UMAP plot displaying Clec4f expression in F4/80+MHCIIhi/lo macrophages sorted from livers of Flt3-YFP mice 14 days after implantation with the KP2 pancreatic cancer cell line, and UMAP plot displaying Siglecf expression in CD11bint/hiCD11cint/hiF4/80+ macrophages from lungs of Flt3-YFP mice 15 days after i.v. injection of the KPL86 lung cancer cell line. e. UMAP plot from scRNAseq analysis of CD11bint/hiCD11cint/hiF4/80+ macrophages sorted from Flt3-YFP lungs implanted with KPL86 lung cancer cell line as in a. f. Quantification of Flt3-YFP+ and Flt3-YFP lung macrophages by cluster from UMAP in e, displayed as percentage of each cluster.
Extended Data Figure 4:
a. UMAP plot of scRNAseq analysis of F4/80+MHCIIhi/lo macrophages sorted from pancreas of Flt3-YFP mice treated with vehicle by 6 hourly i.p. injections every other day for one week. b. Quantification of Flt3-YFP+ and Flt3-YFP pancreas macrophages by cluster from UMAP in a, displayed as percentage of each cluster. c. UMAP plot of scRNAseq analysis of F4/80+MHCIIhi/lo macrophages sorted from pancreas of Flt3-YFP mice orthotopically implanted with the KP1 pancreatic cancer cell line. d. Quantification of Flt3-YFP+ and Flt3-YFP pancreas macrophages by cluster from UMAP in c, displayed as percentage of each cluster. e. UMAP plots displaying Timd4, Trem2, Folr2, H2-Aa, Cd74, and Cd14 expression in Csf1r and C1qa expressing pancreas macrophages from Flt3-YFP mice treated with cerulein by 6 hourly i.p. injections every other day for one week. f. Violin plots displaying expression of Lyve1 and Cx3cr1 for each cluster of Csf1r and C1qa expressing pancreas macrophages from Flt3-YFP mice treated with cerulein as in a. g. UMAP plots displaying Lyve1, Cx3cr1, and Ccr2 expression in F4/80+MHCIIhi/lo macrophages sorted from pancreas of Flt3-YFP mice treated as in a. h. UMAP plots displaying Lyve1, Cx3cr1, and Ccr2 expression in F4/80+MHCIIhi/lo macrophages sorted from pancreas of Flt3-YFP mice implanted with tumors as in c. i. Bar graph of normalized enrichment score (NES) values of gene sets upregulated in Flt3-YFP+ or Flt3-YFP pancreas macrophages within pancreatitis cluster 0 (from Fig. 3c). Data are presented as mean ± SEM unless otherwise indicated. n.s., not significant; *p <0.05. For comparisons between two groups, Student’s two-tailed t-test was used, except i where FDR was used.
Extended Data Figure 5:
a. UMAP plots displaying Lyve1, Cx3cr1, Trem2, Ccr2, Mrc1, H2-Ab1, H2-Aa, Cd163, Folr2, and Timd4 expression in Csf1r and C1qa expressing pancreas macrophages from CSF1R- tdTom mice given tamoxifen by oral gavage for five consecutive days, then tamoxifen was stopped for 10 weeks, then cerulein (cer) was given by 6 hourly i.p. injections every other day for one week. b. Bar graph of NES values of gene sets upregulated in tdTomato+ or tdTomato cells from CSF1R-tdTom mice treated as in a. c. Quantification of LYVE1+F4/80+tdTomato+ pancreas macrophages from CSF1R-tdTom mice treated with tamoxifen as in a, followed by vehicle (veh) or cerulein (cer) treatment as in a, displayed as percentage of LYVE1+F4/80+ macrophages; n=4 mice/group. d. Schematic of surgical joining of parabiotic pairs of CD45.1+ and CD45.2+ C57BL/6 mice. e. Flow cytometry staining of CD45.1 and CD45.2 in parabiotic pairs of mice, following 6 weeks of surgical joining, pre-gated on blood Ly6C+ monocytes or F4/80+MHCIIhi/lo pancreas macrophages. f. Quantification of percent chimerism (left) and chimerism normalized to blood Ly6Chi monocyte chimerism (relative chimerism, right) for blood Ly6Chi monocytes, LYVE1+CD163+ pancreas macrophages, LYVE1+CD163+ pancreas macrophages, and MHCIIhi pancreas macrophages; n=4 mice/group, *P=0.0286 for chimerism analysis and *P=0.0286 for relative chimerism analysis. Data are presented as mean ± SEM unless otherwise indicated. n.s., not significant; *p <0.05. For comparisons between two groups, Student’s two-tailed t-test was used, except b where FDR was used.
Extended Data Figure 6:
a. UMAP plot displaying mouse LYVE1lo pancreas macrophage scRNA-seq signature using top 100 DEGs from mouse LYVE1lo macrophages mapped into human chronic pancreatitis data set. b. UMAP plot displaying mouse LYVE1lo pancreas macrophage scRNA-seq signature using top 100 DEGs from mouse LYVE1lo macrophages mapped into published human PDAC data set. c. UMAP plots displaying CD163, LYVE1, CSF1R, and CD68 expression in human healthy and chronic pancreatitis samples from a, and violin plot showing CD163 gene expression across human pancreatitis macrophage clusters. d. UMAP plots displaying Cd163, Lyve1, Csf1r, and Cd68 expression in scRNA-seq of F4/80+MHCIIhi/lo macrophages sorted from the pancreas of Flt3-YFP mice treated with cerulein by 6 hourly i.p. injections every other day for one week, and violin plot showing Cd163 gene expression across same dataset of mouse pancreas macrophage clusters. e. UMAP plots displaying CD163, LYVE1, CSF1R, and CD68 expression in macrophages from human PDAC data set as in b, and violin plot showing CD163 gene expression across human PDAC macrophage clusters. f. UMAP plots displaying Cd163, Lyve1, Csf1r, and Cd68 expression in mouse F4/80+MHCIIhi/lo macrophages sorted from pancreas of Flt3-YFP mice orthotopically implanted with the KP1 pancreatic cancer cell line, and violin plot showing Cd163 gene expression across same dataset of mouse PDAC macrophage clusters.
Extended Data Figure 7:
a. Flow cytometry of pancreas F4/80+MHCIIhi/lo macrophages after treatment with CSF1Ab+CLD or IgG+PBS, then a 10-day recovery period (day −1), then cerulein (cer) treatment by 6 hourly i.p. injections every other day for one week (day 7). b. Density of MHCIIhi pancreas macrophages from mice treated as in a; day −1, n=4mice/group; day 7, n=3mice/group. c. Density of MHCIIlo pancreas macrophages from mice treated as in a; day −1, n=4mice/group; day 7, n=3mice/group, left to right *P=0.0002 and *P=0.0002. d. Kaplan-Meier survival curve and body weight measurement of C57BL/6 mice treated with IgG+PBS or CSF1Ab+CLD as in a, followed by cerulein-loaded osmotic pump (10μg/day cerulein) implantation; IgG+PBS, n=10mice; CSF1 Ab+CLD, n=6mice, *P<0.0001 in survival analysis. e. Relative pancreas weight in C57BL/6 mice treated as in d; IgG+PBS, n=10mice, CSF1Ab+CLD, n=4mice, *P<0.0020. f. IHC images of H&E and amylase stain in pancreas from mice implanted with DMSO-loaded osmotic pump, cerulein treatment as in a, or cerulein-loaded osmotic pump, scale bars, 100μM. g. Blood glucose concentration at humane survival endpoint in mice treated as in d; IgG+PBS, n=7mice; CSF1Ab+CLD, n=6mice, *P=0.0012. h. Serum amylase level in mice treated as in f; left to right n=4mice, n=6mice, and n=6mice, and *P=0.0381 and *P=0.0390. i. H&E-stained liver from mice treated as in f, scale bars, 100μM. j. Blood Ly6Clo and Ly6Chi monocytes, and pancreas F4/80+, F4/80+MHCIIhi, and F4/80+MHCIIlo macrophages, and flow cytometry of F4/80+MHCIIhi/lo pancreas macrophages in CCR2-WT and CCR2-KO mice treated with cerulein by i.p. injection as in a; n=4 mice/group and *P=0.0286 in blood Ly6Clo and Ly6Chi analysis, n=7 mice in veh CCR2-WT group, n=5 mice in veh CCR2-KO group, n=8 mice in cer CCR2-WT group, and n=6 in cer CCR2-KO group in F4/80+, F4/80+MHCIIhi, and F4/80+MHCIIlo analyses, and *P=0.0047 in F4/80+MHCIIhi macrophage analysis. k. Kaplan-Meier survival curve and body weight measurement of CCR2-WT and CCR2-KO mice implanted with cerulein-loaded osmotic pumps, as in d; n=8 mice in CCR2-WT group, n=10 mice in CCR2-KO group. Data are presented as mean ± SEM unless otherwise indicated. n.s., not significant; *p <0.05. For comparisons between two groups, Student’s two-tailed t-test was used.
Extended Data Figure 8:
a. IHC staining and quantification for podoplanin and fibronectin on pancreas tissue from mice treated with CSF1Ab+CLD or IgG+PBS, then a 10-day recovery period, then cerulein (cer) treatment by 6 hourly i.p. injections every other day for 3, 7, or 17 days, scale bars, 100μM, IgG+PBS, CSF1Ab+CLD day 3, and IgG+PBS day 7, n=6mice; CSF1Ab+CLD day 7, n=7mice; IgG+PBS day 17, n=5mice; CSF1Ab+CLD day 17, n=8mice; podoplanin left to right, *P=0.0022, *P=0.0012, and *P=0.0016; fibronectin left to right, *P=0.0130 and *P=0.0007. b. H&E and podoplanin stained pancreas tissue from mice treated as in a, with no cerulein treatment, scale bars, 100μM. c. Podoplanin IHC quantification on pancreas tissue of mice treated as in b; IgG+PBS, n=7mice; CSF1Ab+CLD, n=8mice. d. Flow cytometry gating for pancreas fibroblast subsets. e. Density of pancreas PDGFRα, α-SMA+, and MHCII+ fibroblasts from mice treated with IgG+PBS followed by vehicle (steady-state), IgG+PBS followed by cerulein (IgG+PBS+Cer), and CSF1Ab+CLD followed by cerulein (CSF1 AB+CLD+Cer) as in a; steady-state and IgG+PBS+Cer, n=7mice, and CSF1Ab+CLD+Cer, n=9mice. f. Density of pancreas F4/80+MHCIIhi/lo, LYVE1+CD163+, LYVE1CD163+, LYVE1CD163 macrophages, and Ly6C+ iFibs in Lyve1-Cre littermate controls (control), or Lyve1ΔCSF1R mice treated with cerulein by i.p. injections every other day for one week; control, n=5mice; Lyve1ΔCSF1R, n=4mice; LYVE1+CD163+, *P=0.0159, and Ly6C+ iFib, n=6mice/group. g. Mouse body weight measurement and Kaplan-Meier survival curve following implantation of osmotic pump for delivery of 10μg/day cerulein in control or Lyve1ΔCSF1R mice; n=9 mice in control and n=8 mice in Lyve1ΔCSF1R group. h. Podoplanin and fibronectin IHC staining on pancreas tissue of CCR2-WT and CCR2-KO mice treated with cerulein as in f; scale bars, 100μM. i. Quantification of podoplanin and fibronectin IHC stains and density of podoplanin+ fibroblasts, Ly6C+ iFibs, and PDGFRα+ fibroblasts in pancreas tissue of CCR2-WT and CCR2-KO mice treated with cerulein as in f; CCR2-WT, n=8mice; CCR2-KO, n=7mice for podoplanin and fibronectin IHC analyses, and CCR2-WT, n=8mice; CCR2-KO, n=6mice for fibroblast flow cytometry analyses. Data are presented as mean ± SEM unless otherwise indicated. n.s., not significant; *p <0.05. For comparisons between two groups, Student’s two-tailed t-test was used.
Extended Data Figure 9:
a. UMAP plot of scRNA-seq analysis of PDPN+ pancreas fibroblasts sorted from mice treated with IgG+PBS followed by vehicle (healthy), IgG+PBS followed by cerulein (IgG+PBS+Cer), and CSF1 Ab+CLD followed by cerulein (CSF1 Ab+CLD+Cer). b. UMAP plots displaying expression of Pdgfra, Ly6c1, and Col8a1 in PDPN+ fibroblasts from a. c. UMAP plot of pancreas PDPN+ fibroblasts separated by healthy, IgG+PBS+Cer, or CSF1 Ab+CLD+Cer samples as in a. d. Violin plot of Col3a1, Col6a5, and Col6a6 expression across samples (healthy, IgG+PBS+Cer, or CSF1 Ab+CLD+Cer); for all comparisons *P<0.0001. e. UMAP plot of scRNA-seq analysis combining macrophages from Flt3-YFP mice treated with cerulein and fibroblasts from IgG+PBS+Cer and CSF1 Ab+CLD+Cer treated mice. f. UMAP plots displaying Csf1r, Pdgfra, Lyve1, and Cx3cr1 expression in combined macrophage and fibroblast scRNA-seq analysis from e. g. Dot plot showing aggregate score of all incoming (receptor) and outgoing (ligand) interactions summarized for each macrophage and fibroblast cluster from e, as measured by CellChat. h. Heatmap displaying relative strength of network centrality measures for outgoing (ligands, left heatmap) and incoming (receptors, right heatmap) signaling patterns of each intercellular signaling pathway. i. Heatmap displaying aggregate score across all differentially enriched receptor (receiver) or ligand (sender) pathways between macrophage and fibroblast clusters from e. j. Density of pancreas F4/80+MHCIIhi/lo, LYVE1+CD163+, and LYVE1CD163 macrophages from mice treated with vehicle (veh) or PDGFRi once per day by i.p. injection along with cerulein treatment by 6 hourly i.p. injections every other day for one week; n=7 mice in vehicle and n=8 mice in PDGFRi groups. Data are presented as mean ± SEM unless otherwise indicated. n.s., not significant; *p <0.05. For comparisons between two groups, Student’s two-tailed t-test was used, except for d where Bonferroni correction was used.
Extended Data Figure 10:
a. Genetic loci for p48-Cre;LSL-KRASG12D;p53fl/+ (KPC) model and treatment scheme for IgG+PBS and CSF1 Ab+CLD followed by cerulein by 6 hourly i.p injections every other day for 5 days. b. Genetic loci for p48-Cre;ROSA26-rtTa-IRES-EGFP;TetO-KRASG12D (iKRAS*) model and treatment scheme for IgG+PBS and CSF1 Ab+CLD followed by cerulein by 6 hourly i.p injections on two consecutive days, followed by doxycycline administration in drinking water. c. Representative mIHC images of pancreas tissue from iKRAS* mice treated with IgG+PBS or CSF1 Ab+CLD as in b, stained for hematoxylin, CK19, F4/80, LYVE1, and CD163 (scale bars are 100μM), and quantification of F4/80+LYVE1+CD163+ macrophages, displayed as the percentage of cells; n=7 mice in IgG+PBS group, n=8 mice in CSF1 Ab+CLD group, and *P=0.0003. d. Representative images of pancreas tissue stained for H&E and CK19 from iKRAS* mice treated with IgG+PBS or CSF1 Ab+CLD as in b, scale bars are 100μM. e. Quantification of relative pancreas weight and CK19+ cells displayed as percentage of total cells from iKRAS* mice treated with IgG+PBS or CSF1 Ab+CLD as in b; n=7 mice in IgG+PBS group, n=10 mice in CSF1 Ab+CLD group, *P=0.0097 in relative pancreas weight analysis, and *P=0.0250 in CK19 analysis. f. Tumor weight and size measurements of CCR2-WT and CCR2-KO mice orthotopically implanted with the KP2 pancreatic cancer cell line; n=9 mice/group. g. Representative images and quantification of pancreas tissue from CCR2-WT and CCR2-KO mice orthotopically implanted with the KP2 pancreatic cancer cell line stained for podoplanin, scale bars are 100μM; n=9 mice/group. Data are presented as mean ± SEM unless otherwise indicated. n.s., not significant; *p <0.05. For comparisons between two groups, Student’s two-tailed t-test was used.
Figure 1:
Figure 1:. Pancreatitis and PDAC display immune rich fibrotic stroma.
a. Representative immunohistochemistry (IHC) images of H&E, CK17/19, CD163, trichrome and podoplanin stains on human adjacent healthy pancreas, pancreatitis and PDAC tissue. Scale bars are 100μM. b. Quantification of CD163, trichrome collagen or podoplanin staining in human adjacent healthy pancreas, pancreatitis and PDAC represented as percentage of cells or percentage of tissue area. Adjacent healthy, n=10; pancreatitis, n=10; PDAC, n=9. CD163 quantification top to bottom and left to right *P<0.0001, *P=0.0039, and *P=0.0051, trichrome quantification top to bottom and left to right *P=0.0232, *P=0.0115, and podoplanin quantification top to bottom and left to right *P=0.0010, *P=0.0433, and *P=0.0015) c. Representative IHC images of H&E, amylase, CK19, Sox9, podoplanin and F4/80 and flow cytometry of F4/80+MHCIIhi/lo macrophages in the pancreatic tissue from mice treated with vehicle (Veh) or cerulein (Cer) by 6-hourly i.p. injections every other day for one week. Scale bars are 100μM. d. Quantification of pancreas weight, IHC staining with amylase, CK19, Sox9, podoplanin and F4/80 and flow cytometry analysis of F4/80+MHCIIhi/lo macrophages in the mouse pancreas as in c; (pancreas weight, n = 5 mice/group and *P=0.0079; amylase, n = 3 mice/group and *P=0.0046; CK19, n = 3 mice/group and *P=0.0003; Sox9, n = 5 mice/group and *P=0.0079; podoplanin, n = 5 mice/group and *P=0.0079; F4/80, n = 5 mice/group and *P=0.0079; F4/80+MHCIIhi/lo macrophages, n = 4 mice/group and *P=0.0286. Data are presented as mean ± SEM. n.s., not significant; *p <0.05. For comparisons between two groups, Student’s two-tailed t-test was used.
Figure 2:
Figure 2:. Cerulein treatment increases tissue-resident macrophages.
a. Flow cytometry staining of Flt3-YFP+ and Flt3-YFP cells pre-gated on pancreas F4/80+MHCIIhi/lo macrophages in Flt3-Cre LSL-YFP (Flt3-YFP) mice. b. Density of Flt3-YFP+ and Flt3-YFP macrophages in the pancreas of Flt3-YFP mice after 6 hourly i.p. injections with Veh or Cer every other day for one week; n = 4 mice/group, left to right *P=0.0052 and *P=0.0077. c. Fold-change in the density of Flt3-YFP+ and Flt3-YFP macrophages in Veh or Cer-treated Flt3-YFP mice as in b; n = 4 mice/group, *P=0.0286. d. Percentage of Flt3-YFP+ and Flt3-YFP macrophages that expressed Ki-67 in Veh or Cer-treated Flt3-YFP mice as in b; n = 4 mice/group, *P=0.0251. e. Flow cytometry of brain CD45+F4/80lo microglia, blood Ly6Chi monocytes and pancreas F4/80+MHCIIhi/lo macrophages in CSF1R-mer-iCre-mer LSL-tdTomato (CSF1R-tdTom) mice treated in utero with tamoxifen on embryonic day 9.5 (9 days post vaginal plug appearance) followed by treatment with Veh or Cer starting at 8-weeks age as in b. f. Percentage of brain CD45+F4/80lo microglia, blood Ly6Chi monocytes and pancreas F4/80+MHCIIhi/lo macrophages labeled by tdTomato in CSF1R-tdTom mice treated with tamoxifen followed by Veh or Cer as in e; n=24 mice/cell type analyzed. g. Density of pancreas F4/80+MHCIIhi/lo macrophages labeled by tdTomato in CSF1R-tdTom mice treated with tamoxifen followed by Veh or Cer as in e; Veh, n=14 mice; Cer, n=8 mice, *P=0.0022 . h. Representative images of IHC stain for tdTomato in pancreas tissue from CSF1R-tdTom mice treated with tamoxifen followed by Veh or Cer as in e i. Quantification of tdTomato+ cells in pancreas tissue of CSF1R-tdTom mice treated with tamoxifen followed by Veh or Cer as in e; Veh, n=8 mice; Cer, n=7 mice, *P=0.0289. j. Flow cytometry of tdTomato expression in pancreas F4/80+MHCIIhi/lo macrophages in CSF1R-tdTom mice administered tamoxifen by oral gavage for five consecutive days, followed by 10 weeks rest and then treated with Veh or Cer as in b; n = 4 mice/group. k. Density of pancreas tdTomato+ and tdTomatomacrophages in CSF1R-tdTom mice as in j; n = 4 mice/group, left to right *P=0.0286 and *P=0.0286. l. Representative images of IHC stain for tdTomato on pancreas from CSF1R-tdTom as in j; n = 4 mice/group. m. Quantification of pancreas tdTomato+ macrophages from CSF1R-tdTom mice as in j; n = 4 mice/group, *P=0.0159. Data are presented as mean ± SEM. n.s., not significant; *p <0.05. For comparisons between two groups, Student’s two-tailed t-test was used.
Figure 3:
Figure 3:. Pancreas TRMs have distinct transcriptional phenotypes.
a. UMAP plot from single-cell RNA-sequencing (scRNA-seq) analysis of F4/80+MHCIIhi/lo macrophages sorted from livers of Flt3-YFP mice on day 14 post-implantation with the KP2 pancreatic cancer cell line. b. Quantification of Flt3-YFP+ and Flt3-YFP macrophages by cluster from UMAP in a, displayed as percentage of each cluster. c. UMAP plot of scRNA-seq analysis of F4/80+MHCIIhi/lo macrophages sorted from the pancreas of Flt3-YFP mice treated with 6 hourly i.p. injections of Cer every other day for one week. d. Quantification of Flt3-YFP+ and Flt3-YFP macrophages by cluster from UMAP in c, displayed as percentage of each cluster. e. UMAP plots displaying Lyve1, Cx3cr1, Ccr2, H2-Ab1, Cd163 and Mrc1 gene expression in Csf1r and C1qa expressing pancreas macrophages from Flt3-YFP mice as in c f. Heatmap displaying normalized enrichment score (NES) of significantly enriched gene sets comparing all Flt3-YFP macrophages versus Flt3-YFP+ macrophages in indicated single-cell data sets; pathways selected by FDR < 0.05. g. UMAP plot of scRNA-seq analysis of F4/80+MHCIIhi/lo macrophages sorted from the pancreas of CSF1R-tdTom mice administered tamoxifen by oral gavage for 5 consecutive days, followed by a rest period of 10 weeks and a regimen of 6 hourly Cer i.p. injections every other day for one week. h. Quantification of tdTom and tdTom+ macrophages by cluster from UMAP in g, displayed as percentage of each cluster. i. UMAP plots of Lyve1, Cx3cr1, Ccr2 and H2-Ab1 expression in Csf1r and C1qa expressing pancreas macrophages from CSF1R-tdTom mice as in g. j. Heatmap of DEGs upregulated in either LYVE1hi or LYVE1lo macrophages across healthy pancreas, pancreatitis and PDAC samples from Flt3-YFP mice treated with vehicle (Healthy) or cerulein (Pancreatitis) as in c, or orthotopically implanted with the KP1 pancreatic cancer cell line (PDAC). k. Bar graph of NES values of gene sets in LYVE1hi and LYVE1lo macrophages as in j. l. Heatmap of DEGs upregulated in either LYVE1hi or LYVE1lo macrophages from the pancreas of CSF1R-tdTom mice treated as in g. m. Bar graph of NES values of gene sets in LYVE1hi to LYVE1lo macrophages as in l. n. Representative images from multiplex immunohistochemistry (mIHC) staining for hematoxylin, F4/80, tdTomato, LYVE1 and CK19 in the pancreas of cerulein-treated CSF1R-tdTom mice treated as in g, staining repeated for 4 Veh- and 4 Cer-treated mice. Data are presented as mean ± SEM unless otherwise indicated. n.s., not significant; *p <0.05. For comparisons between two groups, Student’s two-tailed t-test was used, except for j and l, where Bonferroni correction was used, and f, k, and m, where FDR was used.
Figure 4:
Figure 4:. Human LYVE1+ TRMs display similar phenotype and localization.
a. UMAP of scRNA-seq analysis in monocytes/macrophages from published human chronic pancreatitis dataset, including 3 healthy pancreas, 4 idiopathic and 5 hereditary chronic pancreatitis samples. b. UMAP plots showing LYVE1 gene expression and mouse LYVE1hi macrophage scRNA-seq signature using top 100 DEGs from mouse LYVE1hi macrophages mapped into healthy and chronic pancreatitis samples from a. c. Heatmap of select marker genes differentially expressed in human chronic pancreatitis cluster 2. Data are p < 0.05 significant using Bonferroni correction. d. Bar graph of NES values of gene sets enriched in LYVE1hi macrophages from human chronic pancreatitis (cluster 2) compared to all other clusters. Data are FDR < 0.05 significant. e. UMAP of scRNA-seq analysis in monocytes/macrophages from 16 human PDAC samples from published PDAC dataset. f. UMAP plots of LYVE1 gene expression and mouse LYVE1hi macrophage scRNA-seq signature using top 100 DEGs from mouse LYVE1hi macrophages mapped into PDAC samples from f. g. Heatmap of select marker genes differentially expressed in the human PDAC cluster 0. Data are p < 0.05 significant using Bonferroni correction. h. Bar graph of NES values of gene sets enriched in human PDAC LYVE1hi macrophages (cluster 0) compared to all other clusters. Data are FDR < 0.05 significant. i. Representative multiplex IHC images from adjacent healthy pancreas or pancreatitis and PDAC tumor samples obtained from patients at Barnes-Jewish Hospital stained for hematoxylin, CK19, CD163 and LYVE1. Highlighted areas of stromal or acinar area showing CK19 and CD163, CK19 and Lyve1, or CK19, CD163 and LYVE1 merged. Scale bars are 1mm (top row) or 100μM (bottom 3 rows).
Figure 5:
Figure 5:. TRMs maintain tissue integrity during pancreatitis.
a. Flow cytometry plots of blood Ly6Chi monocytes and pancreas F4/80+MHCIIhi/lo macrophages from wild-type mice that received CSF1 Ab and clodronate-loaded liposomes (CSF1 Ab+CLD) or IgG and PBS-loaded liposomes (IgG+PBS) by i.p. injection, then allowed to recover for 10 days (day −1), followed by 6 hourly i.p. injections of Cer every other day for one week (day 7). b. Quantification of blood Ly6Clo and Ly6Chi monocytes after the recovery period (day −1) in mice as in a, and pancreas F4/80+MHCIIhi/lo macrophages after the recovery period (day −1) and after Cer treatment (day 7) in mice treated as in a. blood Ly6Clo and Ly6Chi, n=4 mice/group; pancreas F4/80+MHCIIhi/lo macrophages IgG+PBS day −1, n=4 mice/group, all other, n=3mice/group, left to right *P=0.0012 and *P=0.0002. c. Representative mIHC of staining for hematoxylin, F4/80, LYVE1, CD163, and CK19 in the pancreas and quantification of pancreas F4/80+LYVE1+CD163+ macrophages, displayed as the percentage of cells, in mice as in a; IgG+PBS, n=6mice/group, CSF1 Ab+CLD, n=7mice/group, *P=0.0006. Scale bars, 100μM, d. Body weight measurement in mice treated with IgG+PBS or CSF1 Ab+CLD and implanted 10 days later with peritoneal cavity osmotic pumps for the delivery of DMSO (control), 8μg/day cerulein or 10μg/day cerulein. Measurements starting on day of osmotic pump implantation; DMSO, n=5 mice, all other, n=10 mice. e. Kaplan-Meier survival curve showing mice treated with IgG+PBS and CSF1 Ab+CLD followed by osmotic pump implantation as in e; n=10mice/group. IgG+PBS versus CSF1 Ab+CLD with 10μg/day cerulein, p=0.0001; IgG+PBS versus CSF1 Ab+CLD with 8μg/day cerulein, p<0.0001. f. Representative images of pancreas tissue stained for H&E, CK19, amylase or cleaved-caspase-3 (CC3) from mice treated with IgG+PBS or CSF1 Ab+CLD followed by osmotic pump delivery of 10μg/day Cer, as in e, taken at humane survival endpoint (top two rows) or at day 6 post-osmotic pump implantation (bottom row). Scale bars are 100μM. g. Quantification of CK19, amylase, and CC3 IHC stains in pancreas tissue from IgG+PBS or CSF1 Ab+CLD-treated mice administered 10μg/day Cer by osmotic pump, as in e, at humane survival endpoint, displayed as the percentage of cells; CK19, n=5mice/group and *P=0.0079; amylase, IgG+PBS, n=9 mice, amylase CSF1 Ab+CLD, n=8 mice, *P<0.0001; CC3, n=10mice/group and *P<0.0001. h. Quantification of CK19, amylase and CC3 IHC stains in pancreas tissue from IgG+PBS or CSF1 Ab+CLD-treated mice administered 10μg/day Cer by osmotic pump, as in e, at day 6 post-osmotic pump implantation, displayed as the percentage of cells; IgG+PBS, n=12 mice; CSF1 Ab+CLD, n=11 mice; CK19, *P<0.0001; amylase, n=10mice/group, *P=0.0089; CC3, n=10mice/group and *P<0.0001. Data are presented as mean ± SEM unless otherwise indicated. n.s., not significant; *p <0.05. For comparisons between two groups, Student’s two-tailed t-test was used.
Figure 6:
Figure 6:. Depletion of TRMs attenuates fibrotic responses.
a. Representative images and quantification of CK19 IHC stain on pancreas tissue of mice treated with IgG+PBS or CSF1 Ab+CLD, followed by a 10-day recovery period, then 6 hourly i.p. injections with Cer every other day for one week; IgG+PBS, n=6 mice; CSF1 Ab+CLD, n=7 mice and *P=0.0012. b. Representative mIHC images of pancreas tissue from mice treated as in a, stained for hematoxylin, amylase, CK19, Sox9, Ki-67, and podoplanin, scale bars are 100μM. c. Quantification of amylase+ acinar cells expressing CK19, Sox9 or Ki-67, displayed as percentage of acinar cells, and podoplanin+ cells, displayed as percentage of total cells; IgG+PBS, n=6 mice; CSF1 Ab+CLD, n=7 mice; and *P=0.0022 for podoplanin analysis. d. Representative images of pancreas tissue stained for podoplanin and quantification of podoplanin+ area in pancreas from mice treated as in a; IgG+PBS , n=6 mice; CSF1 Ab+CLD, n=7 mice and *P=0.0012. e. Flow cytometry plots of IgG+PBS + pancreas fibroblasts from IgG+PBS-treated mice injected i.p with Veh (IgG+PBS/Veh), or IgG+PBS- or CSF1 Ab+CLD-treated mice injected i.p. with Cer (IgG+PBS/Cer or CSF1 Ab+CLD/Cer), as in a. f. Density of pancreas IgG+PBS + fibroblasts, Ly6C+ inflammatory fibroblasts (iFibs) and PDGFRa+ fibroblasts from IgG+PBS/Veh, IgG+PBS/Cer or CSF1 Ab+CLD/Cer mice as in e; IgG+PBS/Veh, n=7 mice; IgG+PBS/Cer, n=7 mice; CSF1 Ab+CLD/Cer, n=9 mice; top to bottom and left to right, *P=0.0005 and *P=0.0003 in podoplanin analysis, *P<0.0001 and *P<0.0001 in Ly6C+ iFib analysis, and *P=0.0409 in PDGFRa analysis. g. Representative mIHC images of pancreas tissue from Lyve1-Cre mice (Control) or Lyve1-CreCSF1Rflox/flox mice (Lyve1ΔCSF1R) treated with 6 hourly i.p. injections of Cer every other day for one week, stained for hematoxylin, CK19, F4/80, LYVE1 and CD163 and quantification of F4/80+LYVE1+CD163+ pancreas macrophages from Control or Lyve1ΔCSF1R mice treated with Cer, displayed as the percentage of cells; Control, n=8 mice; Lyve1ΔCSF1R, n=9; *P<0.0001. Scale bar, 100μM h. Representative images of podoplanin-stained pancreas tissue and quantification of podoplanin+ area from Control or Lyve1ΔCSF1R mice as in g; Control, n=8 mice; Lyve1ΔCSF1R, n=9, *P<0.0360. i. Flow cytometry plots of podoplanin+ pancreas fibroblasts from Control and Lyve1ΔCSF1R mice as in g. j. Density of pancreas podoplanin+ fibroblasts and PDGFRa+ fibroblasts from Control and Lyve1ΔCSF1R mice as in g; n=6 mice/group, *P=0.0411 in podoplanin analysis and *P=0.0043 in PDGFRa analysis. Data are presented as mean ± SEM unless otherwise indicated. n.s., not significant; *p <0.05. For comparisons between two groups, Student’s two-tailed t-test was used.
Figure 7:
Figure 7:. TRMs shape the tissue-protective fibrotic response.
a. UMAP plot of pancreas podoplanin+ fibroblasts sorted from IgG+PBS or CSF1 Ab+CLD treated mice rested for 10 days then administered 6 hourly i.p. injections of Cer every other day for one week. b. UMAP plots displaying Podoplanin, Pdgfra, Ly6c1, Acta2 and Col8a1 expression in podoplanin+ pancreas fibroblasts of IgG+PBS and CSF1 Ab+CLD-treated mice as in a. c. UMAP plot showing the classification of fibroblast clusters into Ly6C+ iFib, αSMA+ myFib and MHCII+ apFib subtypes in pancreas podoplanin+ fibroblasts of IgG+PBS and CSF1 Ab+CLD treated mice as in a. d. UMAP plot of pancreas podoplanin+ fibroblasts from IgG+PBS or CSF1 Ab+CLD mice as in a. e. Heatmap displaying NES of gene sets significantly enriched across podoplanin+ fibroblast subtypes (as in c) comparing IgG+PBS to CSF1 Ab+CLD samples. f. Dot plot of DEGs upregulated in podoplanin+ fibroblasts from IgG+PBS or CSF1 Ab+CLD-treated mice as in a. g. Heatmaps displaying relative importance of network centrality measures for sender (ligand signals) and receiver (receptors) across macrophage clusters from Flt3-YFP mice treated with Cer by 6 hourly i.p. injections every other day for one week (from Fig. 3c) and fibroblast clusters as in a for PDGF, CCL, CSF1, VCAM and GAS signaling pathway networks from CellChat analysis. h. Violin plots showing expression of PDGF signaling pathway genes Pdgfa, Pdgfb, Pdgfc, Pdgfra and Pdgfrb across macrophage and fibroblast clusters as in g. i. Representative images of podoplanin or fibronectin-stained pancreas tissue from mice injected i.p with Veh or PDGFRi once per day along with 6 hourly Cer i.p. injections every other day for one week. Scale bars, 100μM. j. Quantification of podoplanin+ and fibronectin+ area in pancreas tissue of mice treated with Veh or PDGFRi and cerulein as in i; Veh, n=7 mice; PDGFRi, n=8 mice; *P=0.0205 in podoplanin analysis and *P=0.0140 in fibronectin analysis. k. Flow cytometry of podoplanin+ fibroblasts and density of PDGFRa+ fibroblasts from mice treated with Veh or PDGFRi along with Cer as in i,; n=7 mice/group and *P=0.0175. l. Body weight measurement and Kaplan-Meier survival curve in mice treated with Veh or PDGFRi along with 10μg/day Cer delivered by peritoneal osmotic pumps. Measurements start on day of osmotic pump implantation; n=10 mice/group, *P<0.0001 comparing vehicle and PDGFRi in survival curve. Data are presented as mean ± SEM unless otherwise indicated. n.s., not significant; *p <0.05. For comparisons between two groups, Student’s two-tailed t-test was used, except for f, where Bonferroni correction was used, and e, where FDR was used.
Figure 8:
Figure 8:. TRMs drive fibrosis and pancreatitis-accelerated PDAC progression.
a. Representative mIHC images of pancreas tissue stained for hematoxylin, CK19, F4/80, LYVE1 and CD163 and quantification of F4/80+LYVE1+CD163+ macrophages and F4/80+ macrophages, displayed as the percentage of cells, from 2.5 month old p48-Cre LSL-KRASG12D p53fl/+ (hereafter KPC) mice treated with IgG+PBS or CSF1 Ab+CLD, recovered for 10 days then treated with 6 hourly i.p. injections of Cer every other day for 5 days; F4/80+LYVE1+CD163+ macrophage analysis: IgG+PBS, n=7; CSF1 Ab+CLD, n=8 mice; *P=0.0012; F4/80+ macrophage analysis: IgG+PBS, n=9; CSF1 Ab+CLD, n=8 mice; *P=0.0079. Scale bar, 100μM. b. Representative images of pancreas tissue stained for H&E or CK19 from IgG+PBS or CSF1 Ab+CLD-treated KPC mice as in a. Scale bars are 1mm (left column) or 100μM (right two columns). c. Quantification of tumor area presenting cyst-like appearance, poorly differentiated/high grade invasive pancreatic tumor lesions, tumor lesions and stromal areas as percent of total pancreas area, and CK19+ cells as percentage of total cells in IgG+PBS or CSF1 Ab+CLD-treated KPC mice as in a; IgG+PBS, n=9 mice; CSF1 Ab+CLD, n=8, left to right, *P=0.0003 for cystic area analysis, *P=0.0079 for poorly differentiated area analysis, *P=0.0010 and *P=0.0152 for tumor and stromal area analysis, and *P=0.0003 for CK19 analysis. d. Representative images of pancreas tissue stained for CK19, podoplanin or αSMA from IgG+PBS or CSF1 Ab+CLD-treated KPC mice as in a, scale bars are 100μM. e. Representative images of pancreas tissue from 2 month old p48-Cre LSL-KRASG12D p53fl/fl (KPPC) mice treated with IgG+PBS or CSF1 Ab+CLD at 1 month of age and rested for 4 weeks. Scale bars are 100μM. f. Quantification of podoplanin+ or fibronectin+ area in KPPC mice treated with IgG+PBS or CSF1 Ab+CLD as in e. IgG+PBS, n=10 mice; CSF1 Ab+CLD, n=8, *P=0.0014 for podoplanin analysis and *P=0.0205 for fibronectin analysis. Data are presented as mean ± SEM unless otherwise indicated. n.s., not significant; *p <0.05. For comparisons between two groups, Student’s two-tailed t-test was used.

References

    1. Ginhoux F et al. Fate mapping analysis reveals that adult microglia derive from primitive macrophages. Science 330, 841–845 (2010). - PMC - PubMed
    1. Hoeffel G et al. C-Myb(+) erythro-myeloid progenitor-derived fetal monocytes give rise to adult tissue-resident macrophages. Immunity 42, 665–678 (2015). - PMC - PubMed
    1. Epelman S et al. Embryonic and adult-derived resident cardiac macrophages are maintained through distinct mechanisms at steady state and during inflammation. Immunity 40, 91–104 (2014). - PMC - PubMed
    1. Schulz C et al. A lineage of myeloid cells independent of Myb and hematopoietic stem cells. Science 336, 86–90 (2012). - PubMed
    1. Hashimoto D et al. Tissue-resident macrophages self-maintain locally throughout adult life with minimal contribution from circulating monocytes. Immunity 38, 792–804 (2013). - PMC - PubMed

Methods references:

    1. Soares KC et al. A preclinical murine model of hepatic metastases. J Vis Exp, 51677 (2014). - PMC - PubMed
    1. Lee JW et al. Hepatocytes direct the formation of a pro-metastatic niche in the liver. Nature 567, 249–252 (2019). - PMC - PubMed
    1. Zhu Y et al. Tissue-Resident Macrophages in Pancreatic Ductal Adenocarcinoma Originate from Embryonic Hematopoiesis and Promote Tumor Progression. Immunity 47, 323–338 e326 (2017). - PMC - PubMed
    1. Peng H et al. Liver-resident NK cells confer adaptive immunity in skin-contact inflammation. Journal of Clinical Investigation 123, 1444–1456 (2013). - PMC - PubMed
    1. Hafemeister C & Satija R Normalization and variance stabilization of single-cell RNA-seq data using regularized negative binomial regression. Genome Biology 20 (2019). - PMC - PubMed

Publication types