. 2023 Nov;15(11):1607-1615.
doi: 10.1038/s41557-023-01275-1. Epub 2023 Aug 10.

Optical control of ultrafast structural dynamics in a fluorescent protein

Affiliations

Optical control of ultrafast structural dynamics in a fluorescent protein

Christopher D M Hutchison et al. Nat Chem. 2023 Nov.

Abstract

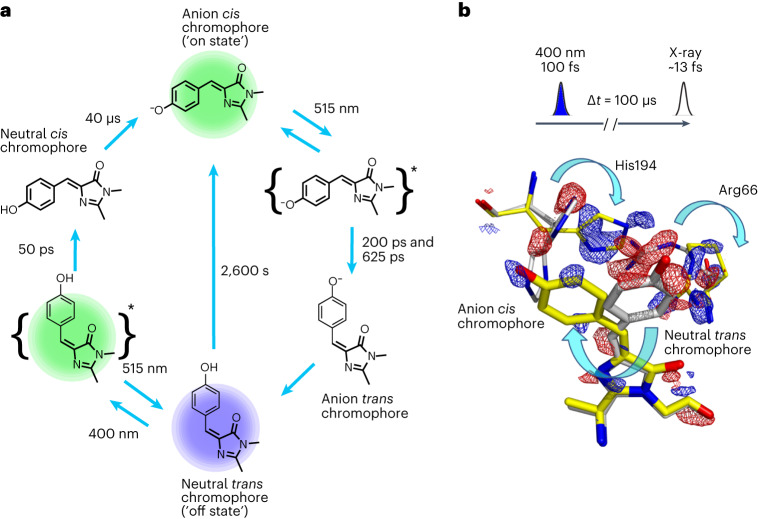
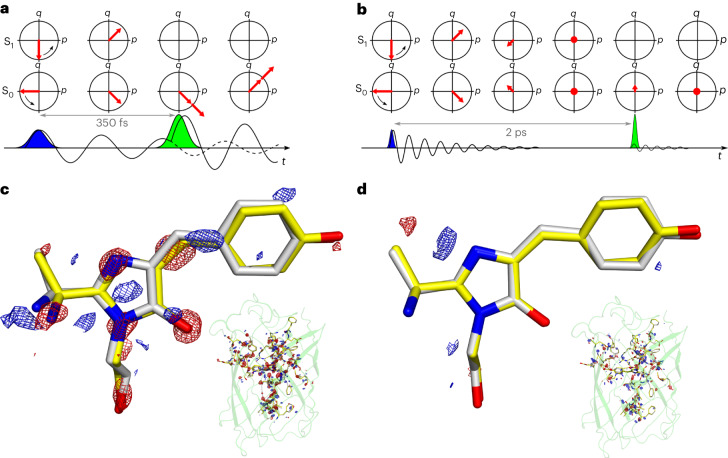
The photoisomerization reaction of a fluorescent protein chromophore occurs on the ultrafast timescale. The structural dynamics that result from femtosecond optical excitation have contributions from vibrational and electronic processes and from reaction dynamics that involve the crossing through a conical intersection. The creation and progression of the ultrafast structural dynamics strongly depends on optical and molecular parameters. When using X-ray crystallography as a probe of ultrafast dynamics, the origin of the observed nuclear motions is not known. Now, high-resolution pump-probe X-ray crystallography reveals complex sub-ångström, ultrafast motions and hydrogen-bonding rearrangements in the active site of a fluorescent protein. However, we demonstrate that the measured motions are not part of the photoisomerization reaction but instead arise from impulsively driven coherent vibrational processes in the electronic ground state. A coherent-control experiment using a two-colour and two-pulse optical excitation strongly amplifies the X-ray crystallographic difference density, while it fully depletes the photoisomerization process. A coherent control mechanism was tested and confirmed the wave packets assignment.


Conflict of interest statement

The authors declare no competing interests.

Figures

Fig. 1
Fig. 1. rsKiiro photocycle.
a, General photocycle scheme of the reversible photoisomerization and proton-transfer reactions of rsKiiro. Light-induced transitions with 400-nm (blue) and 515-nm (green) wavelengths are indicated. b, Time-resolved crystallography measurement of transcis photoisomerization of the off state with a trans neutral chromophore using femtosecond excitation at a wavelength of 400 nm, conducted at PAL-XFEL. Q-weighted Fo(100μs)Fo(Dark) difference maps contoured at 3σ at a resolution of 1.5 Å and at a 100-μs delay show transcis photoisomerization and rearrangements of His194 and Arg66.
Fig. 2
Fig. 2. Optical control of structural dynamics in rsKiiro.
a,b, Femtosecond time-resolved PP (a) and PDP (b) TR-SFX experiment for rsKiiro in the off state with a trans neutral chromophore. For this analysis, time-resolved data with delays between ~250 fs and 1.2 ps were merged, and Q-weighted Fo(PP)Fo(Dark) and Fo(PDP)Fo(Dark) maps are shown (red, −3σ, blue +3σ) at a resolution of 1.5 Å. Coordinates for the ground state are shown (yellow sticks; PDB 7QLM). Coordinates for the PP data (white sticks, a; PDB 7QLN) and PDP data (cyan sticks, b; PDB 7QLO) were refined from extrapolated structure factors and occupancy refinement. The creation of coherence in the PP and PDP conditions follows the density matrix theory of impulsive Raman spectroscopy applied to a double-well adiabatic potential. The initial Wigner coordinate and direction relative to the nuclear binding force (momentum, p; position, q) are indicated by arrows. Also shown are the sequentially integrated electron densities around each atom in the protein chain (bottom), with the atoms in the chromophore highlighted in yellow.
Fig. 3
Fig. 3. Amplification of structural motion requires the pump–dump delay to be within the vibrational dephasing time, not the excited-state lifetime.
a,b, Vibrational-coherence transfer dominates the observed displacements on a femtosecond timescale for the PDP condition (a). A test for Tannor–Rice coherent dynamics moved the dump delay to 2 ps (b), after vibrational dephasing but well within the 50-ps excited-state lifetime. c,d, A comparison of the PDP experiment with a 350-fs dump time (c) conducted at SACLA reproduces the LCLS experiment in Fig. 2 in detail. FoFo difference maps are shown at 3σ level and 1.5 Å resolution. Strong decay of the difference signals is observed when dumping at 2 ps after dephasing, as predicted by Tannor–Rice coherent control (b,d). A schematic representation of coherence in the ground state (S0) and excited state (S1) is shown in the Wigner phase-space representation as the evolution of momentum p and position q of the S0 and S1 wave packets (a,b). A full coherence simulation using a density-matrix calculation including Wigner transforms is presented in Fig. 4, Extended Data Fig. 8 and Supplementary Section 13.
Fig. 4
Fig. 4. Density matrix calculations and resulting Wigner phase-space probability distributions for TR-SFX experimental conditions on rsKiiro using different pulse schemes.
Calculations were performed using the parameters listed in Supplementary Table 11, which are representative of the TR-SFX conditions and use the methodology described in Supplementary Section 13. a,b, Comparison of the populations (a(i) and b(i)) and coherences (a(ii) and b(ii)) of the S0 (red) and S1 (yellow) electronic states over time, with the pump (dashed lines) and pump–dump (solid lines) schemes shown, for 350-fs pump–dump delay (a, corresponding to Figs. 2 and 3a) and 2-ps delay (b, corresponding to Fig. 3b). A coherence comparison is made between the pump and short 350-fs (a) and long 2-ps (b) pump–dump delays. The Wigner phase-space distributions of the S0 ground state for all pulse schemes are shown in a(iii) and b(iii), with a(iii) showing an increase in asymmetry due to Tannor–Rice coherence transfer from excited to ground state after dump interaction within vibrational dephasing. In contrast, as expected, the longer 2-ps delay after vibrational dephasing in b(iii) shows minimal impact on the distribution, with a small generation of position (q) and no impulse momentum (p) transferred, but with population transfer after the dump interaction. The corresponding Wigner transformations for S1 are shown in Supplementary Fig. 58 using surface representations.
Fig. 5
Fig. 5. Temperature dependence of trans(A)–cis(B) and cis(B)–trans(A) photoisomerization kinetics.
a, Potentials are shown as adiabatic states that contain the A1 (PDB 7QLM and 7QLJ) and A2 (PDB 7QLN and 7QLO) off-state and B1 (PDB 7QLK) and B2 (PDB 7QLL and 7QLI) on-state structures as shown. The protonated anionic BH state is a putative intermediate that connects the photocycle (Fig. 1). Cryo-trapping of the unrelaxed on state resolved the double-well structural features of the B1 and B2 on states (Supplementary Sections 9 and 11 provide crystallographic details and full thermodynamic modelling, respectively). b, Arrhenius plots for the on→off (black) and off→on (red, with low-temperature on→off pre-conversion; blue, with on→off pre-conversion at 296 K) kinetics under continuous illumination at 473 nm and 405 nm, respectively, showing convex behaviour in both directions. The off→on kinetics that included high-temperature annealing before conversion (blue) showed significantly reduced kinetics and shifting of the transition temperature to higher values. Both high- and low-temperature regions involved photoisomerization in both on→off and off→on directions, as shown from X-ray-crystal structural analysis (Supplementary Section 9). The error bars in b are the standard error.
Extended Data Fig. 1
Extended Data Fig. 1. Temperature dependence and energy barriers of rsKiiro photo-switching.
a. Steady state UV -VIS spectra of the on (cis) and off (trans) state. b. Fluorescence emission spectra from the weakly fluorescent off state. c. Arrhenius plot of the off→on thermal recovery at temperature s ranging from 284-323 K fitting of the Arrhenius equation recovered an energy barrier of of 91± 5 kJ mol-1 between the states and an unscaled prefactor of 1.28×10¹³±1 s-1. d. Arrhenius plot of the temperature dependence of the two off→on PP TA time constants (Extended Data Fig. 3d), e. Arrhenius plot of the off→on photoswitching rate over a large range of cryo temperatures, where the preconversion to the off state was performed at cyro (red) and room temperature (blue). f. Bootstrap Arrhenius fitting of the total off→on rate (kT) obtained from temperature dependence of the average TA rate which was used with the photoswitching scaled rate (kPI) and radiative decay rate (kR) to recover the internal conversion rate (kIC) and barrier (EIC). g. The proposed electronic structure model for the off→on reaction of rsKiiro. h. Summery table of electronic barriers recovered for rsKiiro photoswitching reactions. i. Time correlated single photon counting (TCSPC) decays for the on→off reaction of rsKiiro including the instrument response function (IRF). j. Arrhenius plots of the temperature dependence of the fast and middle rates recovered from TCSPC. k & l The same plots as e & f for the on→off reaction. A full description of all the fitting models and values are shown in section 11 of the supplementary materials. Error bars shown in c-f & j-l use SE.
Extended Data Fig. 2
Extended Data Fig. 2. Flash photolysis yields in crystalline rsKiiro with femtosecond pumping.
a. Photoproduct yield and single shot bleach of rsKiiro prepared in the trans off state and pumped with 400 nm 100 femtosecond pulses over a range of energy densities. b. Fitting of total non-linear cross-section modelled with Z-scan theory using a quantum yield of 18.3% for the off→on reaction (section 6 of supplementary materials). c. Same fitting expressed against power density. d. Photoproduct yield in crystalline rsKiiro in the presence of a 515 nm dump pulse (black) as a function of pump-dump delay. The pump-probe yield (blue) and its error (blue dashed) are shown for reference, while the model (red) is the convolution of two 100 fs Gaussian pulses combined with the 50 ps exponential decay of the excited state lifetime obtained from transient absorption measurements. In a-d each measurement condition was repeated across numerous crystalline samples with absorptions ranging between 0.1-0.6 OD. Error bars shown use SE.
Extended Data Fig. 3
Extended Data Fig. 3. Transient absorption spectroscopy of rsKiiro.
a. PP transient absorption spectra showing GSB, ESA and SE at <410, 420-470 and 470-570 nm. b. PDP transient absorption spectroscopy for a 2 ps pump-dump delay, showing a ~50% reduction of the GSB and ESA and complete suppression of the SE. c. PDP TA spectra for pump-dump delay of 350 fs showing the same behaviour as the longer dump delay. d. Evolution Associated Difference Spectra (EADS) recovered from global fitting of PP TA spectra using a simple sequential model (A1*→A2*→A2/A1/BH)(Extended Data Figs. 1g and 8). e. Global fitting of the PDP TA spectra after the dump pulse recovered a single EADS corresponding to the A2 state. f. Lineout fits of the PP and PDP key spectra regions for 2 ps (left) and 350 fs (right) pump-dump delays, a bi-exponential was used for the PP fits with amplitude weighting and initial time constant taken from the global fitting. g. TA spectra for a fixed pump-probe delay of 1.5 ps while scanning the pump-dump delay. h. Dump only off-resonance pumping TA spectra with 510 nm femtosecond excitation of the ‘off’ state at fixed 1 ps pump probe delay (‘off’ spectra). Preillumination with 515 nm light prepares the pure off state and no TA signals are seen within the sensitivity of the instrument (black and red) while if the preillumination is not used and the ON state is present the weaker condition generates >100 mOD signals (Note: log vertical scale). This demonstrates that 515 nm dump pulse has sufficiently low cross section in the off state to not contribute to the signals seen in the absence of a pump-pulse. i. Microsecond transient absorption difference spectra of rsKiiro trans-cis reaction. The rise 488 nm peak corresponding to the cis-anion can be seen with a 40 ± 10 μs time constant. The break in the spectra at 473 nm corresponds to scatter of the pre-illumination laser.
Extended Data Fig. 4
Extended Data Fig. 4. Femtosecond time resolved Infrared and FTIR spectroscopy of rsKiiro.
a. steady state FTIR difference spectra of the off minus the on state of rsKiiro. Conversion to the off state was achieved by illuminating the sample with a 500 nm LED. b. TR-IR pump-probe measurements of the off state when pumped with 400 nm 100 fs pulses. The fitted EADS spectra are shown (top) and selected spectra at various pump-probe delays (bottom). Greyed out bands correspond to the labelled assignments. Note: For the on state there is overlap of the C = O and Arg66 asym CN3H5+ in the 1645-1670 cm-1 region. c. Dronpa and rsKiiro on and off state FTIR peak assignments for 2H and 1H buffers. Dronpa assignments made by Warren et al. All values in units of cm-1.
Extended Data Fig. 5
Extended Data Fig. 5. Comparison of the PP vs PDP TR-SFX light induced differences in the rsKiiro chromophore region.
a. Difference maps for the chromophore region, hydrogen bonded water and His194 for the femtosecond time bins for PP (Left) and PDP (right) data. The coordinates for ground state (yellow carbons) and the refined coordinates for light data after partiality refinement (grey carbons) are shown with electron density contoured at +3σ rms (blue) and -3σ rms (red).A 1.5 Å resolution cutoff was used. b. Same representation for the merged 0-1 ps PP delays with key difference peaks numbered. c. Difference density peak values at the locations shown in panel b. Plotted as a solid line (with dots) and a dashed line (with diamonds) for the PP and PDP respectively. Shown in blue for positive values of density, and in red for negative. The time dependence of difference features elsewhere in the protein (Fig. 1) showed a similar multi-mode character, but with different dependence for most features.
Extended Data Fig. 6
Extended Data Fig. 6. Comparison of rsKiiro TR-SFX Pump-Probe vs Pump-Dump-Probe difference maps.
a. Q-weighted difference electron density for each bin of the Pump-Probe (400 nm) on the left and of the Pump-Dump-Probe (400-515 nm) on the right. The secondary structure (green) of the ground state coordinates (yellow) are shown with electron density contoured at +3σ rms (blue) and -3σ rms (red). b. Integrated electron difference density above 3σ level within 2 Å of each sequential atom in the protein chain (in residue number order) for Pump-Probe data 3375set. Plotted for each time bin is the positive (blue) and negative (red) electron density, which are normalized with respect to all other time bins. Shown at the bottom is a greyscale bar indicating the distance from the center of the chromophore to the atom number65 c. and d. The same analysis for the Pump-Dump-Probe case.
Extended Data Fig. 7
Extended Data Fig. 7. Extrapolated maps and difference maps of merged 0-1 ps TR-SFX of rsKiiro with refined coordinates.
a. Pump-probe illumination scheme. Map showing extrapolated F0 electron density for NEXT = 13.6, contoured at 1.5 rms (yellow mesh) with the ground state (yellow) and extrapolated (grey) refined coordinates. Q-weighted difference electron density between the dark and 400 nm 0-1 ps is shown at 3 rms level with positive and negative signals in blue and red respectively. There is a 180° rotation between the left and right representations. b. Pump-Dump-Probe illumination scheme, with same representation except a value of NEXT = 9 was chosen as it was closest to R-factor minimization occupancies of 21 % using the approximation: PT ~ 200/ NEXT where PT is population transfer.
Extended Data Fig. 8
Extended Data Fig. 8. Results of QM-MM calculations on rsKiiro.
a. Hydrogen bonding configuration in state A1 (yellow), A2 (cyan) and an overlap of the two configurations. b. QM subsystem used for QM-MM calculations, shown with balls and sticks. Red dashed lines represent distances, used to search for transition state between A1 and A2 conformations. c. Energy diagram for optimized structure of A1 and A2 conformations from QM-MM calculations. These calculations are described in section 12 of the supplementary materials.

References

    1. Warren MM, et al. Ground-state proton transfer in the photoswitching reactions of the fluorescent protein Dronpa. Nat. Commun. 2013;4:1461. doi: 10.1038/ncomms2460. - DOI - PubMed
    1. Du M, Fleming GR. Femtosecond time-resolved fluorescence spectroscopy of bacteriorhodopsin: direct observation of excited state dynamics in the primary step of the proton pump cycle. Biophys. Chem. 1993;48:101–111. doi: 10.1016/0301-4622(93)85002-Y. - DOI
    1. Gai F. Chemical dynamics in proteins: the photoisomerization of retinal in bacteriorhodopsin. Science. 1998;279:1886–1891. doi: 10.1126/science.279.5358.1886. - DOI - PubMed
    1. Okada T, et al. Functional role of internal water molecules in rhodopsin revealed by X-ray crystallography. Proc. Natl Acad. Sci. USA. 2002;99:5982–5987. doi: 10.1073/pnas.082666399. - DOI - PMC - PubMed
    1. Polli D, et al. Conical intersection dynamics of the primary photoisomerization event in vision. Nature. 2010;467:440–443. doi: 10.1038/nature09346. - DOI - PubMed

Publication types