. 2023 Aug;30(8):1224-1237.
doi: 10.1038/s41594-023-01052-1. Epub 2023 Aug 10.

Replication dynamics identifies the folding principles of the inactive X chromosome

Affiliations

Replication dynamics identifies the folding principles of the inactive X chromosome

Rawin Poonperm et al. Nat Struct Mol Biol. 2023 Aug.

Abstract

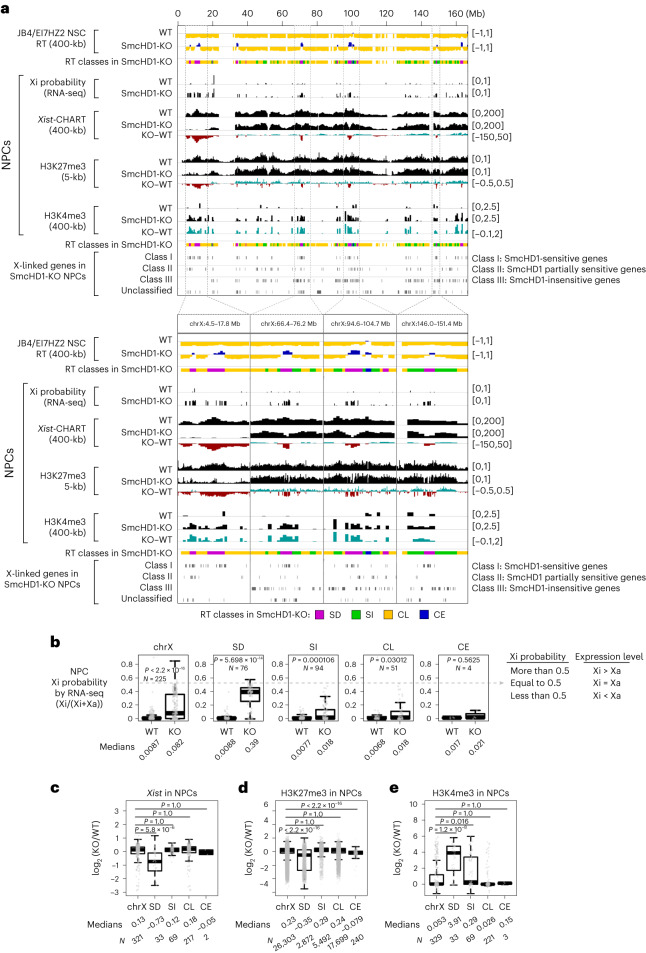
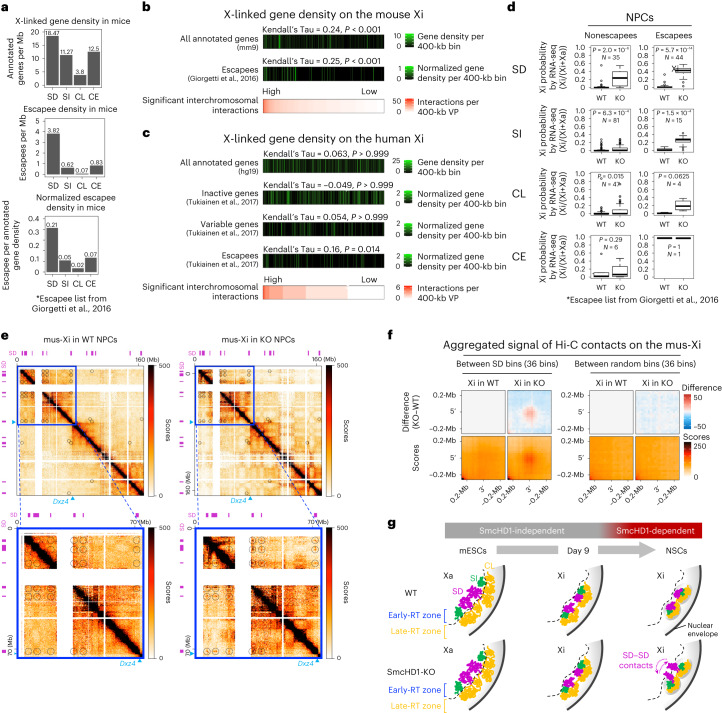
Chromosome-wide late replication is an enigmatic hallmark of the inactive X chromosome (Xi). How it is established and what it represents remains obscure. By single-cell DNA replication sequencing, here we show that the entire Xi is reorganized to replicate rapidly and uniformly in late S-phase during X-chromosome inactivation (XCI), reflecting its relatively uniform structure revealed by 4C-seq. Despite this uniformity, only a subset of the Xi became earlier replicating in SmcHD1-mutant cells. In the mutant, these domains protruded out of the Xi core, contacted each other and became transcriptionally reactivated. 4C-seq suggested that they constituted the outermost layer of the Xi even before XCI and were rich in escape genes. We propose that this default positioning forms the basis for their inherent heterochromatin instability in cells lacking the Xi-binding protein SmcHD1 or exhibiting XCI escape. These observations underscore the importance of 3D genome organization for heterochromatin stability and gene regulation.


Conflict of interest statement

The authors declare no competing interests.

Figures

Fig. 1
Fig. 1. The Xi replicates rapidly and uniformly in late S during XCI.
a, Neural differentiation protocols of JB4/EI7HZ2 mESCs. b, Schematic diagram of BrdU-IP Repli-seq experiment. BrdU-labeled cells are sorted into early and late S-phase fractions (gating strategy is shown in Supplementary Fig. 1i), which are subject to immunoprecipitation (IP) using an anti-BrdU antibody. The ratio of early and late S-phase DNA is calculated to generate a genome-wide RT profile. c, Comparison of genome-wide RT profiles (sliding windows of 200 kb at 80-kb intervals, excluding the X) during differentiation of JB4/EI7HZ2 mESCs, CBMS1 mESCs, EpiSCs and MEFs by hierarchical clustering. d, BrdU-IP RT profiles of the JF1-X and the B6-X during JB4/EI7HZ2 mESC differentiation (average of 2–3 replicates, 400-kb bins). RT classes represent four types of ESC-to-NSC RT regulation, which were described on the right. The blue line shows Dxz4 position. e, Binarized whole-S scRepli-seq profiles of the JF1-Xa and the B6-Xi from 94 NSCs throughout the S. The scRepli-seq profiles are ordered by their percentage replication scores (of the whole genome excluding the X). BrdU-IP RT of the NSCs is shown for comparison. The blue lines show Dxz4 position. f, Percentage replication scores of the JF1-Xa and the B6-Xi were plotted against those of the whole genome for each NSC (open circles). Cells were divided into 18 groups by their percentage replication scores and the average scores of the JF1-Xa and the B6-Xi in each group are shown by filled circles. To minimize errors during data fitting, we added two pseudo-percentage replication scores, 0 and 100%, at the earliest end and the latest end of the S-phase, respectively. We fitted a linear and a sigmoid model to the JF1-Xa and the B6-Xi, respectively, to calculate the T10–90% values (the time required to go from 10 to 90% replication, assuming a 10 h S). g, Cells were divided into ten groups by percentage replication scores and the boxplots show distributions of percentage replication scores of the JF1-Xa and the B6-Xi in each group. h, An exemplary latest RT region on the Xa, which advanced its RT on the Xi in NSCs. CBMS1 mESC data are shown for comparison. Source data
Fig. 2
Fig. 2. SmcHD1 is required for maintaining the uniformly late-replicating Xi but dispensable for the initiation of the RT switch.
a, BrdU-IP RT profiles of the B6-X during WT and SmcHD1-mutant (KO) mESC differentiation (average of 2–3 replicates). In addition to the ESC-to-NSC RT classes, those identified in SmcHD1-mutant cells are shown. The blue lines show Dxz4 position. b, Whole-S scRepli-seq plots of the B6-Xi from 94 WT NSCs and 85 SmcHD1-mutant NSCs, as in Fig. 1e. ESC-to-NSC RT classes as well as those identified in SmcHD1-mutant NSCs are shown. The blue lines show Dxz4 position. c, Single-cell RT (scRT) values were calculated for four RT classes identified by SmcHD1-mutant NSC analysis. Single-cell RT represents an estimated time when a given genomic bin replicates in S (assuming a 10 h S). P values were obtained from one-sided paired Wilcoxon signed-rank test. N, the number of bins in each RT class. d, Whole-S scRepli-seq plots in Fig. 2b were sorted by the BrdU-IP RT values of SmcHD1-mutant NSCs (from early to late RT). The red box corresponds mostly to the SD and CE classes and is magnified on the right. e, Comparison of percentage replication scores of the Xs in WT (black) and SmcHD1-mutant NSCs (red) with those of the whole genome, as in Fig. 1f. Source data
Fig. 3
Fig. 3. The SD domains protrude out of the Xi core and contact each other in SmcHD1-mutant NSCs.
a, Nine 4C-seq viewpoints (red arrows) on the X. BrdU-IP RT data are shown. Colors represent four distinct RT classes. The blue line shows Dxz4 position. b, Smoothed 4C-seq profiles (black) of the B6-X in WT and SmcHD1-mutant (KO) mESCs (Xa), day 9 differentiated cells (Xi) and NSCs (Xi) overlaid on the BrdU-IP RT profiles (blue, early and yellow, late). Reads from two replicates were combined and plotted in sliding windows of 201 restriction fragments (Methods). Red lines and arrowheads, viewpoints; blue lines, Dxz4; gray bars beneath each plot, significant (sig.) far-cis contacts (the number of such contacts is shown in the top right corner of each 4C plot in gray); domainogram beneath each plot, the significance of the interaction shown by the color range (window sizes are 2–200 from the bottom to the top); pink highlighted regions, SD domains; colored bars, RT classes.
Fig. 4
Fig. 4. The SD-domain genes are preferentially reactivated and lose repressive Xi signatures in SmcHD1-mutant NPCs.
a, Comparison of Xi probability of X-linked gene expression ((mus-Xi reads)/(mus-Xi reads + cas-Xa reads); 0 and 0.5 represent fully silenced and reactivated Xi states, respectively), Xist RNA enrichment by CHART-seq and H3K27me3 and H3K4me3-ChIP–seq (ref. ) on the Xi in WT and SmcHD1-mutant (KO) NPCs. BrdU-IP RT of the NSC Xi (B6-Xi) is shown for comparison. Class I (SmcHD1-sensitive), class II (partially SmcHD1-sensitive), class III (SmcHD1-insensitive) and unclassified genes are based on expression analysis by Wang et al.. Bin sizes are shown in parentheses. Upper and lower panels show the entire Xi and the magnified views of four representative SD-domain regions, respectively. Colored bars, RT classes. b, Comparison of Xi probability of 225 X-linked gene expression between RT classes in WT and KO NPCs. Escapees in NPCs identified by Wang et al. were removed before the analysis. N, the number of X-linked genes in each class. P values were obtained from one-sided paired Wilcoxon signed-rank test. ce, Comparison of Xist (c), H3K27me3 (d) and H3K4me3 (e) enrichment on the SmcHD1-KO versus WT Xi among RT classes. N, the number of genomic bins in each class. The log2(fold change) is shown. P values in ce were obtained from a one-sided Wilcoxon signed-rank test with the Bonferroni correction. Source data
Fig. 5
Fig. 5. Validation of the protrusion of SD domains out of the Xist territory and their closer proximity in SmcHD1-mutant NSCs by FISH.
a, SD, SI and CL domain BACs were used to examine their subnuclear localization relative to the Xist cloud. b, Representative images of RNA- and DNA-FISH using Xist RNA and SD, SI or CL BAC probes in JB4/EI7HZ2 NSCs. We categorized the DNA-FISH signal localization relative to the Xist cloud into four groups (Methods). Scale bars, 5 μm. c,e, Percentages of DNA-FISH signal localization relative to the Xist cloud in NSCs: set 1 (c) and set 2 (e). d,f, Distance between the DNA-FISH signal and the Xist cloud centroid in NSCs normalized with Xist Feret diameter in the same nucleus: set 1 (d) and set 2 (f). g, Three SD BACs and their interaction frequencies as observed by 4C-seq (Fig. 3b and Supplementary Fig. 6). Red lines, viewpoints; blue lines, Dxz4; gray bars beneath each plot, significant far-cis contacts; colored bars, RT classes. h, Representative images of RNA- and DNA-FISH using Xist RNA and SD BAC probes in JB4/EI7HZ2 NSCs. The SD–SD localization patterns were categorized into three groups. Scale bars, 5 μm. i, Percentages of SD–SD localization patterns in WT and SmcHD1-mutant NSCs. j,k, Normalized distances between two SD probes were plotted as cumulative plots: comparing WT versus SmcHD1-mutant NSCs (j) and comparing the SD protrusion group (k). N, the total number of cells analyzed from two to three independent experiments. P values in c, e and i were obtained from a chi-square test for all groups and a Fisher’s exact test for the protruded group. P values in d and f were obtained from one-sided Wilcoxon signed-rank test, with data that used a paired test indicated. P values in j and k were obtained from a two-sided Kolmogorov–Smirnov test. Source data
Fig. 6
Fig. 6. The SD but not SI domains on the X chromosomes frequently contact other chromosomes in WT and SmcHD1-mutant NSCs.
a,b, Circos plots are shown, which show interactions of 4C-seq viewpoints (red arrowheads) with the rest of the genome in NSCs (a) and mESCs (b) (representative results from replicate 2). Each line represents a significant interchromosomal interaction. c, Using a published allele-specific Hi-C data, we created virtual 4C-seq profiles of WT and SmcHD1-mutant (KO) NPCs from 417 viewpoints (VPs) (400-kb bins) and plotted the number of significant interchromosomal interactions for each bin on the cas-Xa and the mus-Xi, as well as the KO–WT differential. Escapee positions are shown. A similar plot was generated for the Xa in mESCs without allelic separation. Blue lines show Dxz4 position. d, Boxplots showing the number of significant interchromosomal interactions of virtual 4C-seq viewpoints in SD, SI, CL and CE domains on the Xs in WT NPCs and mESCs. P values were obtained from a one-sided Wilcoxon signed-rank test with the Bonferroni correction. e, Boxplots as in d comparing WT versus SmcHD1-KO Xa or Xi in NPCs. P values were obtained from one-sided paired Wilcoxon signed-rank test. f, Comparison of BrdU-IP RT values of SD and SI domains on the Xi during mESC differentiation. P values were obtained from one-sided Wilcoxon signed-rank test. N, the number of genomic bins in each class in d and e. Source data
Fig. 7
Fig. 7. Escapee distribution on the Xi and the identification of SD–SD interactions in SmcHD1-KO NPC Hi-C data.
a, Comparison of gene density on the X among RT classes (genes per Mb). Top, mouse annotated genes (mm9 Ref-seq genes); middle, escapees; bottom, escapees normalized by Ref-seq gene density. b, Densities of all annotated Ref-seq genes and escapees normalized by Ref-seq gene density (middle) relative to significant interchromosomal interaction frequency as assayed by virtual 4C of NPCs (bottom). c, Similar plots to b were made after virtual 4C (388 viewpoints, 400-kb each) of the human X chromosome using a hTERT-RPE1 Hi-C data. The inactive (genes subject to stable XCI), variable (genes variably escaping from XCI) and escapee genes were defined based on a systematic human transcriptome study. Shown are their densities normalized by UCSC gene density. P values in b and c were obtained from Kendall’s rank correlation test with the Bonferroni correction. d, Comparison of Xi probability of X-linked gene expression in SmcHD1-mutant (KO) and WT NPCs as in Fig. 4a,b. Genes were classified into nonescapees and escapees and into SD, SI, CL and CE classes. P values were obtained from one-sided paired Wilcoxon signed-rank test. N, the number of X-linked genes in each class. e, Hi-C heatmaps of the mus-Xi in WT and SmcHD1-mutant (KO) NPCs from Wang et al. (250-kb resolution). Black circles on Hi-C heatmaps indicate strong SD–SD interactions found in SmcHD1-mutant NPCs. The bottom panel shows enlarged views of blue boxes in the top panel. Magenta, SD domains; blue arrows, Dxz4. f, Aggregated plots of interactions between SD (left) and random bins (right) by Hi-C. g, A proposed model for the formation of the multi-layered 3D structural organization of the Xi. During XCI, an EtoL compartment switch of the Xi occurs first (SD and SI domains) and is followed by a further 3D reorganization of the Xi through the actions of factors such as SmcHD1. Without SmcHD1, the Xi fails to maintain its late replication and 3D structure later during differentiation, resulting in frequent protrusion of SD domains located close to the surface of the Xi (but not SI domains), which occasionally interact with each other. Whereas the figure shows the contact between protruded SD domains, it is also possible that SD–SD domain interactions could occur inside the Xi core (Supplementary Text 2). Source data

References

    1. Disteche CM, Berletch JB. X-chromosome inactivation and escape. J. Genet. 2015;94:591–599. doi: 10.1007/s12041-015-0574-1. - DOI - PMC - PubMed
    1. Loda A, Collombet S, Heard E. Gene regulation in time and space during X-chromosome inactivation. Nat. Rev. Mol. Cell Biol. 2022;23:231–249. doi: 10.1038/s41580-021-00438-7. - DOI - PubMed
    1. Teller K, et al. A top-down analysis of Xa- and Xi-territories reveals differences of higher order structure at ≥20 Mb genomic length scales. Nucleus. 2011;2:465–477. doi: 10.4161/nucl.2.5.17862. - DOI - PubMed
    1. Eils R, et al. Three-dimensional reconstruction of painted human interphase chromosomes: active and inactive X chromosome territories have similar volumes but differ in shape and surface structure. J. Cell Biol. 1996;135:1427–1440. doi: 10.1083/jcb.135.6.1427. - DOI - PMC - PubMed
    1. Galupa R, Heard E. X-chromosome inactivation: a crossroads between chromosome architecture and gene regulation. Annu. Rev. Genet. 2018;52:535–566. doi: 10.1146/annurev-genet-120116-024611. - DOI - PubMed

Publication types

Substances