. 2023 Sep;9(9):1558-1571.
doi: 10.1038/s41477-023-01489-8. Epub 2023 Aug 10.

A multi-omic Nicotiana benthamiana resource for fundamental research and biotechnology

Affiliations

A multi-omic Nicotiana benthamiana resource for fundamental research and biotechnology

Buddhini Ranawaka et al. Nat Plants. 2023 Sep.

Erratum in

  • Author Correction: A multi-omic Nicotiana benthamiana resource for fundamental research and biotechnology.
    Ranawaka B, An J, Lorenc MT, Jung H, Sulli M, Aprea G, Roden S, Llaca V, Hayashi S, Asadyar L, LeBlanc Z, Ahmed Z, Naim F, de Campos SB, Cooper T, de Felippes FF, Dong P, Zhong S, Garcia-Carpintero V, Orzaez D, Dudley KJ, Bombarely A, Bally J, Winefield C, Giuliano G, Waterhouse PM. Ranawaka B, et al. Nat Plants. 2024 Jan;10(1):193. doi: 10.1038/s41477-024-01618-x. Nat Plants. 2024. PMID: 38182752 Free PMC article. No abstract available.

Abstract

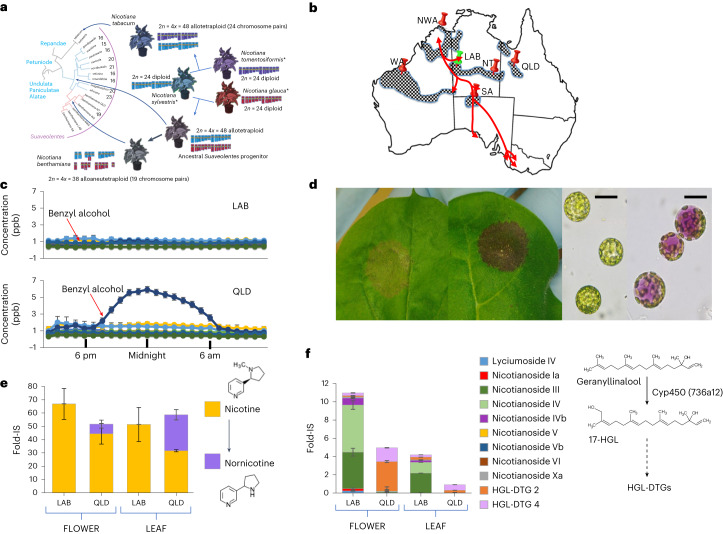
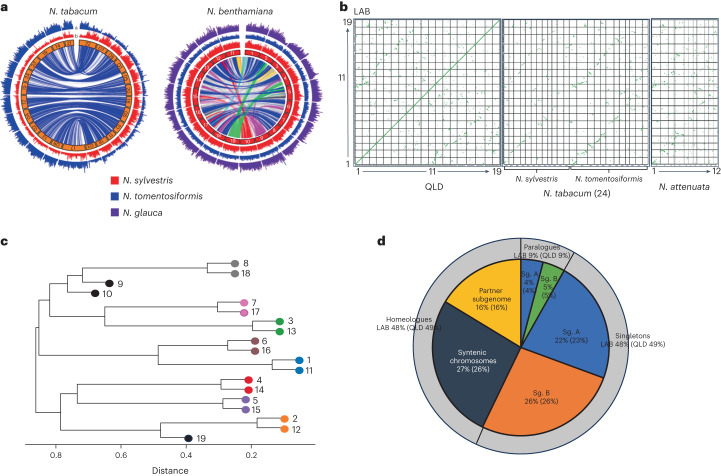
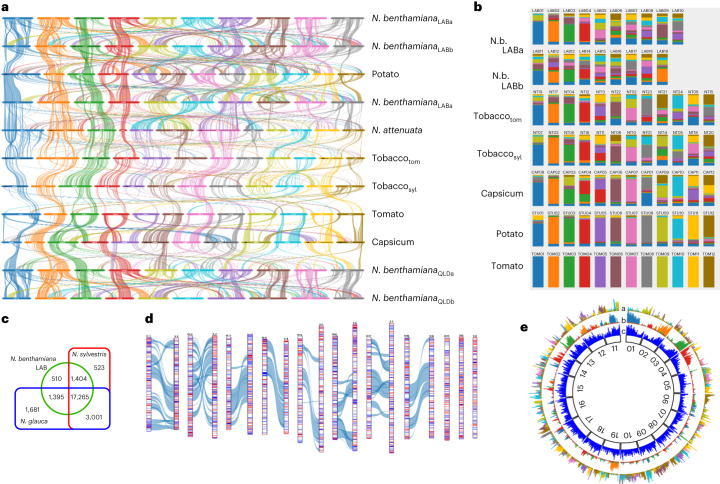
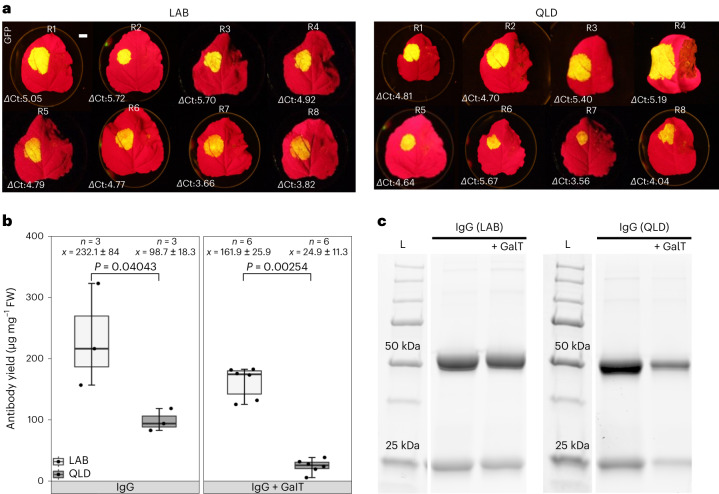
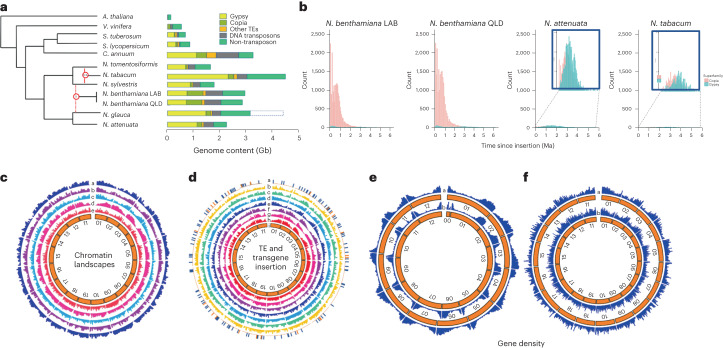
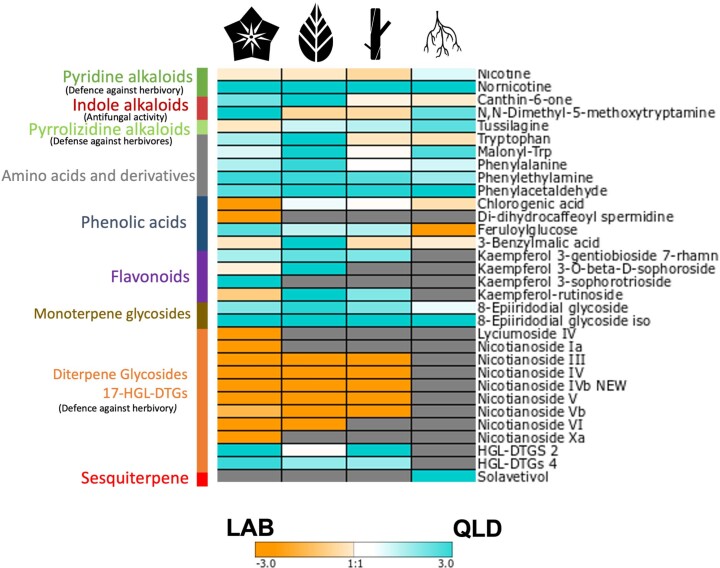
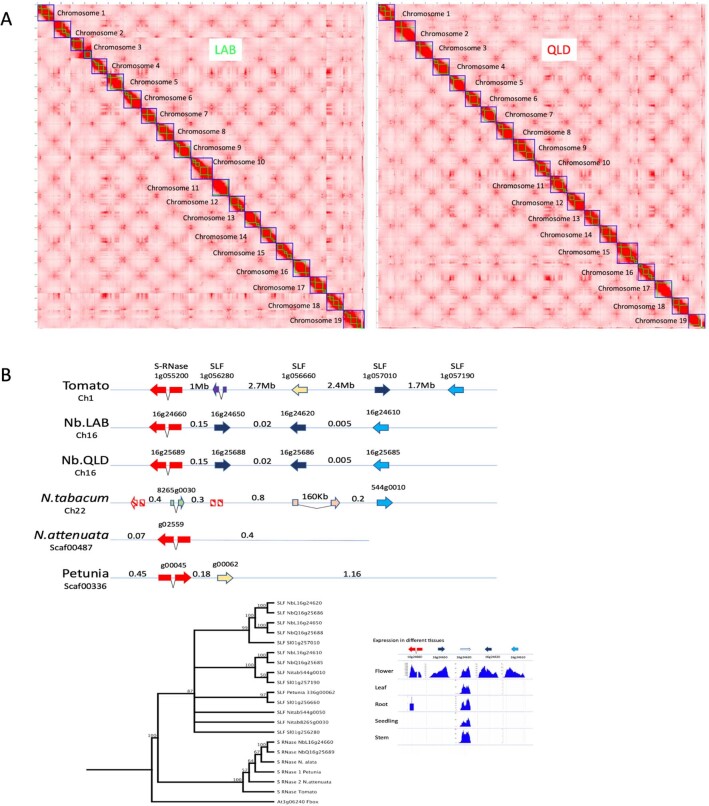
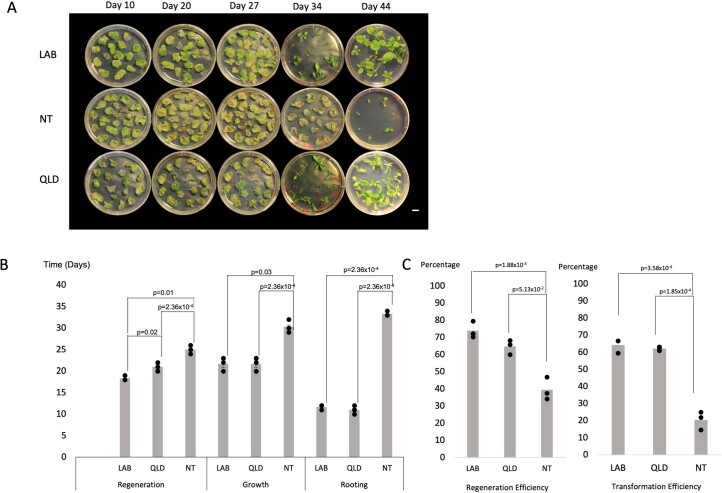
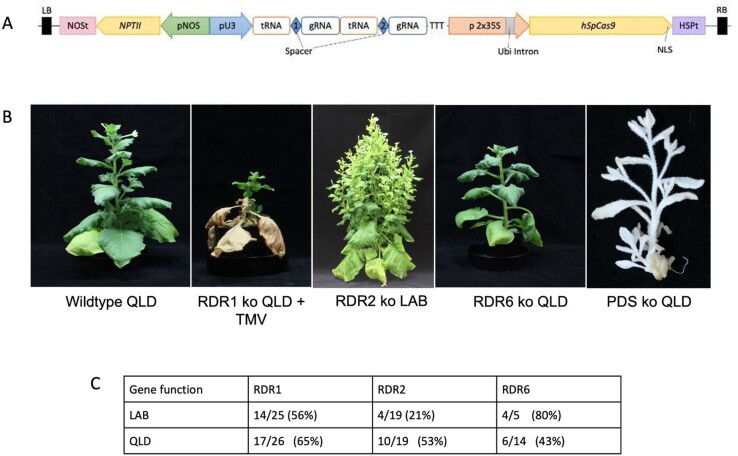
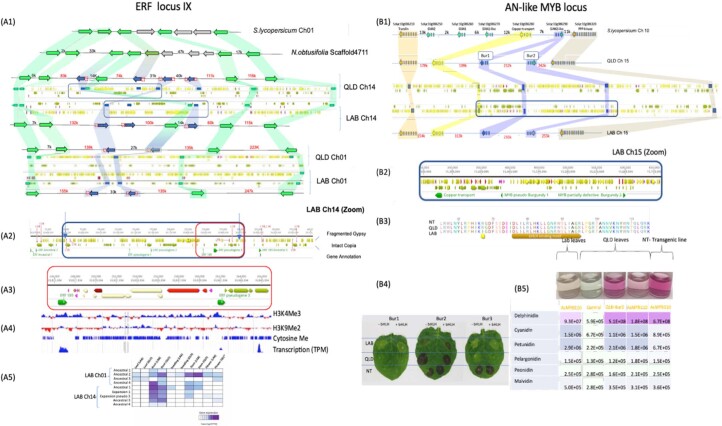
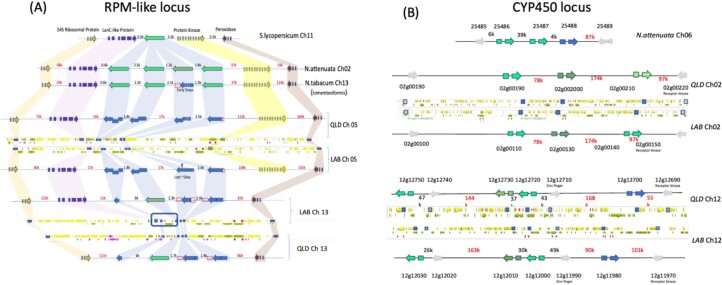
Nicotiana benthamiana is an invaluable model plant and biotechnology platform with a ~3 Gb allotetraploid genome. To further improve its usefulness and versatility, we have produced high-quality chromosome-level genome assemblies, coupled with transcriptome, epigenome, microRNA and transposable element datasets, for the ubiquitously used LAB strain and a related wild accession, QLD. In addition, single nucleotide polymorphism maps have been produced for a further two laboratory strains and four wild accessions. Despite the loss of five chromosomes from the ancestral tetraploid, expansion of intergenic regions, widespread segmental allopolyploidy, advanced diploidization and evidence of recent bursts of Copia pseudovirus (Copia) mobility not seen in other Nicotiana genomes, the two subgenomes of N. benthamiana show large regions of synteny across the Solanaceae. LAB and QLD have many genetic, metabolic and phenotypic differences, including disparate RNA interference responses, but are highly interfertile and amenable to genome editing and both transient and stable transformation. The LAB/QLD combination has the potential to be as useful as the Columbia-0/Landsberg errecta partnership, utilized from the early pioneering days of Arabidopsis genomics to today.


Conflict of interest statement

The authors declare no competing interests.

Figures

Fig. 1
Fig. 1. Phenotypic and biochemical diversity of N. benthamiana.
a, Proposed phylogeny and origin of the Suaveolentes section compared with other Nicotianas. Chromosome numbers are indicated for each Suaveolentes species. Species highlighted by an asterisk are extant relatives of the putative parents of N. benthamiana and N. tabacum. b, Distribution of N. benthamiana in Australia (chequered regions). The physical locations of isolated N. benthamiana accessions reported in this study are shown by pins, and traditional indigenous trading routes are shown by red lines. c, Profiles of average emission of selected floral volatile compounds from LAB and QLD over a 24-h period. Dark blue, benzyl alcohol. For other compounds see Extended Data Fig. 1. Data are presented as mean ± s.e.m. (n = 4 per sample point). d, Anthocyanin production 5 days after transient expression of AN-like MYB in LAB and QLD; right-hand panels show protoplasts isolated from LAB and QLD infiltrated patches (n = 5). Scale bar, 50 μm. e, Comparison of the accumulation of nicotine and nornicotine in flowers and leaves of LAB and QLD. The biochemical conversion of nicotine to nornicotine, mediated by the CYP82E demethylase (Extended Data Fig. 9), is shown on the right. Data are presented as mean ± s.e.m. (n = 4). f, Comparison of the accumulation of HGL-DTGs in flowers and leaves of LAB and QLD. The schematic biochemical pathway is shown on the right. Data are presented as mean ± s.d. (n = 4).
Fig. 2
Fig. 2. Subgenome and homeologue organization in N. benthamiana.
a, The left-hand Circos plot depicts the locations of the syntenic blocks (1 Mbp) of N. tomentosiformis (blue) and N. sylvestris (red) on the N. tabacum genome, highlighting the subgenomes and their respective contribution to the subgenome structure of this species. The right-hand Circos plot similarly locates the syntenic blocks of N. tomentosiformis (blue), N. sylvestris (red) and N. glauca (purple) on the N. benthamiana LAB genome, highlighting the difficulty in assigning ancestry for subgenomes in this species, which is characterized by extensive rearrangement of blocks between individual chromosomes. The lines in the centre join syntenic regions, highlighting the fragmentation of the N. benthamiana genome. b, Dot plot showing the relationship between the LAB and QLD chromosomes (central continuous line in the far-left panel) and the fragmented syntenic relationship between the subgenomes. Comparison of the N. tabacum genome consisting of two subgenomes with clear relationships to N. sylvestris and N. tomentosiformis revealed a fragmented relationship with N. benthamiana chromosomes. c, Dendrogram highlighting the chromosome pairs and the three orphan chromosomes (annotated 9, 10 and 19). d, Retention and relocation of homeologous genes in N. benthamiana LAB and QLD genomes. Percentage values outside and within parentheses are those for LAB and QLD, respectively, and show that about half of the original homeologous pairs have lost one member.
Fig. 3
Fig. 3. Gene block conservation across the Solanaceae and segmental allopolyploidization in N. benthamiana.
a, Waterfall plot showing the syntenic relationships between LAB, QLD and other related species as generated by SynVisio. b, Fraction of orthologous gene clusters in different Solanaceae chromosomes, highlighting a high conservation of chromosomes 1–4, and a declining conservation of remaining chromosomes; chromosome numbering largely follows the tomato–potato system. N.b., N. benthamiana. c, A Gibson Venn diagram showing the number of gene family clusters that are shared among LAB, N. sylvestris and N. glauca. d, Overlay of N. glauca (blue bars within chromosomes) and N. sylvestris (red) orthologous genes on LAB chromosomes. Grey/blue lines connecting chromosomes link syntenic blocks among the matched subgenome chromosomes. e, Circos plot of the physical distribution of syntenic blocks of tomato chromosomes 9–12 overlaid onto the LAB genome (track a), showing extensive fragmentation across the remaining LAB chromosomes. By contrast, an overlay of the syntenic blocks of tomato chromosomes 1–4 onto the LAB genome clearly demonstrates the conservation of both sequence and location (track b). Track c shows the gene density across the LAB chromosomes.
Fig. 4
Fig. 4. Comparison of transient expression in LAB and QLD of GFP by syringe agro-infiltration and antibody production by vacuum agro-infiltration.
a, Transient expression of GFP in LAB and QLD. Quantitative polymerase chain reaction cycle threshold (Ct) values were measured and ΔCt calculated as the difference in Ct between the gene of interest (GFP) and the reference gene (GAPDH) for each sample. GFP expression levels are represented underneath each leaf as ΔCt. All reactions were performed in triplicate for each complementary DNA sample. All experiments were performed in eight independent biological replicates. The average ΔCt of LAB and QLD was 4.8 and 4.7, respectively. Statistical analysis of the two-tailed Student’s t-test (P = 0.7972) and z-test (P = 0.9949) shows that there was no significant difference between GFP expression levels in the two ecotypes. Scale bar, 1 cm. b, Antibody concentration in total soluble protein extracts from LAB (white) and QLD (grey) ecotypes measured by protein A biolayer interferometry in μg mg−1 of tissue fresh weight (FW). P values were determined by Mann–Whitney U-test comparing between ecotypes. For ‘n’, samples are biologically independent transient infiltrations, sampled at 7 days post infiltration. Box and whisker plot interpretation: each box spans the interquartile range with the ends of the box being the upper and lower quartiles. The median is represented by a vertical line inside the box. Whiskers outside the box extend to the highest and lowest observations. GalT, galactosyl transferase; IgG, immunoglobulin G. c, SDS–polyacrylamide gel electrophoresis showing protein A-purified trastuzumab under reducing condition, similar results were observed in three independent replicates (n = 3). Source data
Fig. 5
Fig. 5. Transposon, epigenetic landscapes and gene density of N. benthamiana.
a, Relative complements of transposon and non-transposon content in Arabidopsis thaliana, Vitis vinifera and key Solanaceous and Nicotianas are presented as their calculated genome content in Gb. The dashed box for N. glauca indicates the genome size calculated from k-mer analysis (4.5 Gb), whereas the composition of the genome is based on the current assembly of 3.2–3.5 Gb. Many Gypsy-like sequences are present in the ‘other TE’ category in N. benthamiana. b, Estimated dates of LTR-retrotransposon insertion, calculated by sequence comparison between the LTRs of individual element insertions, in N. benthamiana LAB and QLD, compared with N. attenuata and N. tabacum. A clear and ongoing large burst of Copia element activity is evident in both LAB and QLD, which is absent in both N. attenuata and N. tabacum. The reported burst of Gypsy activity in Nicotianas appears to predate the 6 Ma limit of our analysis. c, A Circos plot depicting the chromatin landscape compared with gene content in LAB. Tracks a and b represent respectively the location of permissive histone marks H3K27ac and H3K4me3 within each LAB chr. Track c depicts the gene density across the LAB genome, whereas tracks d and e represent the location or repressive histone marks H3K9me2 and H3K27me3, respectively. d, Circos plot depicting the comparative locations of transgene insertions, LTR-retrotransposon insertion and methylation marks across LAB chromosomes. Track a, transgene insertion sites; red ‘ticks’ represent insertions derived from stable transformation, blue ‘ticks’ represent insertions derived from transient agro-infiltration. Track b, insertions of intact Copia TEs (containing matching LTRs and complete internal sequences). Track c, insertion of all annotated Copia TEs, including fragmented elements. Track d, distribution of CHH methylation marks. Track e, gene density across the LAB genome. Track f, insertions of all annotated Gypsy TEs, including fragmented elements. Track g, distribution of CG methylation marks. Track h, distribution of CHG methylation marks. The innermost circle represents the numbered chromosomes. e, Distribution of gene densities on the chromosomes of potato (inner circle) and tomato (outer circle). f, Distribution of gene densities on the chromosomes of LAB (inner circle) and QLD (outer circle) genomes.
Extended Data Fig. 1
Extended Data Fig. 1. Profiles of average emission of selected putative insect-attracting volatile compounds and nicotine.
Profiles of average emission of selected putative insect-attracting volatile compounds and nicotine (a defence compound) in green leaf and floral headspace of LAB and QLD over a 24-hr period. (A) LAB floral headspace (B) QLD floral headspace (C) LAB green leaf headspace (D) QLD green leaf headspace. These results indicate that QLD flowers, but not LAB flowers or LAB and QLD leaves, emit benzyl alcohol overnight (6:00 pm–8:00 am). Error bars represent the standard error of the mean (n = 4 per sample point).
Extended Data Fig. 2
Extended Data Fig. 2. Differentially accumulated metabolites in semi-polar extracts of tissues from N. benthamiana LAB and QLD.
Differentially accumulated metabolites in semi-polar extracts of N. benthamiana LAB vs QLD tissues analysed by liquid chromatography/high resolution mass spectrometry (LC/HESI/MS). The degree of orange/blue indicates relative levels in LAB vs QLD, grey shaded areas not detectable levels.
Extended Data Fig. 3
Extended Data Fig. 3. Cladogram of relationships of the nicotine demethylase genes in S. lycopersicum N. sylvestris, N. tabacum, N. tomentosiformis, N. attenuata, and N. benthamiana (LAB and QLD).
Cladogram of relationships of the nicotine demethylase genes in S. lycopersicum, N. sylvestris, N. tabacum, N. tomentosiformis, N. attenuata, and N. benthamiana (LAB and QLD). The highlighted clade contains the N. benthamiana CYP82E2 gene. Genes without stars represent proteins of uncharacterized nicotine N-demethylase activity. (B) Location of bZIP transcription factor binding motifs (red and purple triangles) in LAB and QLD 2kb promoter. The bottom panel shows the transversion in the third TF binding motif (purple triangles) that probably inhibits TF binding and expression of CYP82E2 in LAB. (C) Gene expression (TPM) of CYP82E2 in leaf and flower tissues of LAB and QLD. Error bars represent the standard error of the mean (n=3 biologically independent flower and leaf samples of LAB and QLD).
Extended Data Fig. 4
Extended Data Fig. 4. (A).Plot of contact matrices of LAB and QLD assemblies. (B).Synteny of Self-incompatibility (S)-like loci in tomato, N. attenuata, N.tabacum, petunia, LAB and QLD, cladogram of gene sequence similarities and tissue- expression of mRNA LAB S-locus genes.
(a) Plot of contact matrices of LAB and QLD assemblies. Juicebox plot from HiC analysis showing resolution into 19 contiguous elements (chromosomes) for both LAB and QLD assemblies. (b) Synteny of self-incompatibility (S)-like loci in tomato, N. attenuata, N.tabacum, petunia, LAB and QLD, cladogram of protein gene sequence similarities and tissue-specific mRNA expression of the LAB S-locus. Gene arrangement and relationships in cartoon form of the genes in the highly recombinogenic S-locus (comprised of an S-RNAse and associated multiple copies of F-box (SLF) proteins) in the most advanced genome assemblies of tomato, N. attenuata, N.tabacum, petunia, LAB and QLD. The colours of the genes represent their relationships across species, as indicated in the cladogram. The analysis shows contiguity of the S-locus in tomato, LAB and QLD and the fragmented nature of the locus in N. attenuata, Petunia axillaris, due to their presence on small scaffolds, and the incomplete assembly of Ch22 in N.tabacum. Tissue expression data for LAB shows that the intervening gene 16g24630 is expressed in all 5 tissues examined but the S-RNAse and SLF genes are expressed only in the floral tissue, as expected for a floral incompatability-associated locus. Distances between genes are indicated in Mb.
Extended Data Fig. 5
Extended Data Fig. 5. miRNA families in LAB and QLD shared with A. attenuata, S. lycopersicum, and S. tuberosum.
The number of identified miRNA families in LAB and QLD that are shared with three Solanaceae plants (A. attenuata, S. lycopersicum, and S. tuberosum) and the well-studied plant Arabidopsis (A. thaliana) are illustrated in a Venn diagram. The figure shows that the major miRNAs in the most related plant, N. attenuata, were identified in both LAB and QLD. Many potential miRNAs were discovered that have not been previously identified. Subfigure (a) shows the overlapping number of identified miRNAs in LAB that are shared with the other four species. Subfigure (b) shows the identified miRNAs in QLD.
Extended Data Fig. 6
Extended Data Fig. 6. Transformation efficiencies of  LAB, QLD and Northern Territory (NT) accessions.
Comparison of transformation efficiencies of LAB, QLD and Northern Territory (NT) accessions. (a) Regeneration, selection, shoot development, and root development of LAB, NT and QLD ecotypes post-transformation with a 35S:Cas9 cassette and kanamycin selectable marker (scale bar represents 1 cm). The dates on top of the image indicate the progression of transformation. (b) Comparison of time taken for regeneration, growth (1-2 cm shoots) and rooting of LAB, QLD and NT. ANOVA two-tailed test was performed to determine the significance differences. (Data are presented as mean values +/− standard error (n=3 biologically independent samples). (C) Comparison of regeneration frequency and transformation efficiency of LAB, QLD and NT. ANOVA two-tailed test without transformation was performed to determine the significance differences between percentage data derived from count data. Independent positive transformants of LAB n=72, QLD n=74 and NT n=21 (a single sister plant derived from one single callus) were used to calculate the transformation efficiency.
Extended Data Fig. 7
Extended Data Fig. 7. Comparison of CRISPR/Cas9 editing efficiency in LAB and QLD.
(a) The basic editing construct (with kanamycin selection) used to transform LAB or QLD tissues. The two guide (g)RNA sequences were placed between the tRNA processing units (indicated as spacer sequences 1 & 2 in panel A). Two sites were chosen within the same target gene, usually ~200 nucleotides apart, and gave either a dropout of the intervening DNA sequence in the genome or inaccurate repair of one or both sites. (b) Phenotypes of QLD knockouts (ko) of RDR1 infected with Tobacco mosaic virus (TMV), RDR6 and Phytoene desaturase (PDS) and LAB knockout of RDR2. Silencing of PDS in QLD targeted two homoeologs simultaneously to give biallelic silencing of both genes in the T0 generation. gRNA sequences used: RNA-dependent RNA polymerase (NbRDR1): TAAATAGTACAGTTTCTCCA; GACACTCAAAGTTTCTCTGG. NbRDR2: CCACTCCCAACGTAGATAAG; GTGTCTCGAAATGTGCTGCA. NbRDR6: CTTACTTAGAAGTCATCAGG; CTGCAACAGTATTACCAAAG. Phytoene desaturase (NbPDS) TCACAAACCGATATTGCTGG; GAGCTTCAGGAAAATCAAAG. (c) Comparison of editing efficiency of LAB and QLD. Editing efficiency in LAB and QLD was determined using the NbRDR genes involved in RNAi.
Extended Data Fig. 8
Extended Data Fig. 8. Comparison of ERF locus IX and AN-like MYB loci in LAB and QLD with other Solanaceae.
(A1) Synteny analysis of the ERF locus IX in tomato, N. obtusifolia, LAB and QLD shows lineage-specific tandem duplications of ERF189s, advanced diploidization through loss of gene function, and an inversion between LAB and QLD on chr 14, flanked by newly inserted Copia elements. Functional genes are shown in green; nonfunctional/pseudogenes are in blue. Gypsy, Copia and LTRs are indicated as yellow, olive green and red arrows respectively. Shading indicates the orthology relationships of ERF189 genes between different syntenic blocks. The inverted region of LAB chromosome 14 and the Gypsy and Copia landscape within the blue box is magnified in the second panel (A2). The third panel (A3) is further magnifying the region indicated by a red box in (A2). The fourth panel (A4) depicts the epigenetic landscape (H3K4me3, H3K9me2 and cytosine methylation) and the expression of selected ERF189 genes in LAB. For H3K4me3, H3K9me2 enriched regions are shown in blue and the lack of histone modification is in red. Methylated cytosines are shown as blue bars. (A5) Tissue-specific gene expression of Ancestral (the left-most and right-most two genes indicated in green in N. obtusifolia) and ‘Expansion’ (the three green genes in the middle of N. obtusifolia) genes. (B1) Synteny analysis of the AN-like locus in tomato, LAB and QLD shows tandem duplication of SlAN2-like MYB genes in LAB and QLD with loss of gene function of 1 copy in QLD (Bur1) and both copies (Bur 1 & 2) in LAB. Loss of Bur2 in LAB is associated with a newly inserted Copia element. Functional genes are shown in bright green, and nonfunctional/pseudogenes are in dark green. Gypsy, Copia and LTRs are indicated as yellow, olive green and red arrows respectively. Shading indicates the orthology relationships. The Gypsy and Copia landscape within the blue box are zoomed in the second panel (B2) The third panel (B3) shows the amino acid change in LAB Bur2 which alters its bHLH binding site. (B4) shows the function of Bur1 is defective in LAB, QLD and NT, and that Bur2 is fully active in QLD and NT and may be partially restored by simultaneous overexpression of bHLH in LAB. Bur3 is only functional in NT. (B5) Levels of different anthocyanins in LAB and QLD leaves following transient expression of AcMYB110 (an AN-like MYB from Kiwifruit) or QLD Bur2. For comparison, the Anthocyanin levels were measured in NT stably transformed with an AcMYB110 construct.
Extended Data Fig. 9
Extended Data Fig. 9. Comparison of RPM1-like locus and Cytochrome P450  loci in LAB and QLD with other Solanaceae.
(a) Synteny of RPM1-like loci in tomato, N. attenuata, N.tabacum, LAB and QLD. (b) Synteny of a terpene biosynthesis pathway Cytochrome P450 locus in N. attenuata, LAB and QLD. Gene arrangement in cartoon form representing RPM1-like bacterial resistance genes  and CYP736A-like genes (functional - bright green), possibly functional (dark green), defective/pseudogenes (blue). In (A), distances between genes indicated (black text)< 15kbp; (red text) >15kbp and surrounding syntenic genes in are shown in orange, purple, yellow and brown. Orthology/homology relationships are indicated by coloured shading. In (B), distances between genes indicated (black text)< 50kbp; (red text) >50kbp. TE annotation tracks for LAB and QLD were prepared using annotation data from the EDTA TE annotation pipeline (see online Methods) and Geneious Prime software (Geneious Prime 2023.0.1; https://www.geneious.com). Only LTR-transposable elements are shown. Yellow blocks represent GYPSY elements and green blocks represent COPIA elements. The size of each block is proportional to the number of base-pairs annotated for that element. Red triangles represent LTR repeat regions that flank either a GYPSY or COPIA element. These elements are likely to be nearly complete and can be considered possible autonomous elements. The rectangular red blocks flank unknown LTR-TE elements. Unknown TEs are elements that are recognized as an LTR element but are not able to be classified as either a COPIA or GYPSY element due to irregularities in internal sequences for that element. These are likely to represent non-autonomous elements. Those elements not flanked by LTR sequences are highly fragmented nonfunctional elements. The blue rectangular boxes highlight the location of the genes annotated in the tracks above and below the TE annotation tracks.

References

    1. Knapp S, Bohs L, Nee M, Spooner DM. Solanaceae—a model for linking genomics with biodiversity. Comp. Funct. Genomics. 2004;5:285–291. doi: 10.1002/cfg.393. - DOI - PMC - PubMed
    1. Narayan RKJ. Nuclear DNA changes, genome differentiation and evolution in Nicotiana (Solanaceae) Plant Syst. Evol. 1987;157:161–180. doi: 10.1007/BF00936195. - DOI
    1. Clarkson JJ, Kelly LJ, Leitch AR, Knapp S, Chase MW. Nuclear glutamine synthetase evolution in Nicotiana: phylogenetics and the origins of allotetraploid and homoploid (diploid) hybrids. Mol. Phylogenet. Evol. 2010;55:99–112. doi: 10.1016/j.ympev.2009.10.003. - DOI - PubMed
    1. Marks CE, Ladiges PY, Newbigin E. Karyotypic variation in Nicotiana section Suaveolentes. Genet. Resour. Crop Evol. 2011;58:797–803. doi: 10.1007/s10722-011-9724-3. - DOI
    1. Bally J, et al. Nicotiana paulineana, a new Australian species in Nicotiana section Suaveolentes. Aust. Syst. Bot. 2021;34:477–484. doi: 10.1071/SB20025. - DOI