. 2023 Sep;5(9):1544-1562.
doi: 10.1038/s42255-023-00861-4. Epub 2023 Aug 10.

Metabolic rewiring induced by ranolazine improves melanoma responses to targeted therapy and immunotherapy

Affiliations

Metabolic rewiring induced by ranolazine improves melanoma responses to targeted therapy and immunotherapy

Marta Redondo-Muñoz et al. Nat Metab. 2023 Sep.

Abstract

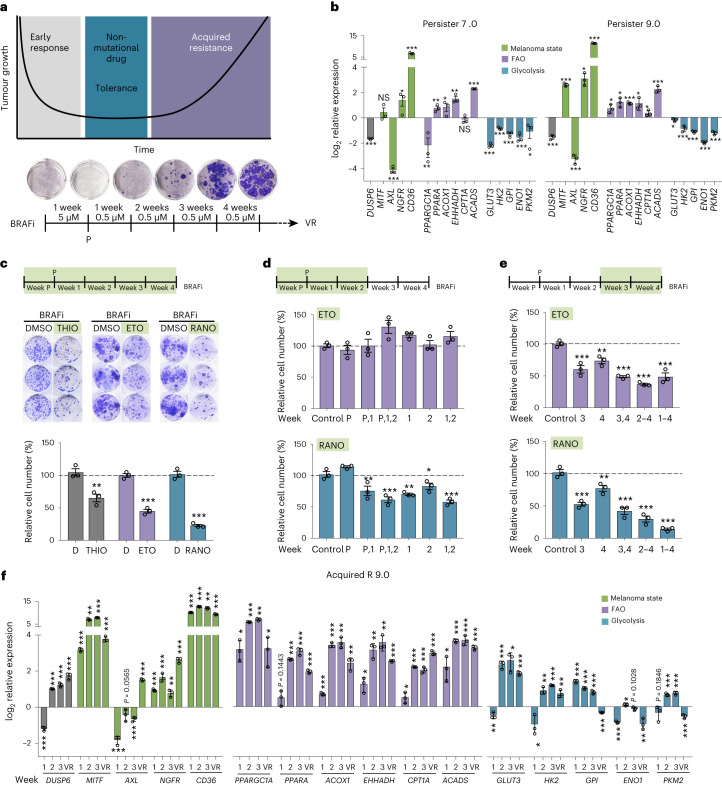
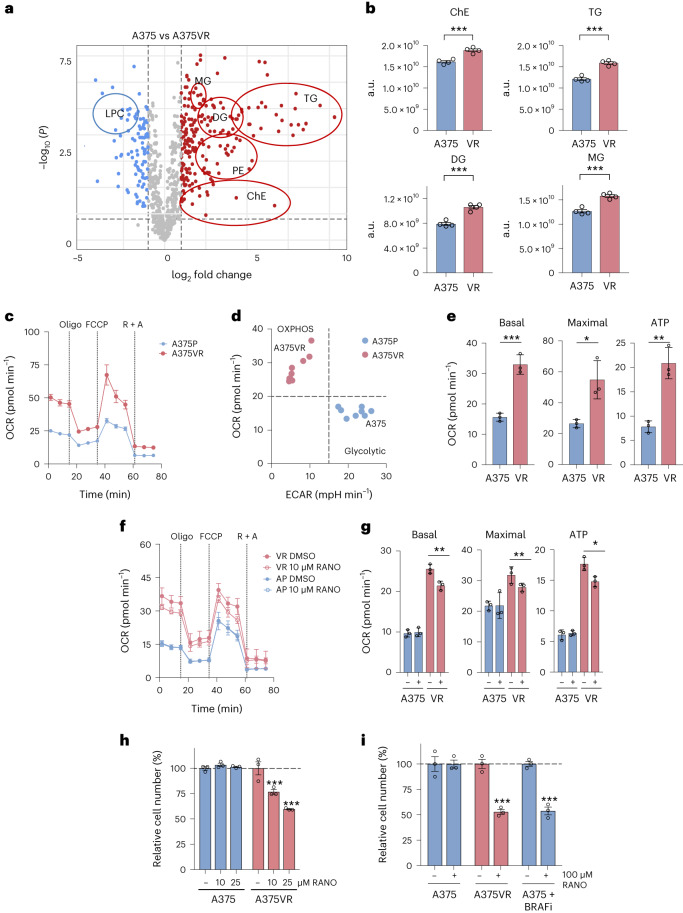
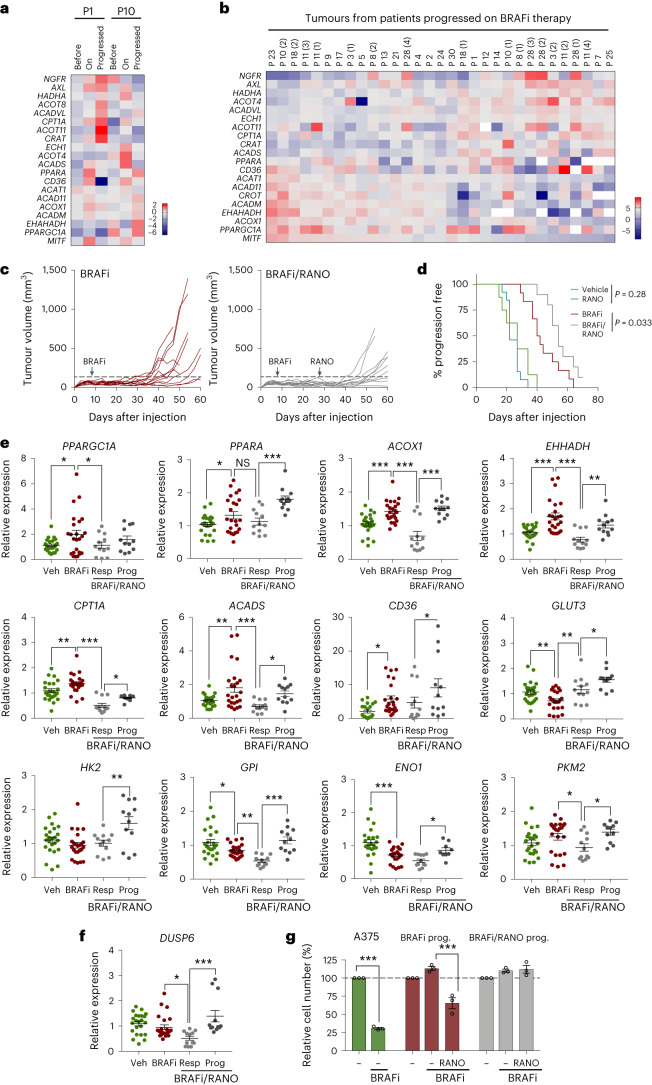
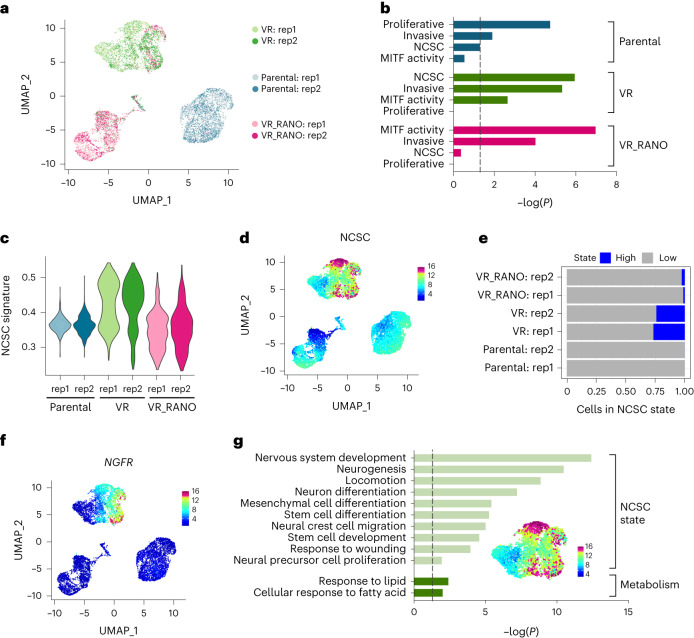
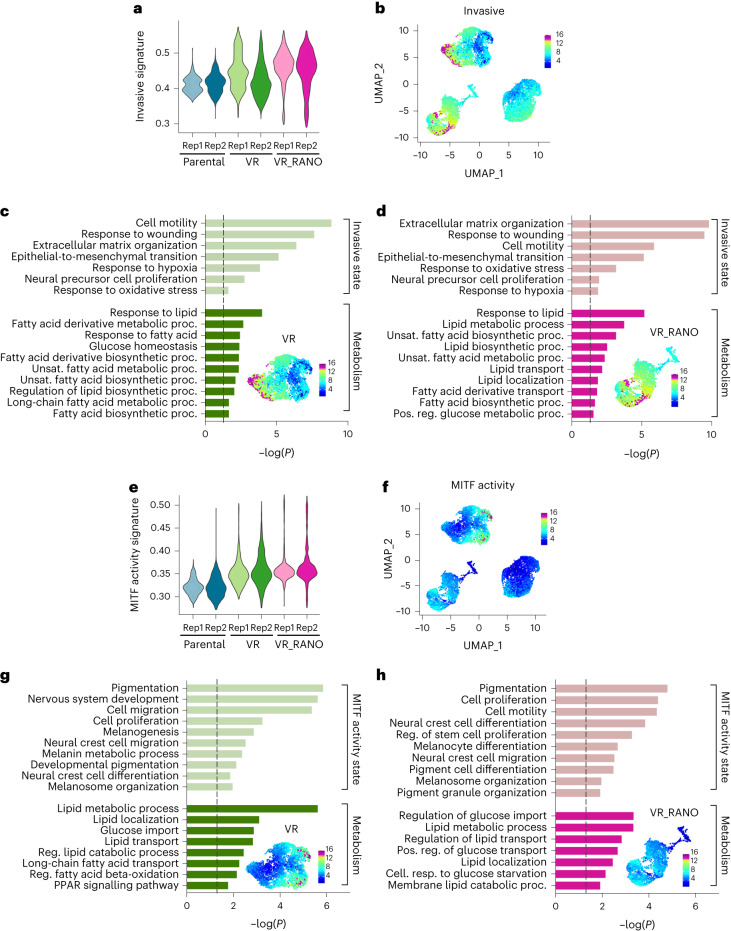
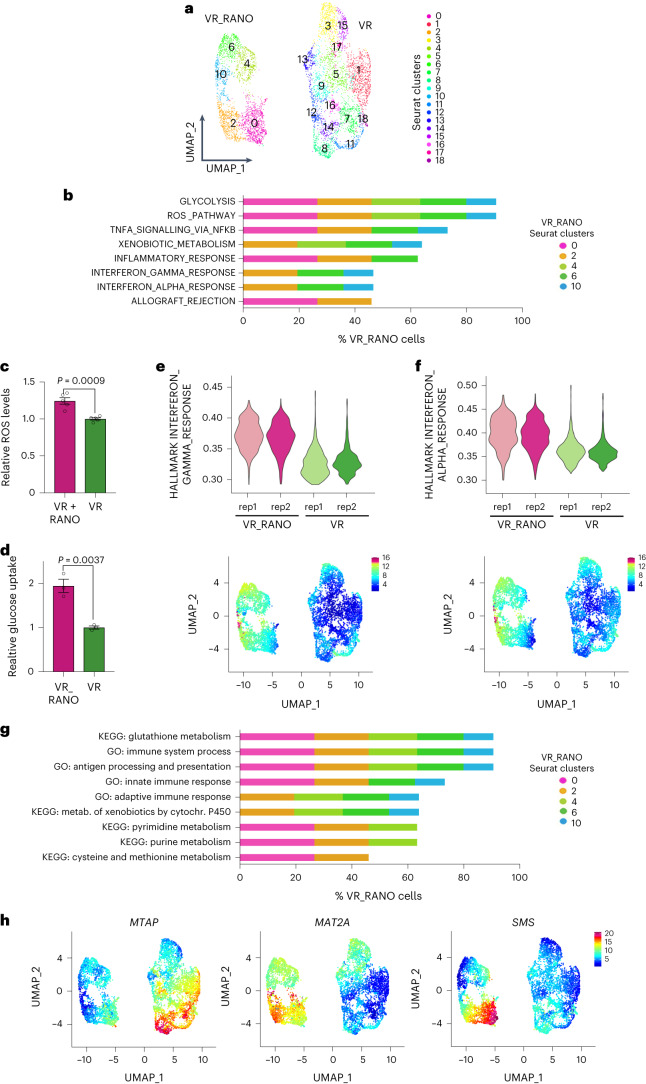
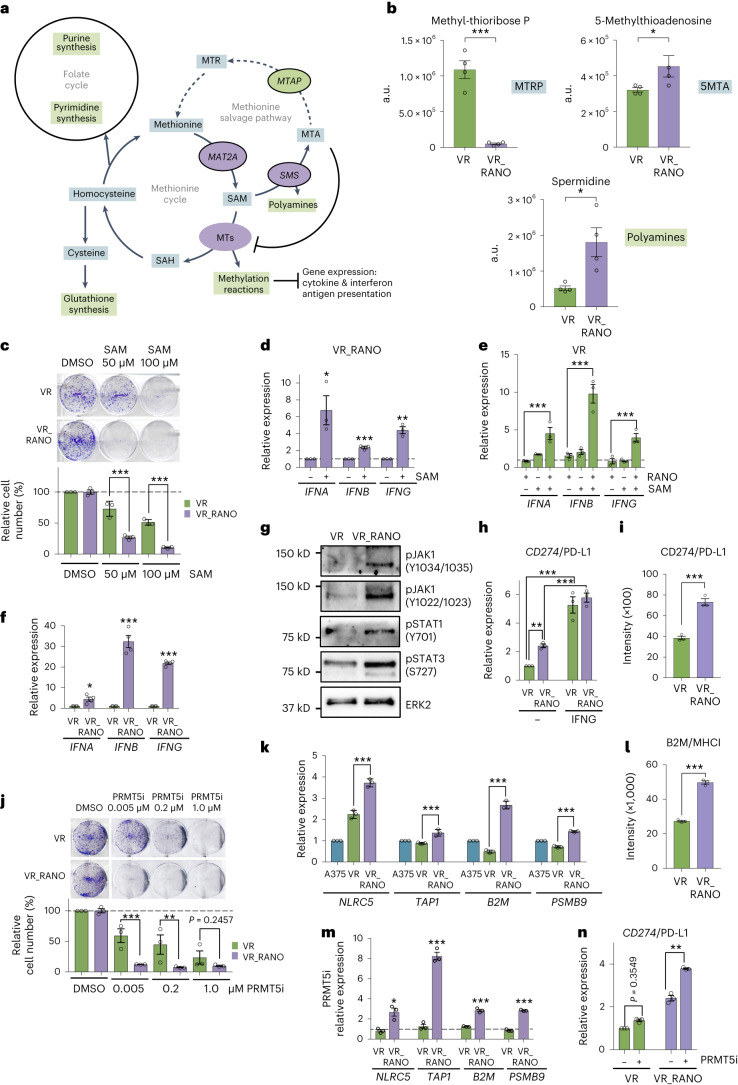
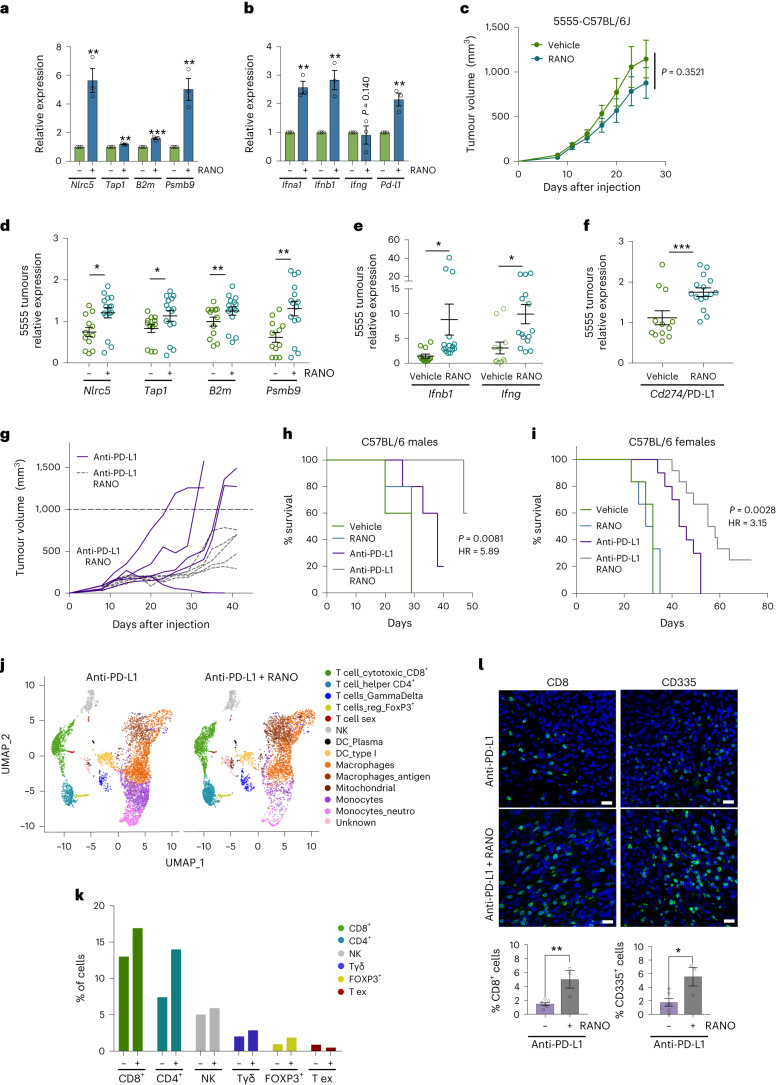
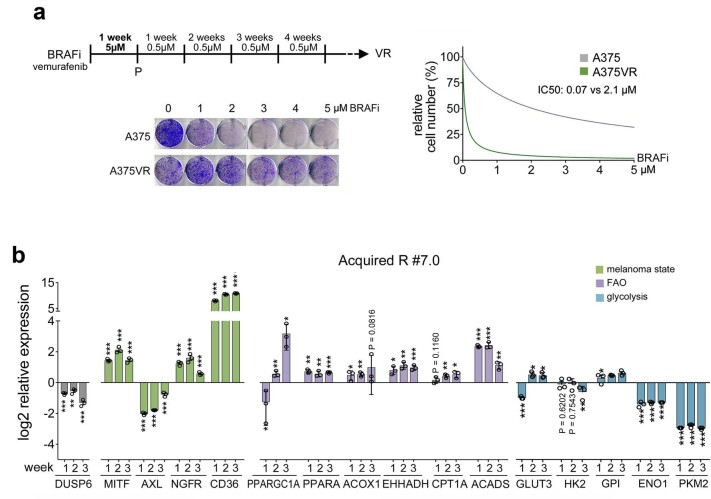
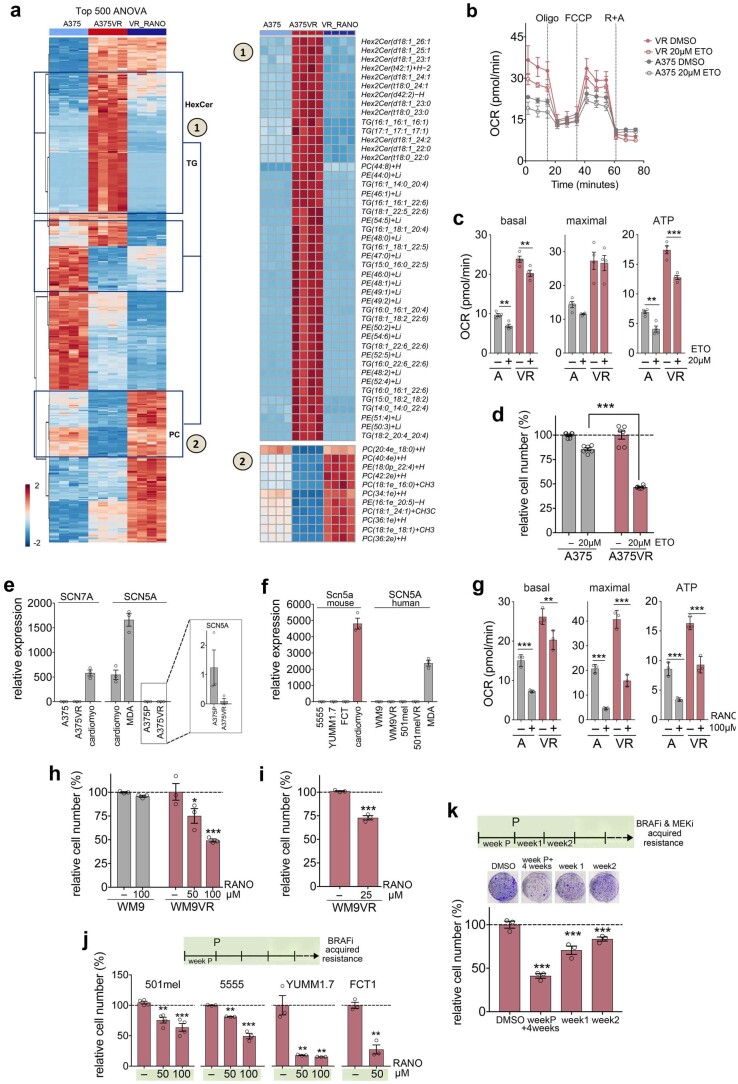
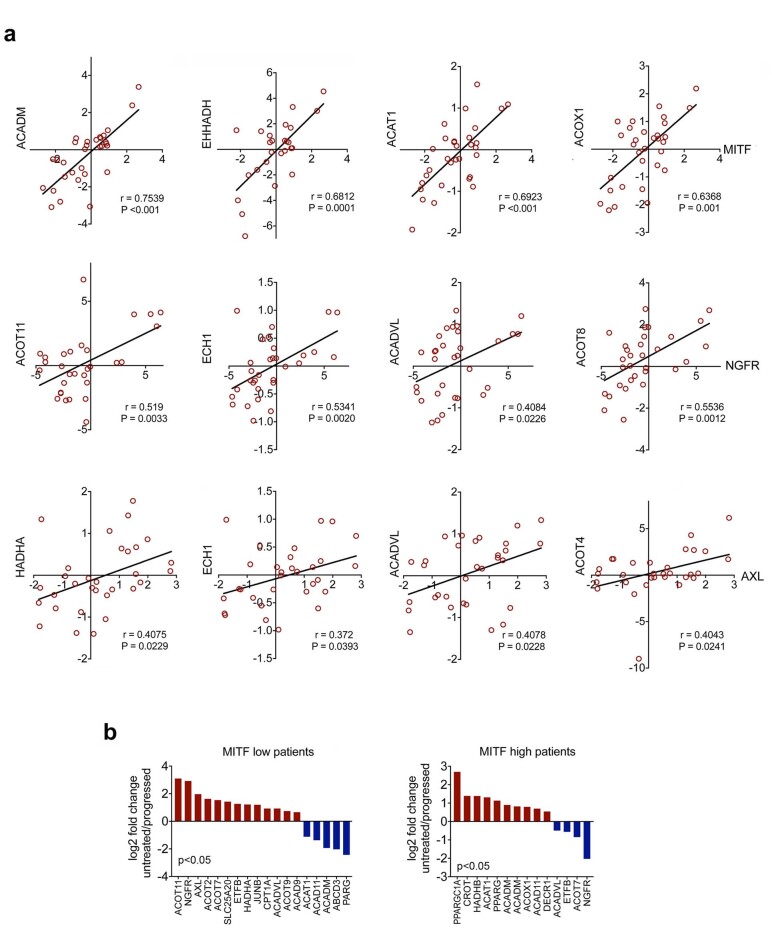
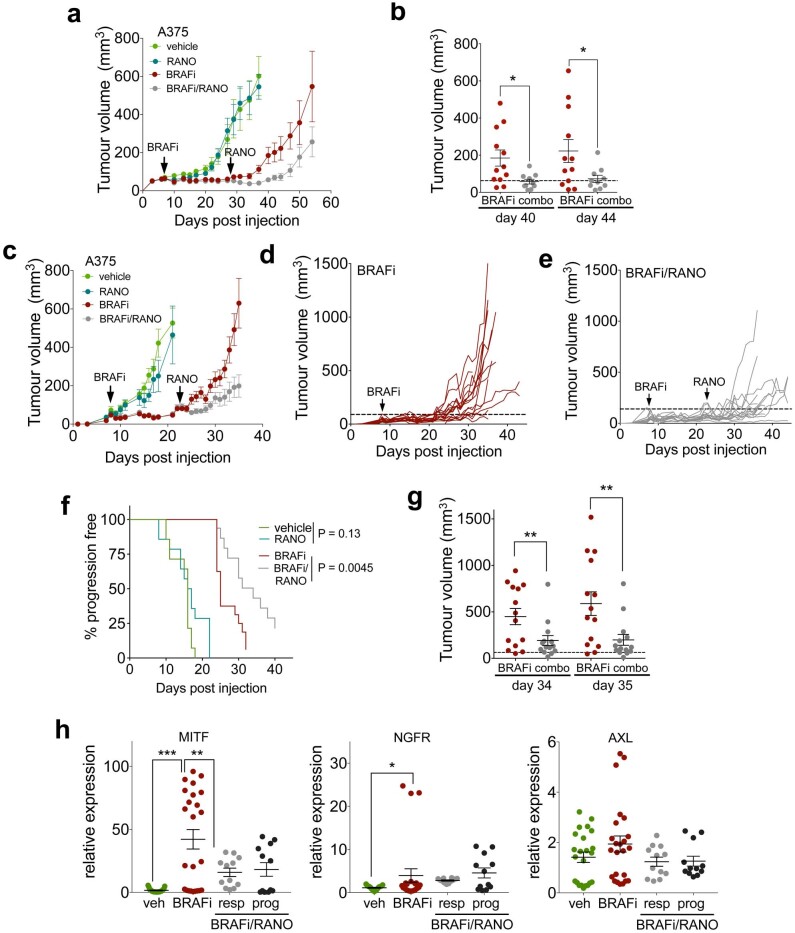
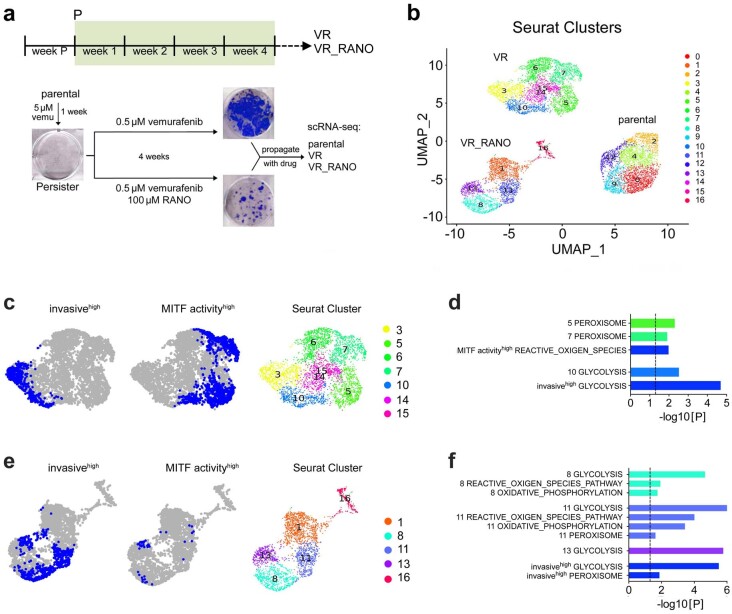
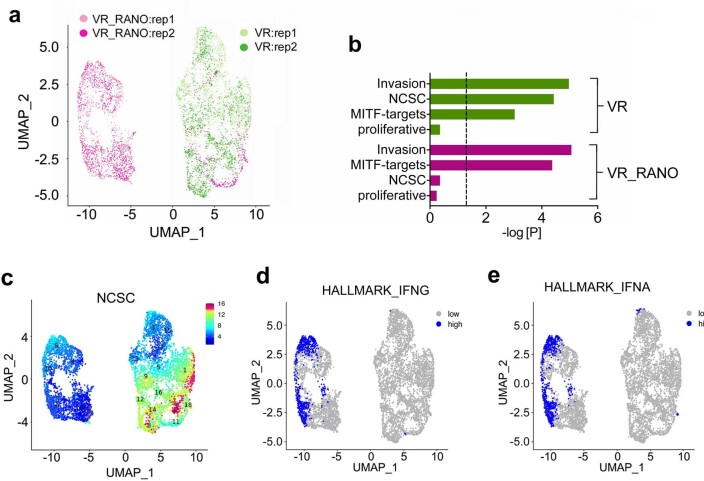
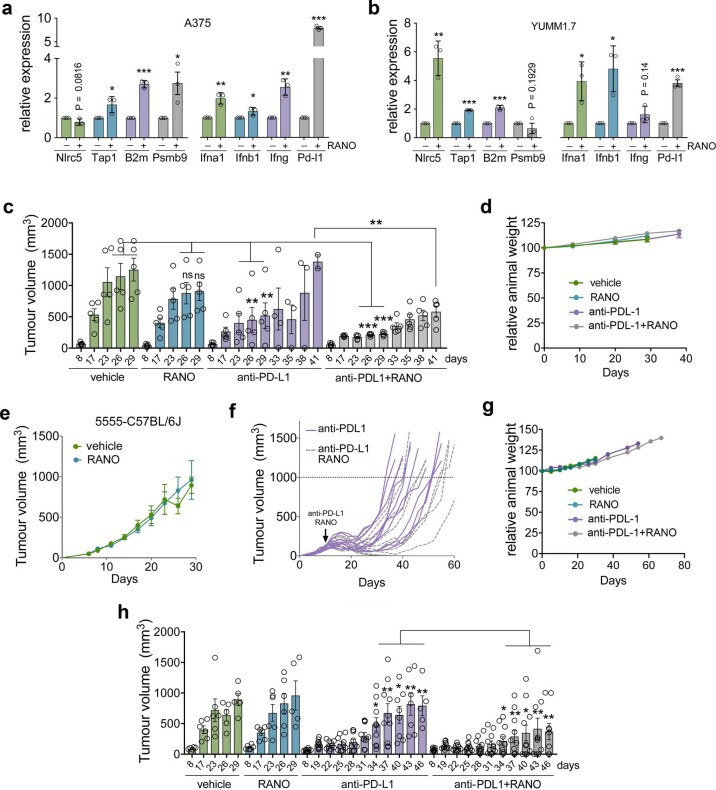
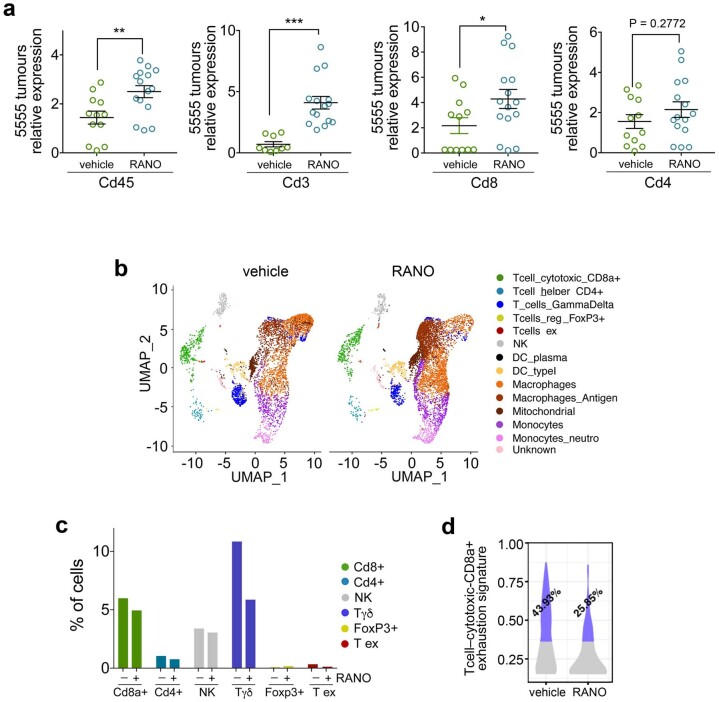
Resistance of melanoma to targeted therapy and immunotherapy is linked to metabolic rewiring. Here, we show that increased fatty acid oxidation (FAO) during prolonged BRAF inhibitor (BRAFi) treatment contributes to acquired therapy resistance in mice. Targeting FAO using the US Food and Drug Administration-approved and European Medicines Agency-approved anti-anginal drug ranolazine (RANO) delays tumour recurrence with acquired BRAFi resistance. Single-cell RNA-sequencing analysis reveals that RANO diminishes the abundance of the therapy-resistant NGFRhi neural crest stem cell subpopulation. Moreover, by rewiring the methionine salvage pathway, RANO enhances melanoma immunogenicity through increased antigen presentation and interferon signalling. Combination of RANO with anti-PD-L1 antibodies strongly improves survival by increasing antitumour immune responses. Altogether, we show that RANO increases the efficacy of targeted melanoma therapy through its effects on FAO and the methionine salvage pathway. Importantly, our study suggests that RANO could sensitize BRAFi-resistant tumours to immunotherapy. Since RANO has very mild side-effects, it might constitute a therapeutic option to improve the two main strategies currently used to treat metastatic melanoma.


Conflict of interest statement

The authors declare no competing interests.

Figures

Fig. 1
Fig. 1. Fatty acid oxidation is upregulated during BRAFi-acquired resistance development.
a, Protocol for monitoring the establishment of vemurafenib (BRAFi) resistance. P, persister; VR, vemurafenib resistant. b, Quantitative PCR (qPCR) analysis of the indicated genes in BRAFi persister cells. Shown are expression data from persister cells from two independent acquired resistance experiments (7.0 and 9.0) relative to untreated cells. Data are presented as the mean ± s.d. based on n = 3 sample replicates analysed by two-tailed unpaired t-test. *P < 0.05; **P < 0.01; ***P < 0.001. c, Colony formation assay (CFA) quantification for A375 cells treated with BRAFi in the absence (dimethylsulfoxide (DMSO)) or presence of 2 µM THIO, 100 µM ETO or 100 µM RANO added once per week. Data are presented as the mean ± s.e.m. based on n = 3 biological replicates analysed by two-tailed unpaired t-test. **P < 0.01; ***P < 0.001. d,e, CFA quantification of A375 cells treated with BRAFi in the absence (control) or presence of ETO or RANO added once per week during the early (d) or late (e) stage of treatment as indicated. Data are presented as the mean ± s.e.m. based on n = 3 biological replicates analysed by one-way analysis of variance (ANOVA) with Dunnett’s multiple-comparisons test. *P < 0.05; **P < 0.01; ***P < 0.001. f, qPCR analysis of the indicated genes in A375 cells treated with BRAFi. Shown is the expression at weeks 1, 2 and 3 after the establishment of persister 9.0 and in BRAFi-resistant VR 9 cells relative to untreated cells. Data are presented as the mean ± s.d. based on n = 3 sample replicates analysed by two-tailed unpaired t-test. *P < 0.05; **P < 0.01; ***P < 0.001. NS, not significant. Source data
Fig. 2
Fig. 2. Ranolazine reduces mitochondrial respiration in BRAFi-resistant cells.
a, Volcano plot showing the log2 fold change of lipids in A375 versus A375VR cells (LPC: lysophosphatidylcholine; MG, monoacylglycerols; DG, diacylglycerols; TG, triacylglycerols; PE, phosphatidylethanolamines and ChE, cholesterol esters). b, Total levels (integrated peak areas; a.u., arbitrary units) of lipids divided by classes in A375 versus A375VR cells. Data are presented as the mean ± s.e.m. based on n = 4 biological replicates analysed by two-tailed unpaired t-test. ***P < 0.001. c, Representative oxygen consumption rate (OCR) of A375 and A375VR cells. Oligo, oligomycin; FCCP, carbonyl cyanide-p-trifluoromethoxyphenylhdrazone; R, rotenone; A, antimycin A. Data are shown as the mean ± s.d. with n = 3 replicate wells. d, Basal OCR of A375VR and A375 cells was plotted against their basal extracellular acidification rate (ECAR). Data are from n = 3 biological replicates of three replicate wells. e, Basal or maximal respiration and ATP production in A375 and A375VR cells. Data are presented as the mean ± s.d. based on n = 3 replicate wells analysed by two-tailed unpaired t-test. **P < 0.01; ***P < 0.001. f,g Representative OCR (f) and basal or maximal respiration and ATP production (g) of A375 and A375VR cells in the absence (DMSO) or presence of 10 µM RANO. Data are shown as the mean ± s.d. based on n = 3 replicate wells and analysed by one-way ANOVA with uncorrected Fisher’s least significant difference (LSD). *P < 0.05; **P < 0.01. h,i Relative cell number of A375 or A375VR cells (h) treated daily with 10 µM or 25 µM RANO or treated once per week with 100 µM RANO with or without 0.5 µM BRAFi (i) as indicated. Control cells were treated with DMSO. Data are presented as the mean ± s.e.m. based on n = 3 biological replicates and analysed by one-way ANOVA with Sidak’s multiple-comparisons test. ***P < 0.001. Source data
Fig. 3
Fig. 3. Ranolazine delays BRAFi-acquired resistance in vivo.
a,b, Analysis of publicly available gene expression datasets GSE61992 (ref. ) and GSE50509 (ref. ). Data from 2 patients (GSE61992) before and on treatment, and at the time of progression (a) or 31 tumours from 21 patients (GSE50509) before treatment and at the time of progression (b) were analysed for expression of the indicated genes. For b, the log2 fold change at the time of progression relative to ‘before’ is shown. The number of individual tumours from patients with more than one tumour is indicated in brackets. c, Growth curves of individual tumours from female mice treated with BRAFi alone (25 mg per kg body weight, daily on day 7) or with BRAFi and RANO (50 mg per kg body weight, daily), which was added at day 28 when BRAFi-treated tumours showed a reduced response to treatment. n = 12 tumours in each group. d, Kaplan–Meier plots of progression-free survival of female mice treated as indicated. Progression was declared when tumours exceeded a volume of twice the average volume of day 7, when BRAFi treatment commenced (dashed line). Log-rank (Mantel–Cox) test: BRAFi versus BRAFi/RANO hazard ratio (HR) = 2.88. e,f qPCR analysis of the indicated genes in A375 tumours from female mice treated as indicated. Data are triplicates from n = 8 tumours for vehicle or BRAFi, and n = 4 tumours for RANO responder (resp) or RANO progressed (prog), respectively, and are presented as the mean ± s.e.m. analysed by one-way ANOVA with uncorrected Fisher’s LSD. *P < 0.05; **P < 0.01; ***P < 0.001. g, Relative cell number of cell cultures established from tumours progressed on BRAFi or BRAFi/RANO treated with BRAFi in the absence (DMSO) or presence of RANO. A375 cells served as the control. Data are presented as the mean ± s.e.m. based on n = 3 biological replicates analysed by one-way ANOVA with Sidak’s multiple-comparisons test. ***P < 0.001. Source data
Fig. 4
Fig. 4. Ranolazine diminishes the neural crest stem cell state.
a, Uniform manifold approximation and projection (UMAP) visualization of 10,133 cells coloured by treatment groups and replicate. b, Melanoma cell states according to Rambow et al. enriched (hypergeometric tests) in the top gene markers of each treatment group. The dashed line indicates P = 0.05. c, NCSC signature scores represented by violin plots. d, UMAP plot coloured by the expression of the NCSC state. e, Discrete expression of the NCSC state based on the 90th percentile of signature scores across the whole dataset. f, UMAP plot coloured by the expression of NGFR. g, GOBP terms enriched (hypergeometric tests) in the subset of genes (top 200) most highly correlated to the NCSC signature score. A UMAP plot of the VR compartment coloured for the NCSC signature is indicated. The dashed line indicates P = 0.05.
Fig. 5
Fig. 5. Ranolazine alters the metabolic state of BRAFi-resistant melanoma cells.
a, Invasive state signature scores represented by violin plots. b, UMAP plot coloured by the expression of the invasive state. c,d, GOBP terms enriched (hypergeometric tests) in the subset of genes (top 200) most highly correlated to the invasive signature scores in VR (c) or VR_RANO (d) cells. The dashed line indicates P = 0.05. Relevant UMAP plots coloured for the respective melanoma states are indicated. e, MITF activity state signature scores represented by violin plots. f, UMAP plot coloured by the expression of the MITF activity state. g,h, GOBP terms enriched (hypergeometric tests) in the subset of genes (top 200) most highly correlated to the MITF activity signature scores in VR (g) or VR_RANO (h) cells. The dashed line indicates P = 0.05. Relevant UMAP plots coloured for the respective melanoma states are indicated.
Fig. 6
Fig. 6. Interferon signalling and methionine metabolism are enriched in ranolazine-treated BRAFi-resistant melanoma cells.
a, UMAP visualization of 6,457 VR and VR_RANO cells coloured by Seurat clusters. b, Hypergeometric test for enrichment analysis using cluster gene markers against the MSigDB hallmark gene-set collection. Only VR_RANO clusters enriched at significance level of Padj < 0.05 are indicated. The percentage of VR_RANO cells distributed in the respective VR_RANO main clusters is indicated for each hallmark. c,d Quantification of cellular ROS levels in VR cells in the presence or absence of RANO and of glucose uptake in VR and VR_RANO cells. Data are presented as the mean ± s.e.m. based on n = 5 (c) and n = 3 (d) biological replicates analysed by two-tailed unpaired t-test. 1. e,f, Hallmarks (e) interferon gamma response and interferon alpha response (f) signature scores in VR_RANO or VR cells represented by violin plot (top) and UMAP (bottom). g, Hypergeometric test for enrichment analysis using cluster gene markers against the KEGG pathway and GOBP gene-set collections. Only VR_RANO clusters enriched at significance level of P < 0.05 are indicated. The percentage of VR_RANO cells distributed in the respective VR_RANO main clusters is indicated for each term. h, UMAP visualization coloured by MTAP, MAT2A and SMS expression. Source data
Fig. 7
Fig. 7. Altered methionine metabolism suppresses PRMT5 activity in VR_RANO cells.
a, Scheme showing methionine metabolism linked to the folate cycle and glutathione synthesis. The genes enriched (MAT2A, SMS) and suppressed (MTAP) in VR_RANO cells are indicated. b, Metabolomics analyses showing reduced levels (integrated peak areas, a.u.) of MTRP and increases in 5MTA and spermidine in VR_RANO cells compared to VR. Data are presented as the mean ± s.e.m. based on n = 4 biological replicates and analysed by two-tailed unpaired t-test. *P < 0.05; ***P < 0.001. c, CFA quantification of VR or VR_RANO cells treated with 50 µM or 100 µM SAM. Data are presented as the mean ± s.e.m. based on n = 3 biological replicates analysed by one-way ANOVA with uncorrected Fisher’s LSD. **P < 0.01; ***P < 0.001. d, qPCR analysis of the indicated genes in VR_RANO cells treated with 50 µM SAM for 8 h. Data are presented as the mean ± s.e.m. based on n = 3 biological replicates and analysed by two-tailed unpaired t-test. *P < 0.05; **P < 0.01; ***P < 0.001. The dashed line at 1.0 indicates untreated cells. e, qPCR analysis of the indicated genes in VR cells treated with 50 µM SAM for 8 h alone or in combination with RANO. Data are presented as the mean ± s.e.m. based on n = 3 biological replicates analysed by one-way ANOVA with uncorrected Fisher’s LSD. ***P < 0.001. The dashed line at 1.0 indicates untreated cells. f, qPCR analysis of the indicated genes in VR and VR_RANO cells. Data are presented as the mean ± s.e.m. based on n = 4 biological replicates by two-tailed unpaired t-test. *P < 0.05; ***P < 0.001. g, Western blot for the indicated proteins in VR and VR_RANO cells representative for n = 3 repeated experiments with similar results. ERK2 served as the loading control. h, qPCR analysis of CD274/PD-L1 in VR and VR_RANO cells in the absence or presence of IFNG. Data are presented as the mean ± s.e.m. based on n = 3 biological replicates analysed by one-way ANOVA with uncorrected Fisher’s LSD. **P < 0.01. i, Flow cytometry analysis of CD274 expression on VR or VR_RANO cells. Data are presented as the mean ± s.e.m. based on n = 3 biological replicates and analysed by two-tailed unpaired t-test. ***P < 0.001. j, Quantification of VR or VR_RANO cells treated with the indicated concentrations of the PRMT5 inhibitor GSK3326595 (PRMT5i). Data are presented as the mean ± s.e.m. based on n = 3 biological replicates analysed by one-way ANOVA with uncorrected Fisher’s LSD. ***P < 0.001. k, qPCR analysis of the indicated genes in A375, VR and VR_RANO cells. Data are presented as the mean ± s.d. based on n = 3 technical replicates analysed by one-way ANOVA with uncorrected Fisher’s LSD. **P < 0.01; ***P < 0.001. l, Flow cytometry analysis of B2M expression on VR or VR_RANO cells. Data are presented as the mean ± s.e.m. based on n = 3 biological replicates and analysed by two-tailed unpaired t-test. ***P < 0.001. m, qPCR analysis of the indicated genes in VR and VR_RANO cells treated with GSK3326595. Data are presented as the mean ± s.e.m. based on n = 3 biological replicates and analysed by two-tailed unpaired t-test. *P < 0.05; ***P < 0.001. The dashed line at 1.0 indicates untreated cells. n, qPCR analysis of CD274/PD-L1 in VR and VR_RANO cells in the absence or presence of GSK3326595. Data are presented as the mean ± s.e.m. based on n = 3 biological replicates analysed by one-way ANOVA with uncorrected Fisher’s LSD. **P < 0.01. Source data
Fig. 8
Fig. 8. Ranolazine induces an immunogenic signature and improves anti-PD-L1 therapy in mice.
a,b, qPCR analysis of the indicated genes in BRAFV600E 5555 mouse melanoma cells. Data are presented as the mean ± s.e.m. based on n = 3 biological replicates and analysed by two-tailed unpaired t-test. **P < 0.01; ***P < 0.001. c, Tumour growth curves of male C57BL/6 mice treated with vehicle or RANO (300 mg per kg body weight). n = 5 mice in each group. df, qPCR analysis of the indicated genes in BRAFV600E 5555 melanomas from mice treated with vehicle or RANO (300 mg per kg body weight daily) for 29 d. Data are presented as the mean ± s.e.m. based on n = 3 technical replicates of tumours from four vehicle-treated mice and from five RANO-treated mice and were analysed by two-tailed unpaired t-test. *P < 0.05; **P < 0.01; ***P < 0.001. g, Growth curves of individual tumours from male C57BL/6 mice treated with anti-PD-L1 (10 mg per kg body weight, every 3 d) or anti-PD-L1 and RANO (300 mg per kg body weight, daily) starting at day 6. n = 5 tumours in each group. h, Kaplan–Meier plots of survival of male mice treated as indicated. Mice with a tumour that exceeded a volume of 1,000 mm3 (dashed line in g) were declared to have reached the endpoint of the experiment (death). Log-rank (Mantel–Cox) test was performed for anti-PD-L1/anti-PD-L1 RANO. i, Kaplan–Meier plots of survival of female C57BL/6 mice treated as indicated in Extended Data Fig. 6e–h. Mice with a tumour that exceeded a volume of 1,000 mm3 were declared to have reached the endpoint of the experiment (death). Log-rank (Mantel–Cox) test was performed for anti-PD-L1/anti-PDL1 RANO. j, UMAP representing CD45+ cells isolated from BRAFV600E 5555 melanomas from male mice after 17 d of treatment. Individual cell populations were annotated using lineage-specific signatures. k, Percentage of annotated lymphocytic populations within the tumour immune infiltrate comparing tumours from mice treated with anti-PD-L1 alone or with anti-PD-L1 and RANO. l, Immunofluorescence analysis for CD8 and CD335 of tumours 16 d after treatment with anti-PD-L1 in the absence or presence of RANO. Data are presented as the mean ± s.e.m. based on n = 6 or n = 3 biological replicates, respectively and analysed by two-tailed unpaired t-test. *P < 0.05; **P < 0.01. Source data
Extended Data Fig. 1
Extended Data Fig. 1. Elevated FAO regulator expression during BRAFi-acquired resistance development.
a, Dose response curve for vemurafenib (BRAFi) in A375 cells and A375VR cells. b, qPCR analysis of the indicated genes in A375 cells treated with BRAFi. Shown is the expression at week 1, 2 and 3 after the establishment of persister #7.0. Data are presented as the mean ± s.d. based on n = 3 sample replicates analysed by two-tailed unpaired t-test. *P < 0.05; **P < 0.01; ***P < 0.001. Source data
Extended Data Fig. 2
Extended Data Fig. 2. Ranolazine reverses BRAFi induced changes in the lipidome and counteracts BRAFi acquired resistance.
a, Heatmap of the top 500 significant (FDR corrected, ANOVA) lipids impacted by VR or VR_RANO in A375 cells; two main clusters were identified showing either increases or decreases in response to BRAFi treatment, respectively (normalized by VR_RANO). In the VR group, Hex2Ceramides, triacylglycerols (TGs) and phosphatidylethanolamines (PE) were over-represented, while in the VR_RANO group phosphatidylcholines (PCs) were the most common lipid class increasing after reduction by BRAFi treatment. b,c (b) OCR and (c) basal or maximal respiration and ATP production of A375 and A375VR cells in the absence (DMSO) or presence of 20 µM ETO. For (b) data are shown as mean ± s.d. with n = 2 replicate wells. For (c) data are presented as mean ± s.em. based on n = 2 biological replicates performed as n = 2 replicate wells and analysed by one-way ANOVA with uncorrected Fisher’s LSD. **P < 0.01; ***P < 0.001. d, Relative cell number of A375 or A375VR cells treated daily with 20 µM ETO. DMSO was set as 100%. Data are presented as mean ± s.em. based on n = 3 biological replicates performed as n = 2 replicate wells and analysed by one-way ANOVA with uncorrected Fisher’s LSD. ***P < 0.001. e,f qPCR analysis of SCN5A/Scn5a and SCN7A expression in (e) A375 and A375VR cells and (f) in the indicated human or mouse melanoma cell lines. Mouse or human cardiomyocytes and MDA-MB-231 cells served as positive controls. Data are presented as mean ± s.e.m based on n = 3 biological replicates. g, basal or maximal respiration and ATP production of A375 and A375VR cells in the absence or presence of 100 µM RANO. Data are presented as mean ± s.d. based on n = 3 replicate wells and analysed by one-way ANOVA with uncorrected Fisher’s LSD. **P < 0.01; ***P < 0.001. h, CFA quantification of WM9 or WM9VR cells treated with 50 µM or 100 µM RANO once per week. Data are presented as mean ± s.em. based on n = 3 biological replicates, and analysed by one-way ANOVA with Sidak’s multiple comparison test. *P < 0.05; ***P < 0.001. (i) CFA quantification of WM9VR cells treated daily with 25 µM RANO. Data are presented as mean ± s.em. based on n = 3 biological replicates analysed by two-tailed unpaired t-test. ***P < 0.001. j, 501mel, 5555, YUMM1.7 and FCT1 cells were treated with high concentrations of BRAFi (10 µM for 501mel and 5555; 5 µM for YUMM1.7, FCT1) for 1 week and then treatment continued at a lower concentration of BRAFi (1 or 0.5 µM, respectively) until acquired resistance was established. BRAFi treatment was in the absence or presence of 50 or 100 µM RANO added once per week. Data are presented as mean ± s.em. based on n = 4 biological replicates for 501mel and n = 3 biological replicates for 5555, YUMM1.7 and FCT1, and analysed by one-way ANOVA with Sidak’s multiple comparison test or two-tailed unpaired t-test. **P < 0.01; ***P < 0.001. k, A375 cells were treated with high concentrations of BRAFi and MEKi (5 µM and 100 nM, respectively) for 1 week and then treatment continued at a lower concentration (0,5 µM and 10 nM, respectively) until acquired resistance was established. MAPK inhibitor treatment was in the absence or presence of 100 µM RANO added once per week. Data are presented as mean ± s.em. based on n = 3 biological, and analysed by one-way ANOVA with Dunnett’s multiple comparisons test. ***P < 0.001. Source data
Extended Data Fig. 3
Extended Data Fig. 3. FAO regulator expression in human melanoma tumours.
a, Pearson correlation of the fold change in expression of the indicated FAO regulators with melanoma state markers AXL, NGFR or MITF respectively in tumours from patients progressed on MAPKi when compared to the same tumours before treatment (data relate to GSE50509). b, fold change expression of the indicated genes in groups of patients stratified for high or low MITF expression. Cut-off: P < 0.05. Source data
Extended Data Fig. 4
Extended Data Fig. 4. Ranolazine improves BRAFi therapy.
a, Growth curves of tumours from female mice treated with vehicle, RANO alone 50 mg/kg, daily, BRAFi alone (25 mg/kg, daily) or with BRAFi (25 mg/kg, daily) and RANO (50 mg/kg, daily), RANO was added at day 28 when BRAFi treated tumours showed a reduced response to treatment. Data are presented as mean ± s.e.m. based on n = 12 tumours in each group. b, Tumour end volume of female mice treated with BRAFi (n = 12) or the combination (combo) of BRAFi with RANO (n = 10) at days 40 and 44 of treatment. Data are presented as mean ± s.e.m. analysed by one-way ANOVA with uncorrected Fisher’s LSD. *P < 0.05. c, Growth curves of tumours from male mice treated with vehicle, RANO alone 50 mg/kg, daily, BRAFi alone (25 mg/kg, daily) or with BRAFi (25 mg/kg, daily) and RANO (50 mg/kg, daily), RANO was added at day 23 when BRAFi treated tumours showed a reduced response to treatment. Data are presented as mean ± s.e.m. based on n = 13 tumours in vehicle group, 14 tumours in RANO and BRAFi/RANO group and 16 in the BRAFi group. d,e, Growth curves of individual tumours from male mice treated with (d) BRAFi alone or (e) with BRAFi and RANO as described in (c). f, Kaplan-Meier plots of progression free survival of male mice treated as indicated. Progression was declared when tumours exceeded a volume of twice the volume at day 8, when BRAFi was added (dashed line). Log-rank (mantel Cox) test: BRAFi vs BRAFi/RANO HR = 2.58. g, Tumour end volume of mice treated as indicated in (c) at days 34 and 35 of treatment. Data are from n = 14 tumours and presented as mean ± s.e.m. analysed by one-way ANOVA with uncorrected Fisher’s LSD. **P < 0.01. h qPCR analysis of the indicated genes in A375 tumours from mice treated as indicated. Data are triplicates from n = 8 tumours for vehicle or BRAFi, n = 4 tumours for RANO responder (resp) or RANO progressed (prog), respectively. Data and are presented as mean ± s.e.m. analysed by one-way ANOVA with uncorrected Fisher’s LSD. *P < 0.05; **P < 0.01; ***P < 0.001. Source data
Extended Data Fig. 5
Extended Data Fig. 5. Ranolazine alters the transcription state of BRAFi resistant melanoma cells.
a. Protocol for the generation of single-cell RNAseq data. b, UMAP of Seurat clusters identified in the individual treatment groups parental, VR and VR_RANO. c, UMAP plots of VR compartment coloured for high discrete expression of the invasive or MITF activity state based on the 90th percentile of signature scores across the whole dataset. The corresponding clusters are shown. d, Enrichment analysis using gene markers for invasivehigh (VR cells), MITF activityhigh (VR cells) and indicated clusters (VR compartment) against MSigDB hallmark gene set collection. e, UMAP plots of VR_RANO compartment coloured for high discrete expression of the invasive or MITF activity state based on the 90th percentile of signature scores across whole dataset. The corresponding clusters in VR_RANO compartment are shown. f, Enrichment analysis using gene markers for invasivehigh (VR_RANO cells), MITF activityhigh (VR_RANO cells) and indicated clusters (VR_RANO compartment) against MSigDB hallmark gene set collection.
Extended Data Fig. 6
Extended Data Fig. 6. Ranolazine enhances interferon signalling in BRAFi resistant melanoma cells.
a, Uniform Manifold Approximation and Projection (UMAP) visualisation of 6,457 cells coloured by treatment and replicate groups. b, Melanoma cell states according to Rambow et al enriched (hypergeometric tests) in treatment’s gene markers. The dashed line indicates P = 0.05. c, UMAP visualisation of VR and VR_RANO cells coloured by the NCSC state signature score d,e, UMAP visualisation of VR and VR_RANO cells coloured for high versus low discrete states (based on the 90th percentile) of the Hallmark signatures (d) interferon gamma signalling and (e) interferon alpha signalling.
Extended Data Fig. 7
Extended Data Fig. 7. Ranolazine improves anti-PD-L1 therapy.
a,b, mRNA expression of the indicated genes in (a,) A375 human melanoma cells and in (b) YUMM1.7 mouse melanoma cells after treatment with RANO. Expression in untreated cells was set 1. Data are presented as mean ± s.e.m. based on n = 3 biological replicates and analysed by two-tailed unpaired t-test. *P < 0.05; **P < 0.01; ***P < 0.001. c, Tumour volume at the indicated days in male C57BL/6 mice treated with vehicle, RANO (300 mg/kg, daily), anti-PD-L1 (10 mg/kg, every 3 days) or anti-PD-L1 and RANO (300 mg/kg, daily) starting at day 6. Data are presented as mean ± s.e.m. based on n = 5 mice in each group and analysed by one-way ANOVA with uncorrected Fisher’s LSD. **P < 0.01; ***P < 0.001; P = 0.2245; P = 0.1194. d, Relative animal weight of mice related to (c). Data are presented as mean ± s.e.m. e, Tumour growth curves of female C57BL/6 mice treated with vehicle or RANO (300 mg/kg/daily). Data are presented as mean ± s.e.m. based on n = 5 mice in each group. f, Growth curves of individual tumours from female C57BL/6 mice treated with anti-PD-L1 (10 mg/kg, every 3 days) or anti-PD-L1 and RANO (300 mg/kg, daily) starting at day 6. n = 10 tumours for anti-PD-L1 and 11 for the combination treatment. g, Relative animal weight of mice related to (e,f). Data are presented as mean ± s.e.m. h, Tumour volume at the indicated days in female C57BL/6 mice treated as described in (e,f). Data are presented as mean ± s.e.m. based on 10 tumours for anti-PD-L1 and 11 for the combination treatment, analysed by one-way ANOVA with uncorrected Fisher’s LSD. **P < 0.01; ***P < 0.001. Source data
Extended Data Fig. 8
Extended Data Fig. 8. Ranolazine increases abundance and reduces exhaustion of Cd8+ T cells.
a, qPCR analysis of the indicated genes in 5555 mouse melanoma tumours from mice treated for 21 days. Data and are presented as mean ± s.e.m. analysed by by two-tailed unpaired t-test. *P < 0.05; **P < 0.01; ***P < 0.001. b, UMAP representing CD45+ cells isolated from 5555 melanomas from male mice after 13 days of treatment. Individual lymphocytic cell populations were annotated using lineage-specific signatures. c, Percentage of annotated lymphocytic populations within the tumour immune infiltrate comparing tumours from mice treated with vehicle or with RANO. d, Violin plots representing the enrichment of the exhaustion signature in CD8 + -T cells isolated from mice treated for 13 days with vehicle or RANO. Source data

References

    1. Luke JJ, Flaherty KT, Ribas A, Long GV. Targeted agents and immunotherapies: optimizing outcomes in melanoma. Nat. Rev. Clin. Oncol. 2017;14:463–482. doi: 10.1038/nrclinonc.2017.43. - DOI - PubMed
    1. Wolchok JD, Rollin L, Larkin J. Nivolumab and ipilimumab in advanced melanoma. N. Engl. J. Med. 2017;377:2503–2504. doi: 10.1056/NEJMoa1709684. - DOI - PubMed
    1. Trojaniello C, Luke JJ, Ascierto PA. Therapeutic advancements across clinical stages in melanoma, with a focus on targeted immunotherapy. Front Oncol. 2021;11:670726. doi: 10.3389/fonc.2021.670726. - DOI - PMC - PubMed
    1. Smith MP, et al. Inhibiting drivers of non-mutational drug tolerance is a salvage strategy for targeted melanoma therapy. Cancer Cell. 2016;29:270–284. doi: 10.1016/j.ccell.2016.02.003. - DOI - PMC - PubMed
    1. Arozarena I, Wellbrock C. Phenotype plasticity as enabler of melanoma progression and therapy resistance. Nat. Rev. Cancer. 2019;19:377–391. doi: 10.1038/s41568-019-0154-4. - DOI - PubMed

Publication types