. 2023 Aug 10;20(1):26.
doi: 10.1186/s12950-023-00353-y.

Air pollution induces pyroptosis of human monocytes through activation of inflammasomes and Caspase-3-dependent pathways

Affiliations

Air pollution induces pyroptosis of human monocytes through activation of inflammasomes and Caspase-3-dependent pathways

Adrianna Gałuszka-Bulaga et al. J Inflamm (Lond). .

Abstract

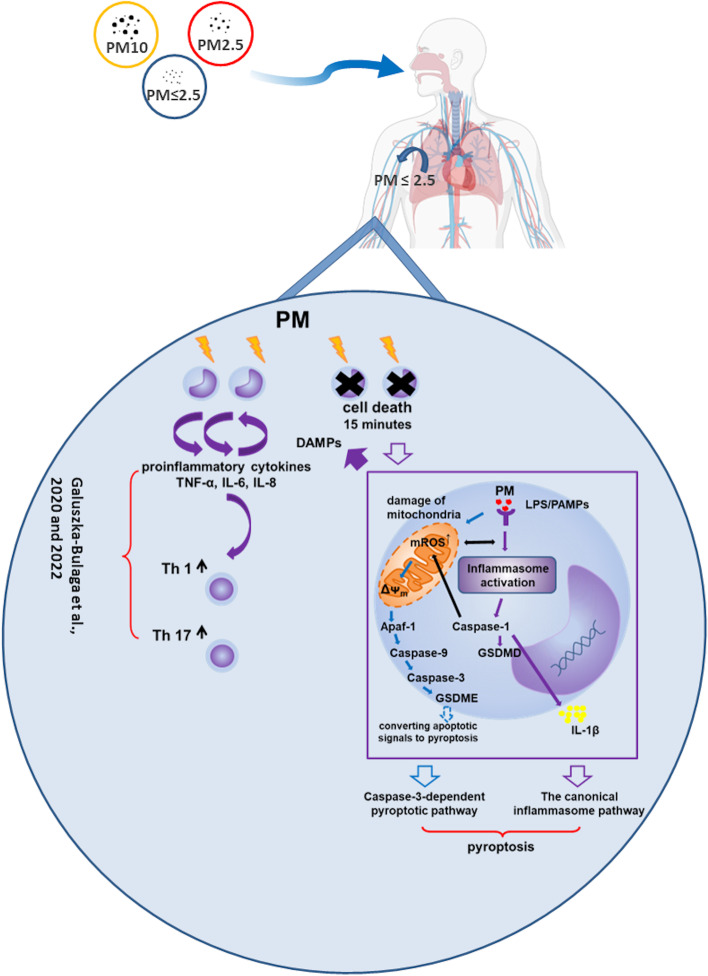
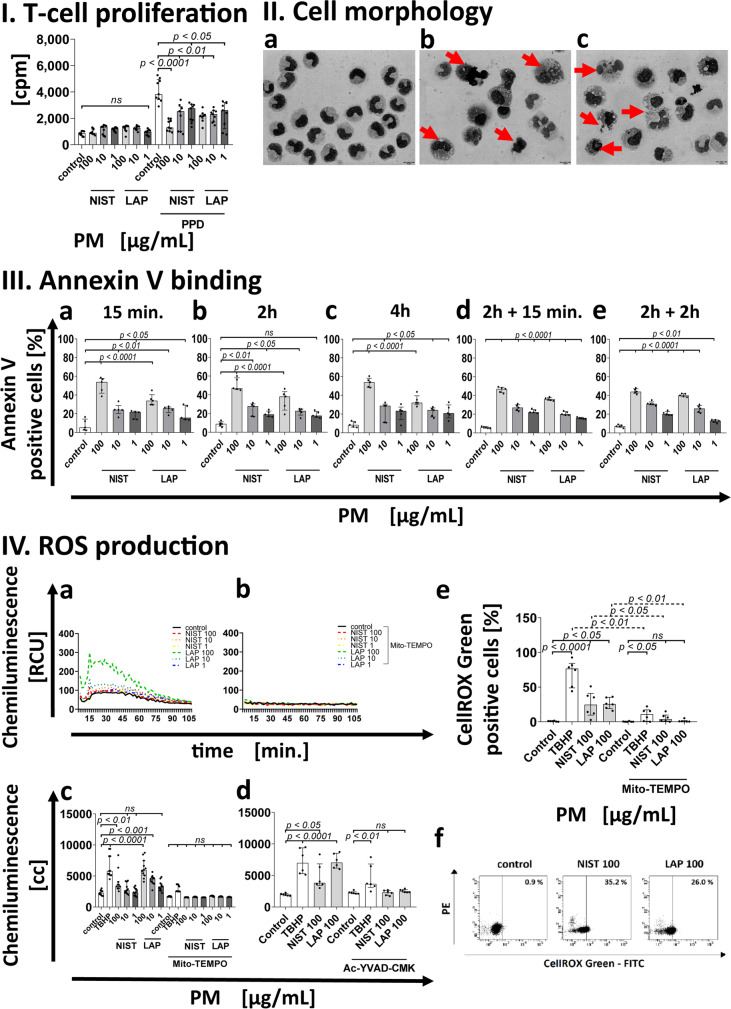
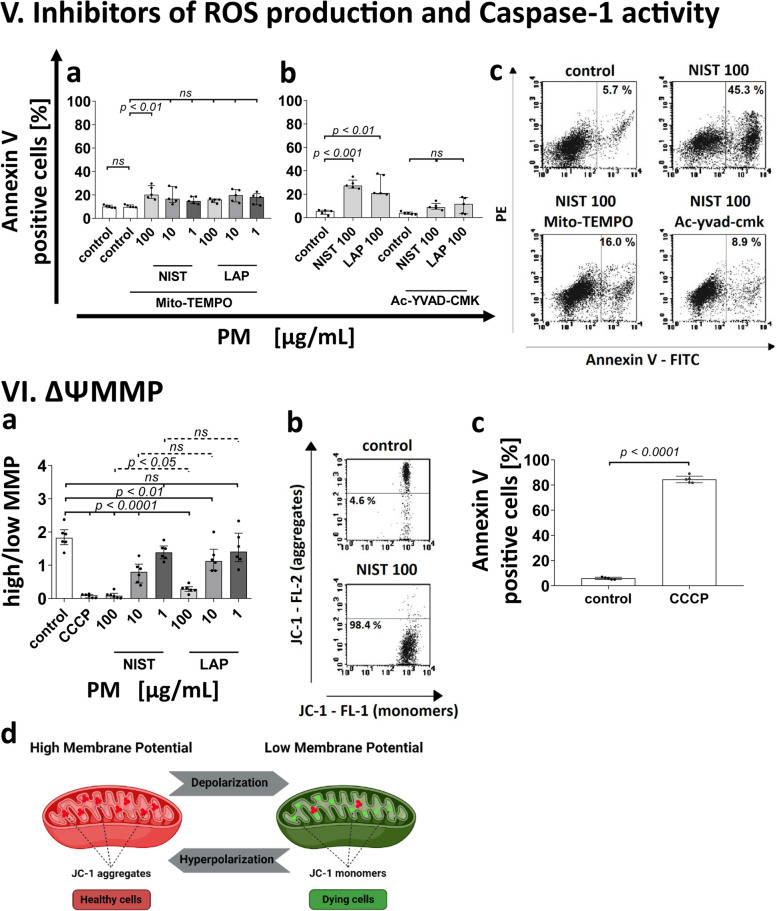
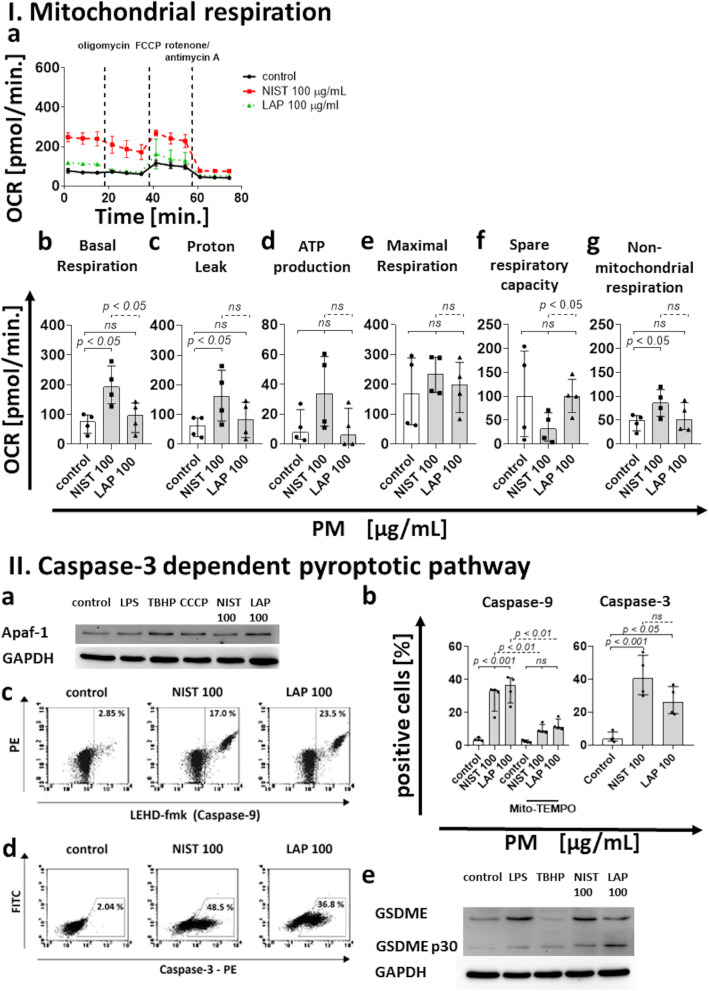
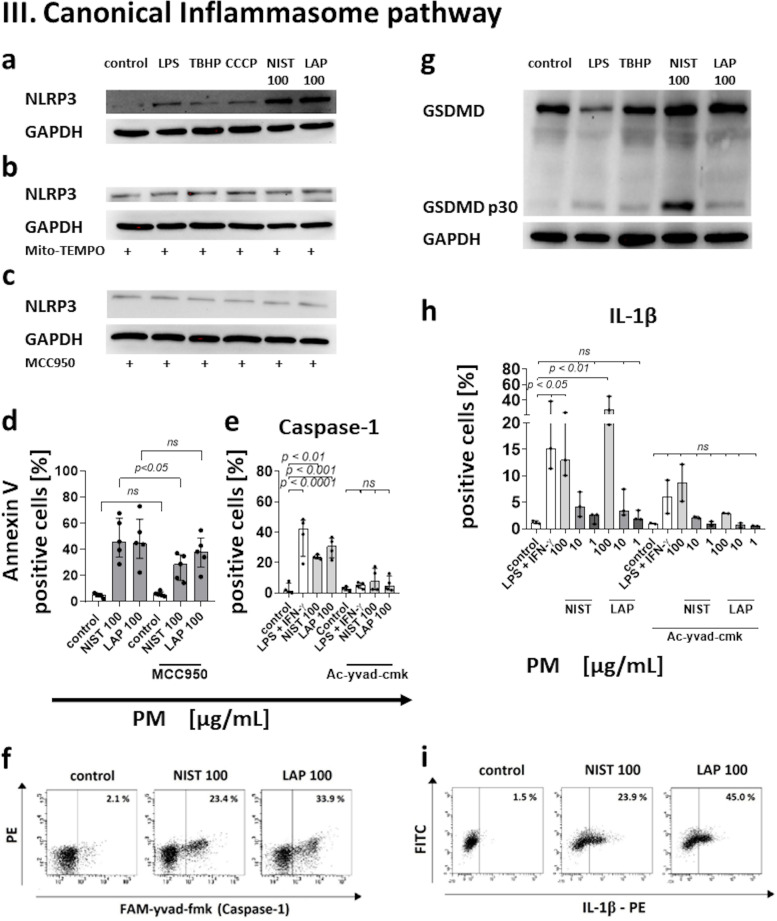
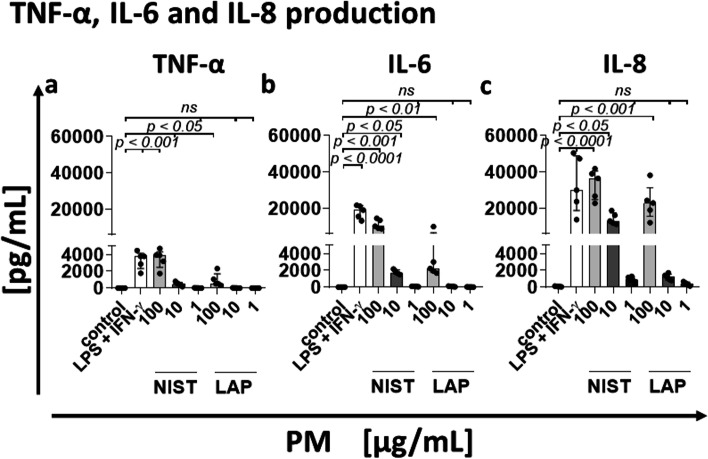
According to the World Health Organization (WHO), air pollution is one of the most serious threats for our planet. Despite a growing public awareness of the harmful effects of air pollution on human health, the specific influence of particulate matter (PM) on human immune cells remains poorly understood. In this study, we investigated the effect of PM on peripheral blood monocytes in vitro. Monocytes from healthy donors (HD) were exposed to two types of PM: NIST (SRM 1648a, standard urban particulate matter from the US National Institute for Standards and Technology) and LAP (SRM 1648a with the organic fraction removed). The exposure to PM-induced mitochondrial ROS production followed by the decrease of mitochondrial membrane potential and activation of apoptotic protease activating factor 1 (Apaf-1), Caspase-9, and Caspase-3, leading to the cleavage of Gasdermin E (GSDME), and initiation of pyroptosis. Further analysis showed a simultaneous PM-dependent activation of inflammasomes, including NLRP3 (nucleotide-binding oligomerization domain-like receptor pyrin domain containing 3) and Caspase-1, followed by cleavage of Gasdermin D (GSDMD) and secretion of IL-1β. These observations suggest that PM-treated monocytes die by pyroptosis activated by two parallel signaling pathways, related to the inorganic and organic PM components. The release of IL-1β and expression of danger-associated molecular patterns (DAMPs) by pyroptotic cells further activated the remnant viable monocytes to produce inflammatory cytokines (TNF-α, IL-6, IL-8) and protected them from death induced by the second challenge with PM.In summary, our report shows that PM exposure significantly impacts monocyte function and induces their death by pyroptosis. Our observations indicate that the composition of PM plays a crucial role in this process-the inorganic fraction of PM is responsible for the induction of the Caspase-3-dependent pyroptotic pathway. At the same time, the canonical inflammasome path is activated by the organic components of PM, including LPS (Lipopolysaccharide/endotoxin). PM-induced pyroptosis of human monocytes. Particulate matter (PM) treatment affects monocytes viability already after 15 min of their exposure to NIST or LAP in vitro. The remnant viable monocytes in response to danger-associated molecular patterns (DAMPs) release pro-inflammatory cytokines and activate Th1 and Th17 cells. The mechanism of PM-induced cell death includes the increase of reactive oxygen species (ROS) production followed by collapse of mitochondrial membrane potential (ΔΨm), activation of Apaf-1, Caspase-9 and Caspase-3, leading to activation of Caspase-3-dependent pyroptotic pathway, where Caspase-3 cleaves Gasdermin E (GSDME) to produce a N-terminal fragment responsible for the switch from apoptosis to pyroptosis. At the same time, PM activates the canonical inflammasome pathway, where activated Caspase-1 cleaves the cytosolic Gasdermin D (GSDMD) to produce N-terminal domain allowing IL-1β secretion. As a result, PM-treated monocytes die by pyroptosis activated by two parallel pathways-Caspase-3-dependent pathway related to the inorganic fraction of PM and the canonical inflammasome pathway dependent on the organic components of PM.

Keywords: Cytokine production; NLRP3 inflammasome activation; Particulate matter; Peripheral blood monocytes; Pyroptosis.


Conflict of interest statement

The authors declare no competing interests.

Figures

None
PM-induced pyroptosis of human monocytes. Particulate matter (PM) treatment affects monocytes viability already after 15 min of their exposure to NIST or LAP in vitro. The remnant viable monocytes in response to danger-associated molecular patterns (DAMPs) release pro-inflammatory cytokines and activate Th1 and Th17 cells. The mechanism of PM-induced cell death includes the increase of reactive oxygen species (ROS) production followed by collapse of mitochondrial membrane potential (ΔΨm), activation of Apaf-1, Caspase-9 and Caspase-3, leading to activation of Caspase-3-dependent pyroptotic pathway, where Caspase-3 cleaves Gasdermin E (GSDME) to produce a N-terminal fragment responsible for the switch from apoptosis to pyroptosis. At the same time, PM activates the canonical inflammasome pathway, where activated Caspase-1 cleaves the cytosolic Gasdermin D (GSDMD) to produce N-terminal domain allowing IL-1β secretion. As a result, PM-treated monocytes die by pyroptosis activated by two parallel pathways—Caspase-3-dependent pathway related to the inorganic fraction of PM and the canonical inflammasome pathway dependent on the organic components of PM.
Fig. 1
Fig. 1
Effect of the PM exposure of monocytes on: (I) Antigen-driven T cell proliferation. Antigen -driven T cell proliferation in the presence of monocytes exposed to NIST or LAP as APC was evaluated by [3H]-thymidine incorporation assay after 7 days stimulation with recall antigen PPD (purified protein derivative of tuberculin). Data are presented as counts per minute (cpm; median ± interquartile range from 9 independent experiments). (II) Cell morphology. Images show monocytes without exposition to PM (a) vs. exposed to NIST 100 µg/mL (b) or LAP 100 µg/mL (c). Arrows indicate alterations in cell morphology after 15 min exposure to PM. Data are presented from one representative experiment (May-Grünwald-Giemsa staining; magnification × 1000, scale 10 µm). (III) Annexin V binding. The viability of monocytes was evaluated by Annexin V binding assay and flow cytometry analysis. Data are presented as a percentage of Annexin V positive cells (median ± interquartile range from 5 independent experiments). Cells were cultured with a single dose of NIST, or LAP used in three different concentrations (1, 10 or 100 µg/mL) for 15 min (a), 2 h (b) and 4 h (c). In some experiments, monocytes were cultured with PM for 2 h and then the second dose of NIST or LAP was added to cell cultures for the next 15 min (d) or 2 h (e). (IV) ROS production. ROS formation was analyzed by luminol-dependent chemiluminescence measurement recorded at 37 °C. Data are presented in relative chemiluminescence units (RCU) as mean of the results of each cycle (from 1 to 60 cycles) (a, b) and results are expressed as cumulative counts (cc) of the response (c, d) recorded from 60 cycles during 100 min. of measurement. Data are presented as median ± interquartile range from 11 independent experiments. Additionally, detection of ROS in live monocytes were performed with CellROX Green reagent by flow cytometry after 15 min of the cell exposure to NIST or LAP (e). Data are expressed as the percentage of CellROX Green positive cells (median ± interquartile range from 6 independent experiments). Dot plots (CellROX Green—FITC vs. PE) show CellROX Green positive cells in unstimulated control and cells stimulated with NIST or LAP in the highest concentration of 100 µg/mL, for 15 min (f). As a positive control, 200 µM TBHP was used. As a negative control, monocytes were pre-treated with 1.5 mM Mito-TEMPO (c) or 50 µM Ac-yvad-cmk (d) for 1 h prior to the PM exposure. (V) Inhibitors of ROS production and Caspase-1 activity. Additionally, the viability of cells was evaluated by Annexin V binding assay and flow cytometry analysis after monocyte pre-incubation (1 h) with 1.5 mM Mito-TEMPO or 50 µM Ac-yvad-cmk prior to PM exposure (a, b). Dot plots (Annexin V—FITC vs. PE) show Annexin V positive cells in unstimulated control, cells stimulated with NIST (100 µg/mL) for 15 min and cells treated with 1.5 mM Mito-TEMPO or 50 µM Ac-yvad-cmk for 1 h prior to the NIST (100 µg/mL) exposure (c). (VI) Mitochondrial membrane potential (ΨMMP). Alteration of mitochondrial membrane potential (ΔΨMMP) was appointed by flow cytometry using MitoScreen JC-1 dye after 15 min the exposure of cells to NIST or LAP. ΔΨMMP of monocyte was expressed as a ratio of the percentages of cells with high fluorescence intensity (aggregates with high ΨMMP) to cells with low fluorescence intensity (monomers with low ΨMMP) (a). As a positive control, 10 µM CCCP was used. Dot plots (JC-1—FL-1 vs. JC-1 – FL-2) show JC-1 positive cells for aggregates with high ΨMMP; high fluorescence intensity and monomers with low ΨMMP; low fluorescence intensity in unstimulated control and cells stimulated with NIST (100 µg/mL) for 15 min (b). Data are presented as median ± interquartile range from 6 independent experiments. Additionally, the viability of cells was evaluated by Annexin V binding assay and flow cytometry analysis after cell incubation with 10 µM CCCP for 15 min (c). Data are presented as a percentage of Annexin V positive cells (median ± interquartile range from 5 independent experiments). Statistically significant differences were estimated at p < 0.05, p < 0.01, p < 0.001, p < 0.0001, ns – not significant. (d) Changes in mitochondrial membrane potential of cells
Fig. 1
Fig. 1
Effect of the PM exposure of monocytes on: (I) Antigen-driven T cell proliferation. Antigen -driven T cell proliferation in the presence of monocytes exposed to NIST or LAP as APC was evaluated by [3H]-thymidine incorporation assay after 7 days stimulation with recall antigen PPD (purified protein derivative of tuberculin). Data are presented as counts per minute (cpm; median ± interquartile range from 9 independent experiments). (II) Cell morphology. Images show monocytes without exposition to PM (a) vs. exposed to NIST 100 µg/mL (b) or LAP 100 µg/mL (c). Arrows indicate alterations in cell morphology after 15 min exposure to PM. Data are presented from one representative experiment (May-Grünwald-Giemsa staining; magnification × 1000, scale 10 µm). (III) Annexin V binding. The viability of monocytes was evaluated by Annexin V binding assay and flow cytometry analysis. Data are presented as a percentage of Annexin V positive cells (median ± interquartile range from 5 independent experiments). Cells were cultured with a single dose of NIST, or LAP used in three different concentrations (1, 10 or 100 µg/mL) for 15 min (a), 2 h (b) and 4 h (c). In some experiments, monocytes were cultured with PM for 2 h and then the second dose of NIST or LAP was added to cell cultures for the next 15 min (d) or 2 h (e). (IV) ROS production. ROS formation was analyzed by luminol-dependent chemiluminescence measurement recorded at 37 °C. Data are presented in relative chemiluminescence units (RCU) as mean of the results of each cycle (from 1 to 60 cycles) (a, b) and results are expressed as cumulative counts (cc) of the response (c, d) recorded from 60 cycles during 100 min. of measurement. Data are presented as median ± interquartile range from 11 independent experiments. Additionally, detection of ROS in live monocytes were performed with CellROX Green reagent by flow cytometry after 15 min of the cell exposure to NIST or LAP (e). Data are expressed as the percentage of CellROX Green positive cells (median ± interquartile range from 6 independent experiments). Dot plots (CellROX Green—FITC vs. PE) show CellROX Green positive cells in unstimulated control and cells stimulated with NIST or LAP in the highest concentration of 100 µg/mL, for 15 min (f). As a positive control, 200 µM TBHP was used. As a negative control, monocytes were pre-treated with 1.5 mM Mito-TEMPO (c) or 50 µM Ac-yvad-cmk (d) for 1 h prior to the PM exposure. (V) Inhibitors of ROS production and Caspase-1 activity. Additionally, the viability of cells was evaluated by Annexin V binding assay and flow cytometry analysis after monocyte pre-incubation (1 h) with 1.5 mM Mito-TEMPO or 50 µM Ac-yvad-cmk prior to PM exposure (a, b). Dot plots (Annexin V—FITC vs. PE) show Annexin V positive cells in unstimulated control, cells stimulated with NIST (100 µg/mL) for 15 min and cells treated with 1.5 mM Mito-TEMPO or 50 µM Ac-yvad-cmk for 1 h prior to the NIST (100 µg/mL) exposure (c). (VI) Mitochondrial membrane potential (ΨMMP). Alteration of mitochondrial membrane potential (ΔΨMMP) was appointed by flow cytometry using MitoScreen JC-1 dye after 15 min the exposure of cells to NIST or LAP. ΔΨMMP of monocyte was expressed as a ratio of the percentages of cells with high fluorescence intensity (aggregates with high ΨMMP) to cells with low fluorescence intensity (monomers with low ΨMMP) (a). As a positive control, 10 µM CCCP was used. Dot plots (JC-1—FL-1 vs. JC-1 – FL-2) show JC-1 positive cells for aggregates with high ΨMMP; high fluorescence intensity and monomers with low ΨMMP; low fluorescence intensity in unstimulated control and cells stimulated with NIST (100 µg/mL) for 15 min (b). Data are presented as median ± interquartile range from 6 independent experiments. Additionally, the viability of cells was evaluated by Annexin V binding assay and flow cytometry analysis after cell incubation with 10 µM CCCP for 15 min (c). Data are presented as a percentage of Annexin V positive cells (median ± interquartile range from 5 independent experiments). Statistically significant differences were estimated at p < 0.05, p < 0.01, p < 0.001, p < 0.0001, ns – not significant. (d) Changes in mitochondrial membrane potential of cells
Fig. 2
Fig. 2
Effect of the PM exposure of monocytes on: (I) Mitochondrial respiration. (a) The Cell Mito Stress Test profile presenting OCR values for monocytes in control condition and after NIST or LAP treatment (data are presented from one representative experiment). Additionally, OCR values for: (b) basal respiration, (c) proton leak, (d) ATP production, (e) maximal respiration, (f) spare respiratory capacity and (g) non-mitochondrial respiration in control cells and monocytes treated with NIST or LAP (100 µg/mL) are presented separately, as median ± interquartile range from 4 independent experiments. All measurements were performed in triplicates. (II) Caspase-3–dependent pyroptotic pathway. (a) Activation of Apaf-1 and (e) GSDME after 15 min of monocyte exposure to NIST or LAP (100 µg/mL) was evaluated by Western blot analysis. GAPDH was used to confirm the equal protein loading. (b) In the case of Caspase-9 and Caspase-3, their activation was examined by flow cytometry using Caspase-9 (active) Staining Kit and PE-conjugated mouse anti-human active Caspase-3 monoclonal antibodies. Data are presented as median ± interquartile range from 4 independent experiments. (c, d) Dot plots (LEHD-fmk – FITC vs. PE and Caspase-3 – PE vs. FITC) show cells positive for Caspase-9 and Caspase-3 in unstimulated control and cells stimulated with NIST or LAP (100 µg/mL) for 15 min. As a positive control, cells stimulated with 100 ng/mL of LPS from Salmonella abortus equi, 200 µM TBHP or 10 µM CCCP, were used simultaneously. Monocytes pre-incubated for 1 h with 1.5 mM Mito-TEMPO prior to PM exposure were used as a negative control. (III) The canonical inflammasome pathway. (a) Activation of NRLP3, including after 1 h pre-incubation with1.5 mM Mito-Tempo (b) or 10 µM MCC950 (c) and GSDMD (g) was evaluated by Western blot analysis after 15 min of monocyte exposure to NIST or LAP (100 µg/mL). GAPDH was used to confirm the equal protein loading. (d) Specific inhibition of NLRP3. MCC950 was used to assess the effect of NLRP3 inactivation on monocyte Annexin V binding. (e) In the case of Caspase-1, its activation was examined by flow cytometry using Caspase-1 (active) Staining Kit. Data are presented as median ± interquartile range from 4 independent experiments. (f) Dot plots (FAM-yvad-fmk vs. PE) show cells positive for Caspase-1 in unstimulated control and cells stimulated with NIST or LAP (100 µg/mL) for 15 min. (h) Additionally, the level of IL-1β producing monocytes was evaluated by flow cytometry after cell staining with a PE-conjugated mouse anti-human IL-1β monoclonal antibodies. Human monocytes were cultured with or without NIST or LAP for 15 min. Data are presented as a percentage of IL-1β positive cells (median ± interquartile range from 3 independent experiments). (i) Dot plots (IL-1β – PE vs. FITC) show cells positive for IL-1β in unstimulated control and cells stimulated with NIST or LAP (100 µg/mL) for 15 min. As a positive control, cells stimulated with 100 ng/mL of LPS from Salmonella abortus equi and 400 U/mL of human recombinant IFN-γ, 200 µM TBHP or 10 µM CCCP, were used simultaneously. Monocytes pre-incubated for 1 h with 1.5 mM Mito-TEMPO or 50 µM Ac-yvad-cmk prior to PM exposure were used, as a negative control. Statistically significant differences were estimated at p < 0.05, p < 0.01, p < 0.001, p < 0.0001, ns – not significant
Fig. 2
Fig. 2
Effect of the PM exposure of monocytes on: (I) Mitochondrial respiration. (a) The Cell Mito Stress Test profile presenting OCR values for monocytes in control condition and after NIST or LAP treatment (data are presented from one representative experiment). Additionally, OCR values for: (b) basal respiration, (c) proton leak, (d) ATP production, (e) maximal respiration, (f) spare respiratory capacity and (g) non-mitochondrial respiration in control cells and monocytes treated with NIST or LAP (100 µg/mL) are presented separately, as median ± interquartile range from 4 independent experiments. All measurements were performed in triplicates. (II) Caspase-3–dependent pyroptotic pathway. (a) Activation of Apaf-1 and (e) GSDME after 15 min of monocyte exposure to NIST or LAP (100 µg/mL) was evaluated by Western blot analysis. GAPDH was used to confirm the equal protein loading. (b) In the case of Caspase-9 and Caspase-3, their activation was examined by flow cytometry using Caspase-9 (active) Staining Kit and PE-conjugated mouse anti-human active Caspase-3 monoclonal antibodies. Data are presented as median ± interquartile range from 4 independent experiments. (c, d) Dot plots (LEHD-fmk – FITC vs. PE and Caspase-3 – PE vs. FITC) show cells positive for Caspase-9 and Caspase-3 in unstimulated control and cells stimulated with NIST or LAP (100 µg/mL) for 15 min. As a positive control, cells stimulated with 100 ng/mL of LPS from Salmonella abortus equi, 200 µM TBHP or 10 µM CCCP, were used simultaneously. Monocytes pre-incubated for 1 h with 1.5 mM Mito-TEMPO prior to PM exposure were used as a negative control. (III) The canonical inflammasome pathway. (a) Activation of NRLP3, including after 1 h pre-incubation with1.5 mM Mito-Tempo (b) or 10 µM MCC950 (c) and GSDMD (g) was evaluated by Western blot analysis after 15 min of monocyte exposure to NIST or LAP (100 µg/mL). GAPDH was used to confirm the equal protein loading. (d) Specific inhibition of NLRP3. MCC950 was used to assess the effect of NLRP3 inactivation on monocyte Annexin V binding. (e) In the case of Caspase-1, its activation was examined by flow cytometry using Caspase-1 (active) Staining Kit. Data are presented as median ± interquartile range from 4 independent experiments. (f) Dot plots (FAM-yvad-fmk vs. PE) show cells positive for Caspase-1 in unstimulated control and cells stimulated with NIST or LAP (100 µg/mL) for 15 min. (h) Additionally, the level of IL-1β producing monocytes was evaluated by flow cytometry after cell staining with a PE-conjugated mouse anti-human IL-1β monoclonal antibodies. Human monocytes were cultured with or without NIST or LAP for 15 min. Data are presented as a percentage of IL-1β positive cells (median ± interquartile range from 3 independent experiments). (i) Dot plots (IL-1β – PE vs. FITC) show cells positive for IL-1β in unstimulated control and cells stimulated with NIST or LAP (100 µg/mL) for 15 min. As a positive control, cells stimulated with 100 ng/mL of LPS from Salmonella abortus equi and 400 U/mL of human recombinant IFN-γ, 200 µM TBHP or 10 µM CCCP, were used simultaneously. Monocytes pre-incubated for 1 h with 1.5 mM Mito-TEMPO or 50 µM Ac-yvad-cmk prior to PM exposure were used, as a negative control. Statistically significant differences were estimated at p < 0.05, p < 0.01, p < 0.001, p < 0.0001, ns – not significant
Fig. 3
Fig. 3
Effect of PM exposure on monocyte cytokine production. Human monocytes were treated with/without NIST or LAP for 4 h of culture. Concentration of TNF-α (a), IL-6 (b) and IL-8 (c) was analyzed in the culture supernatants by Cytokine bead array and flow cytometry analysis. As a positive control, monocytes were stimulated with 400 U/mL of human recombinant IFN-γ and 100 ng/mL of LPS from Salmonella abortus equi. Data are presented as median ± interquartile range from 5 independent experiments. Statistically significant differences were estimated at p < 0.05, p < 0.01, p < 0.001, p < 0.0001, ns – not significant

Similar articles

Cited by

References

    1. Gawda A, Majka G, Nowak B, et al. Air pollution, oxidative stress, and exacerbation of autoimmune diseases. Centr Eur J Immunol. 2017;42:305–312. - PMC - PubMed
    1. Ji H, Hershey GKK. Genetic and epigenetic influence on the response to environmental particulate matter. J Allergy Clin Immunol. 2013;129:33–41. - PMC - PubMed
    1. Ritz SA. Air pollution as a potential contributor to the “epidemic” of autoimmune disease. Med Hypotheses. 2010;74:110–117. - PubMed
    1. Bateman ED, Hurd SS, Barnes PJ, et al. Global strategy for asthma management and prevention: GINA executive summary. Eur Respir J. 2008;31:143–178. - PubMed
    1. Buzea C, Pacheco II, Robbie K. Nanomaterials and nanoparticles: Sources and toxicity. Biointerphases. 2007;2:17–71. - PubMed