. 2023 Aug 11;42(1):206.
doi: 10.1186/s13046-023-02730-0.

Predicting response to immunotherapy in gastric cancer via assessing perineural invasion-mediated inflammation in tumor microenvironment

Affiliations

Predicting response to immunotherapy in gastric cancer via assessing perineural invasion-mediated inflammation in tumor microenvironment

Xunjun Li et al. J Exp Clin Cancer Res. .

Abstract

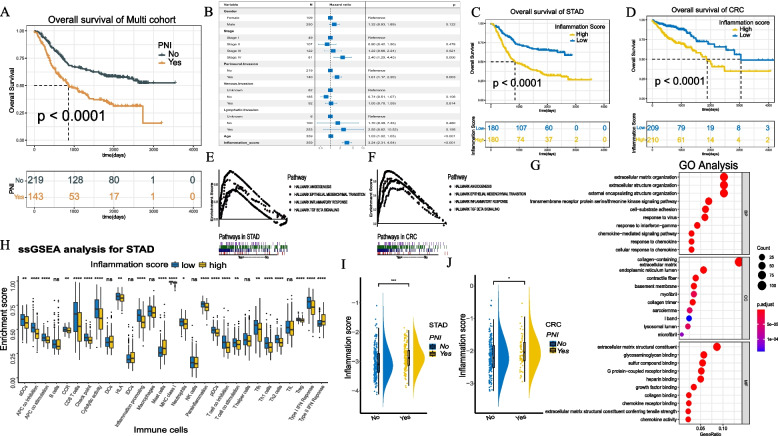
Background: The perineural invasion (PNI)-mediated inflammation of the tumor microenvironment (TME) varies among gastric cancer (GC) patients and exhibits a close relationship with prognosis and immunotherapy. Assessing the neuroinflammation of TME is important in predicting the response to immunotherapy in GC patients.

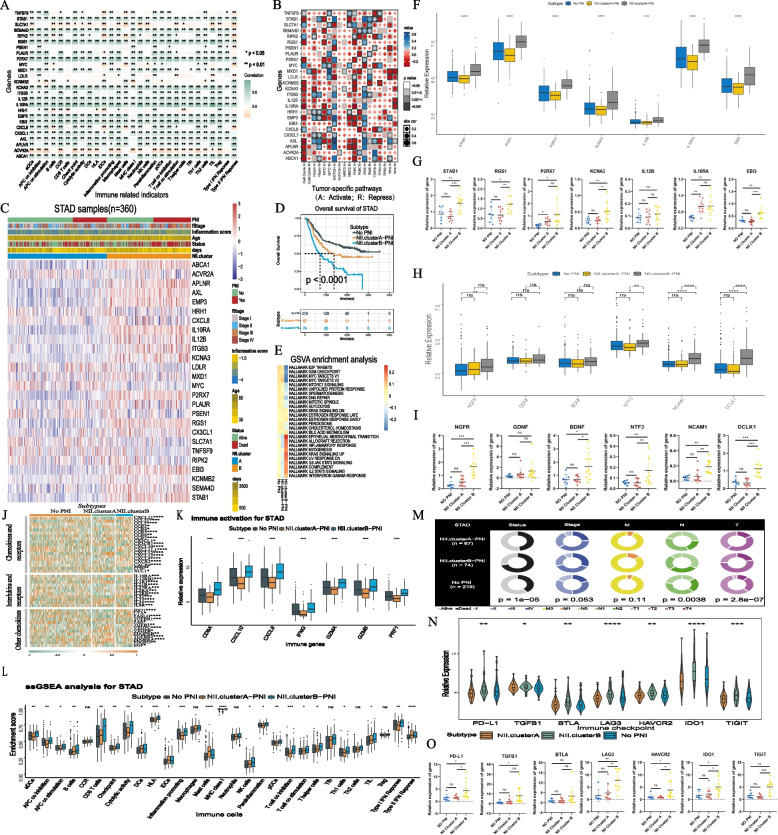
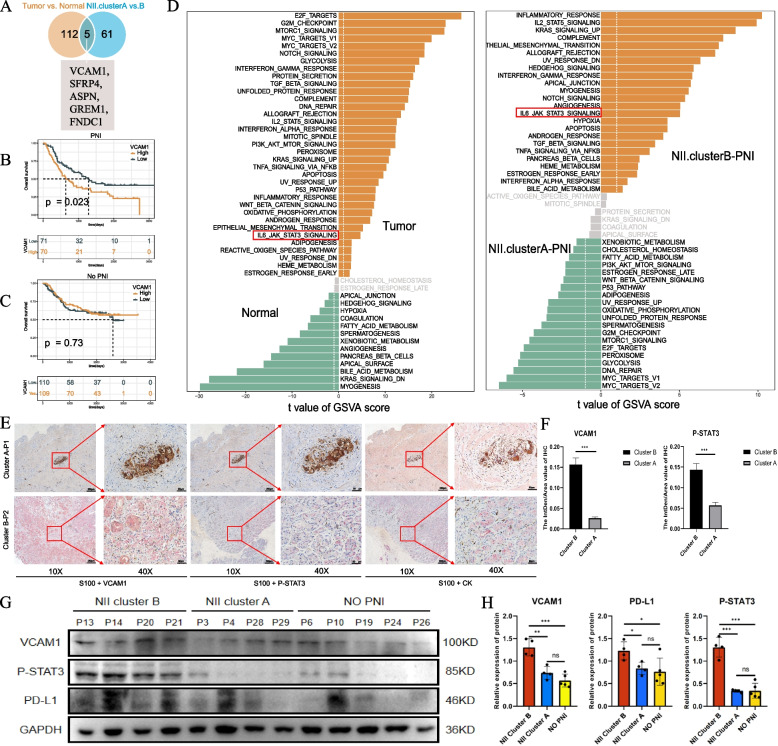
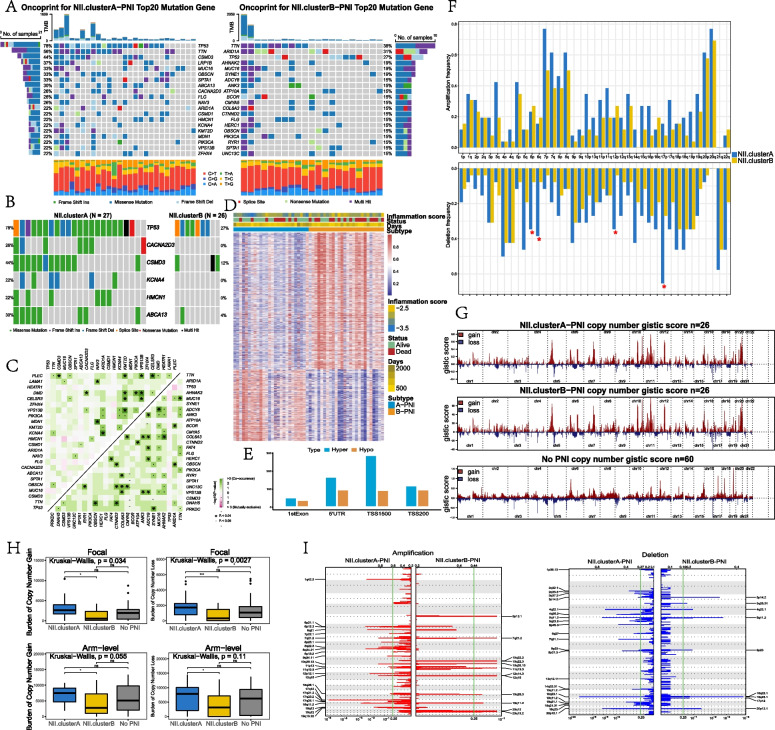
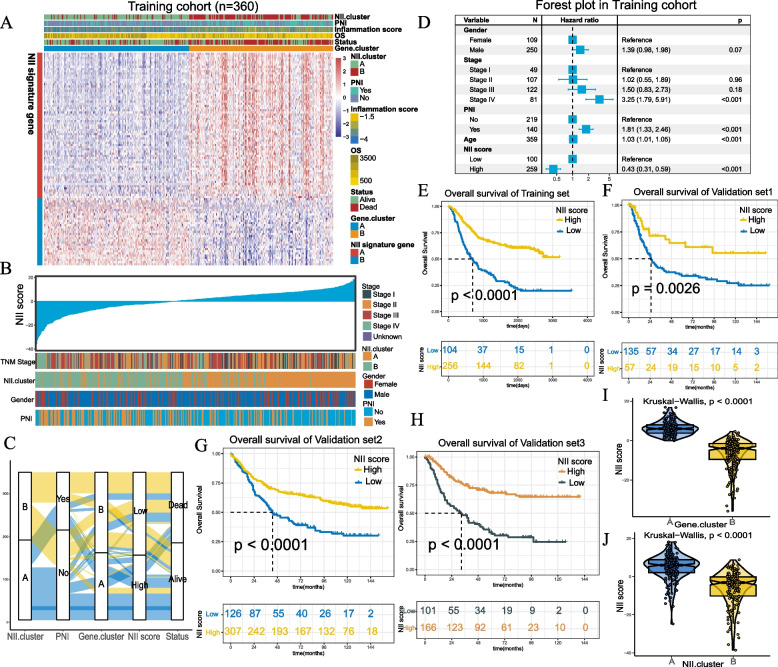
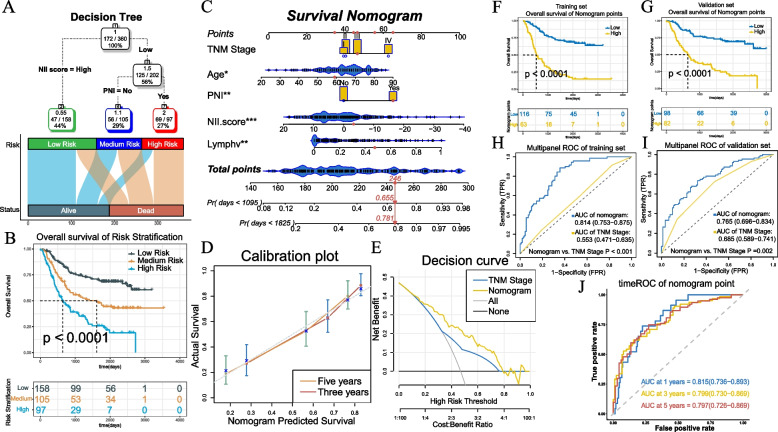
Methods: Fifteen independent cohorts were enrolled in this study. An inflammatory score was developed and validated in GC. Based on PNI-related prognostic inflammatory signatures, patients were divided into Clusters A and B using unsupervised clustering. The characteristics of clusters and the potential regulatory mechanism of key genes were verified by RT-PCR, western-blot, immunohistochemistry and immunofluorescence in cell and tumor tissue samples.The neuroinflammation infiltration (NII) scoring system was developed based on principal component analysis (PCA) and visualized in a nomogram together with other clinical characteristics.

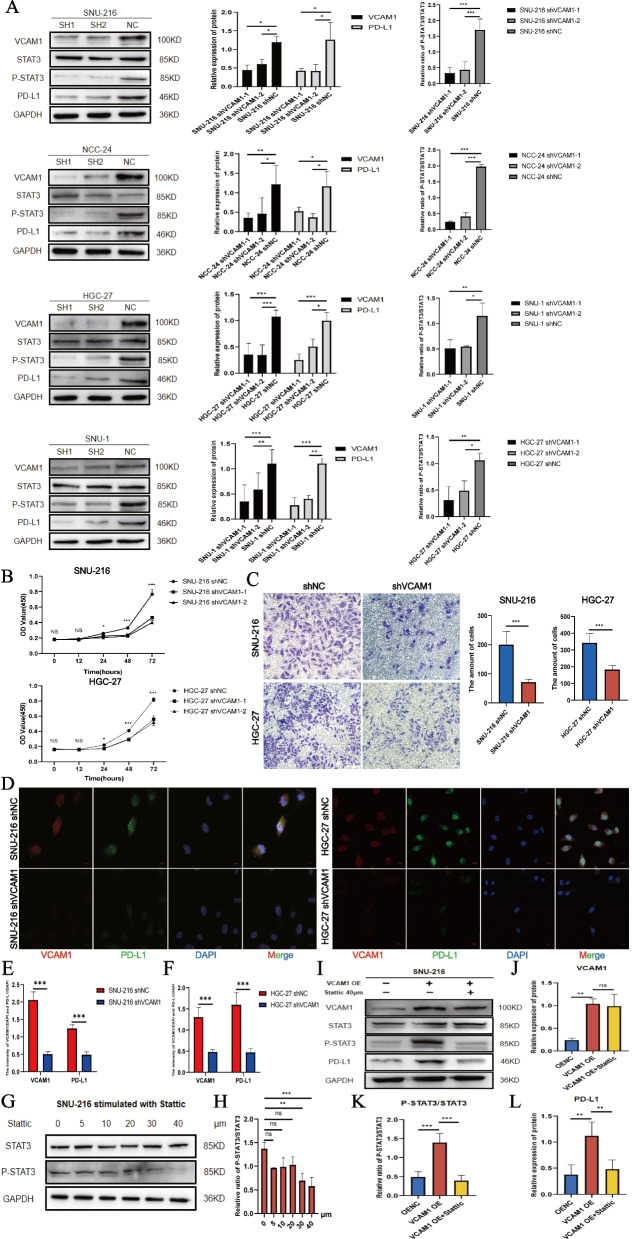
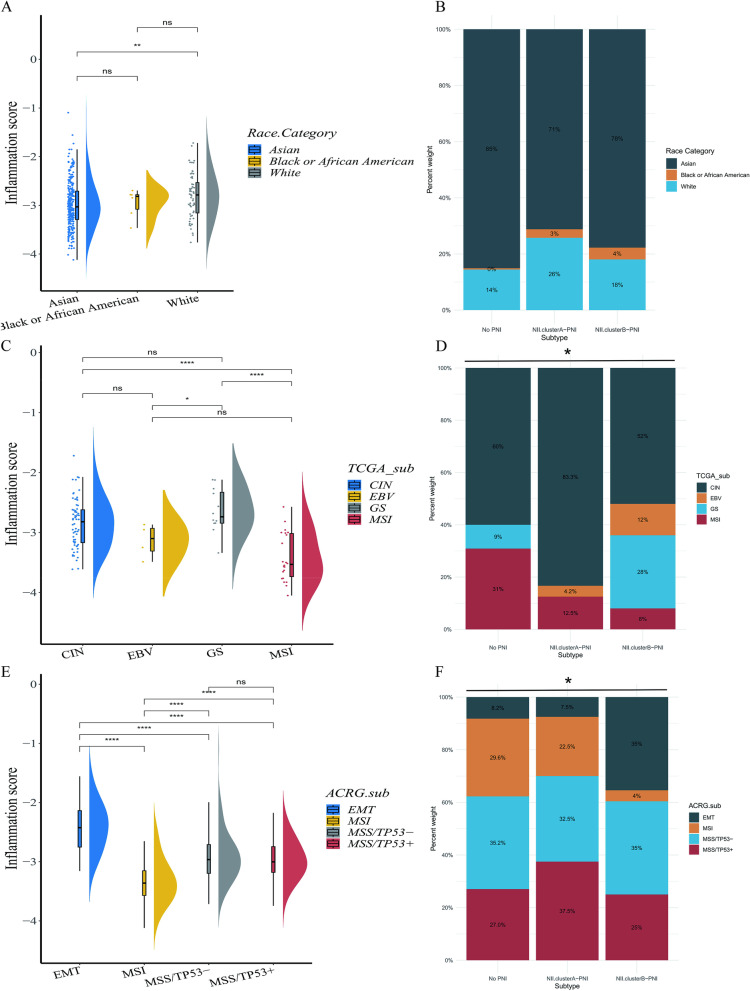
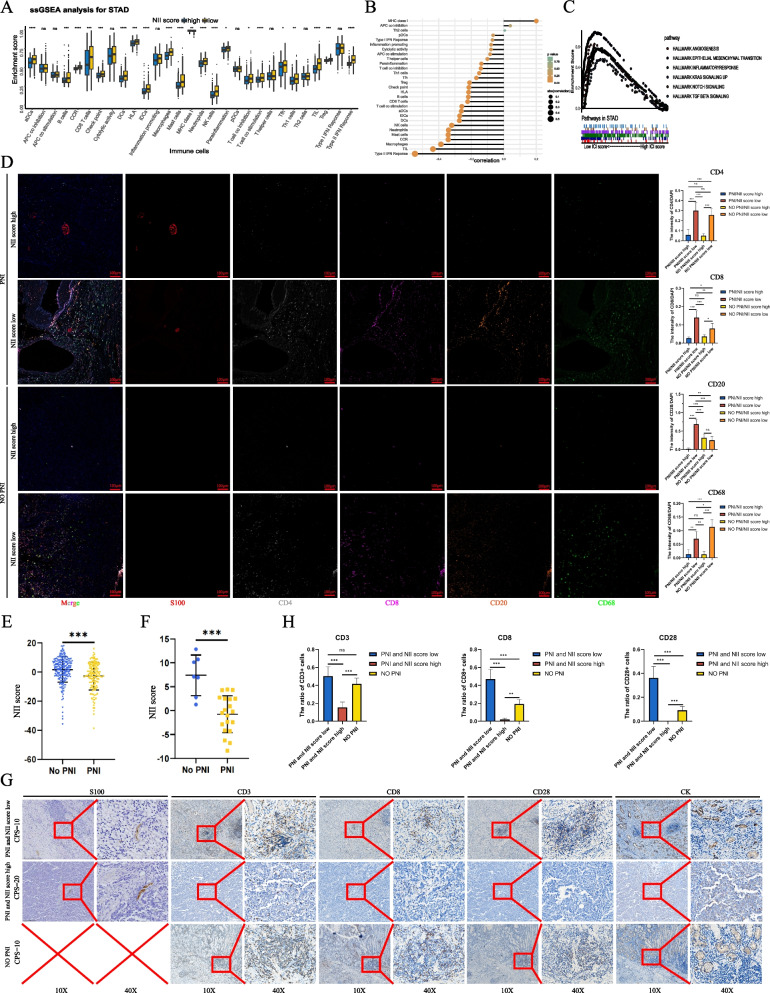
Results: Inflammatory scores were higher in GC patients with PNI compared with those without PNI (P < 0.001). NII.clusterB patients with PNI had abundant immune cell infiltration in the TME but worse prognosis compared with patients in the NII.clusterA patients with PNI and non-PNI subgroups. Higher immune checkpoint expression was noted in NII.clusterB-PNI. VCAM1 is a specific signature of NII.clusterB-PNI, which regulates PD-L1 expression by affecting the phosphorylation of STAT3 in GC cells. Patients with PNI and high NII scores may benefit from immunotherapy. Patients with low nomogram scores had a better prognosis than those with high nomogram scores.

Conclusions: Inflammation mediated by PNI is one of the results of tumor-nerve crosstalk, but its impact on the tumor immune microenvironment is complex. Assessing the inflammation features of PNI is a potential method in predicting the response of immunotherapy effectively.

Keywords: Gastric cancer(GC); Inflammatory; Neuroinflammation infiltration(NII) score system; Perinueral invasion(PNI); Tumor microenvironment(TME).


Conflict of interest statement

The authors declare no conficts of interest.

Figures

Fig. 1
Fig. 1
A Overall survival curves for of all GC patients in the training cohort. B Multivariate Cox regression analyses of significant prognostic factors. CD Kaplan–Meier curves for the patients with high/low inflammation score in the training cohort and CRC cohort. EF Gene Set Enrichment Analysis (GSEA) of high/low inflammation score groups in the training cohort and CRC cohort. G GO enrichment analysis of the significantly enriched biological processes between high and low inflammation score groups. H Derived ssGSEA scores of immune signatures obtained from STAD gene expression data for the groups of high and low inflammation score. IThe comparing of Inflammation score between PNI and non-PNI groups in the training cohort and CRC cohort
Fig. 2
Fig. 2
A The correlation between 26 inflammation-related genes and immune-related signatures. The correlation between the expression level of the 26 inflammation-related genes and crucial tumor-specific pathways is shown in the heatmap. C Unsupervised clustering of 26 inflammation-related genes in the training cohort. The distribution of clinicopathological characteristics, including age, survival status, overrall survival, PNI, inflammation score and TNM stage, as well as the NII.cluster, are shown above. Rows represent genes, and columns represent samples. D Kaplan–Meier curves for overall survival (OS) of all GC patients in three subtypes(NII.clusterA-PNI, NII.clusterB-PNI and No PNI) (Log rank test, p < 0.0001). E GSVA analysis reveals enriched vital signal pathways in HALLMARK among three subtypes. Rows and coloumns are defined by the HALLMARK signal pathway and consensus scores for each subtype, respectively. F, G The genes expression of STAB1, RGS1, P2RX7, KCNA3, IL12B, IL10RA and EBI3 in different NII clusters of training cohort and Nanfang cohort2(RT-PCR).The asterisks represented the statistical P-value (*P < 0.05; **P < 0.01; ***P < 0.001). H, I The PNI related marker expression in different NII clusters of training cohort and Nanfang cohort2(RT-PCR).The asterisks represented the statistical P-value (*P < 0.05; **P < 0.01; ***P < 0.001). J The thermogram exhibits variations in gene expression of chemokines, interlukins and other cytokines among the three subtypes (Kruskal–Wallis test). Asterisk indicates P-value(*P < 0.05; **P < 0.01; ***P < 0.001). K The expression of immune-activation-relevant genes (CD8A, CXCL10, CXCL9, IFNG, GZMA, GZMB, PRF1) among three subtypes. (L)The fraction of tumor-infiltrating immune signatures calculated by ssGSEA algorithm in three subtypes. Within each subtype, the scattered dots represent immune-signature values. The asterisks represented the statistical P-value (*P < 0.05; **P < 0.01; ***P < 0.001). M Pie charts showing the Chi-squared test of clinicopathologic factors for three subtypes in the Multi-cohort. N, O The comparing of immune-checkpoint genes in three subtypes of training cohort and Nanfang cohort2(RT-PCR), including PD-L1, TGFB1, BTLA,LAG3, HAVCR2, IDO1, TIGIT. The asterisks represented the statistical P-value (*P < 0.05; **P < 0.01; ***P < 0.001)
Fig. 3
Fig. 3
A Five overlapping genes (VCAM1, SFRP4, ASPN, GREM1 and FNDC1) in the intersection of “Tumor vs. Normal” and “NII.clusterA-PNI vs. NII.clusterB-PNI” are considered as genes playing potential regulatory roles in the inflammation mediated by perineural invasion. B-C Kaplan–Meier curves for the patients with high and low VCAM1 expression in PNI group (Log rank test, p = 0.023.) and No PNI group(Log rank test, p = 0.73.) D A marked signal pathway (IL6-JAK-STAT3 SIGNALING) tabbed by red box is regarded important in the inflammation mediated by perineural invasion. E Representative IHC results of VCAM1, P-STAT3 and CK in tumor slices of NII.clusterA-PNI and NII.clusterB-PNI patients.(S100 marked nerves in brown,VCAM1,P-STAT3 and CK were in pink) F The statistical results of VCAM1 and p-STAT3 in (E).(All P < 0.001) G, H The WB results of VCAM1,P-STAT3 and PD-L1 protein expression of tumor tissue from No PNI,NII.clusterA-PNI and NII.clusterB-PNI patients.Statistics are based on the average of the gray values of the bands from three independent experiments.The asterisks represented the statistical P-value (*P < 0.05; **P < 0.01; ***P < 0.001)
Fig. 4
Fig. 4
A VCAM1,STAT3, P-STAT3 and PD-L1 protein expression of shRNA cell models in SNU-216,NCC-24,HGC-27 and SNU-1(VCAM1 sh1,sh2 and natural contrast).Statistics are based on the average of the gray values of the bands from three independent experiments.The asterisks represented the statistical P-value (*P < 0.05; **P < 0.01; ***P < 0.001). B The OD value of CCK8 analysis of VCAM1 silencing of three independent experiments in SNU-216 and HGC-27(shVCAM1 vs. shNC,*P < 0.05; **P < 0.01; ***P < 0.001) C The representative figures of transwell experiments of SNU-216 and HGC-27 for culturing 48 h.The statistical results were performed in 5 random views of per group under 20X. (*P < 0.05; **P < 0.01; ***P < 0.001) (D) The representative immunofluorescence figures of SNU-216 and HGC-27(shVCAM1 vs. shNC,VCAM1 in red,PD-L1 in green and DAPI in blue,under 40X). E, F The statistical results of VCAM1 and PD-L1 in (D). (*P < 0.05; **P < 0.01; ***P < 0.001). G The WB results of SNU-216 stimulated with stattic. H The statistical result of three independent experiments in (G). (*P < 0.05; **P < 0.01; ***P < 0.001). I The WB results of SNU-216 VCAM1-OE stimulated with stattic. J, K, L The statistical result of three independent experiments in (I). (*P < 0.05; **P < 0.01; ***P < 0.001)
Fig. 5
Fig. 5
A Mutation landscape of NII.clusterA-PNI and NII.clusterB-PNI subtypes. The 20 genes with the highest mutation frequency are shown and samples are sorted by the TMB in each subtype. The small figure above shows the TMB, the numbers on the right exhibit the mutation frequency of each regulator, and the figure laterally shows the proportion of each variant. B Waterfall plot reveals significantly differentially mutated genes between NII.clusterA-PNI and NII.clusterB-PNI subtypes(Fisher exact test, p < 0.05). Individual patient is represented in each column. The numbers on either hand show the mutation frequency of each gene. Different colors represent different mutation modes. C Interaction effect of genes mutating differentially in patients in the NII.clusterA-PNI and NII.clusterB-PNI subtypes. D Heatmap of differentially methylated CpG sites in the promoter region between samples of NII.clusterA-PNI and NII.clusterB-PNI subtypes. F The diversity of methylation of the different regions of genes in the promoter region including 1stExon, SUTR, TSS1500 and TSS200. G Comparisons of arm-level amplification and deletion frequencies between NII.clusterA-PNI and NII.clusterB-PNI subtypes. H Copy number profiles for three subtypes, with gains in orange and losses in green. Gene segments are placed according to their location on chromosomes, ranging from chromosome 1 to chromosome 22. I Distribution of CNV with focal-level and arm-level copy number alterations among three subtypes. (ns P > 0.05, *P < 0.05, **P < 0.01, ***P < 0.001, ****P < 0.0001) Detailed cytoband with focal amplification (up) and focal deletion (down) in NII.clusterA-PNI and NII.clusterB-PNI
Fig. 6
Fig. 6
A The analysis of inflammation score among different races in training cohort. B The distribution of different races in NII classification in training cohort. C The analysis of inflammation score among TCGA subtypes in training cohort. D The distribution of TCGA subtypes in NII classification in training cohort. E The analysis of inflammation score among ACRG subtypes in training cohort. F The distribution of TCGA subtypes in NII classification in training cohort.(All of above,ns P > 0.05, *P < 0.05, **P < 0.01, ***P < 0.001, ****P < 0.0001)
Fig. 7
Fig. 7
A Identification of NII score subgroups of STAD patients. B An overview of the association between known clinical and inflammation features (TNM stages, NII.clusters, gender and PNI) and NII score. Columns represent samples sorted by NII score from low to high (top row). Rows represent known clinical and inflammation features. C Alluvial diagram of NII.clusters in groups with different PNI groups, Gene.clusters, NII score, and survival status. D Forest plot displays the result of multivariate Cox regression analyses of significant prognostic factors. (Log rank test p < 0.001.) EH Kaplan–Meier analyses demonstrate that patients with higher NII score exhibit worse prognosis in the training cohort (P < 0.0001), validation cohort 1 (P = 0.0026), validation cohort 2 (P < 0.0001) and validation cohort 3(P < 0.0001). IJ Relative distribution of NII score in groups with Gene.clusters and NII clusters. The thick line represents the median value. The bottom and top of the boxes are the 25th and 75th percentiles (interquartile range). The differences between groups were both compared through the Kruskal–Wallis test (p < 0.0001)
Fig. 8
Fig. 8
A Derived ssGSEA scores of immune signatures obtained from STAD gene expression data for the groups of high and low NII score. The range of P values were labeled above each boxplot with asterisks.(ns P > 0.05, *P < 0.05, **P < 0.01, ***P < 0.001, ****P < 0.0001) B The correlation of immune cells and NII score in the training cohort. The range of P values are represented by color from yellow to green. C The significantly enriched signal pathways from Gene Set Enrichment Analysis (GSEA) performed between the subgroups of high and low NII score in the Multi cohort. D The representative results of multiple immunofluorescence staining of subgroups(PNI with high NII score,PNI with low NII score,non-PNI with high NII score and non-PNI with low NII score).(S100 in red,CD68 in green,CD20 in orange,CD8 in purple,CD4 in white and DAPI in blue.The statistical results were performed in 5 random views of per group under 40X. *P < 0.05; **P < 0.01; ***P < 0.001) EF The comparing between PNI and non-PNI patients in training cohort and Nanfang cohort 2. G The representative figures of IHC analyse of subgroups(PNI with high NII score, PNI with low NII score and non-PNI patients, CPS scores were obtained from clinical pathological report) accepting anti-PD1 treatment. (S100,CD3,CD8,CD28 and CK were stained with DAB in brown,nucleus were stained with hematoxylin in purple) (H)The statistical result of CD3,CD8 and CD28 were performed in 5 random views of per group under 40X.(*P < 0.05; **P < 0.01; ***P < 0.001)
Fig. 9
Fig. 9
A A survival decision tree built to optimize the prognostic stratification combined with a alluvial diagram of risk stratification and survival status. B Significant differences of overall survival (OS) are observed among the three risk subgroups (P < 0.0001). C A personalized scoring nomogram is generated to predict 3- and 5-year OS probability with five parameters( TNM Stage, Age, PNI, Lymphv and NII score), and the arrow shows an example. D Calibration curves of 3-year and 5-year overall survival (OS) prediction are close to the ideal performance (45-degree line). E Decision curve demonstrates that the nomogram exhibited more powerful capacity of survival prediction compared with TNM stage system. F-G Kaplan–Meier curves for the patients with high and low overall survival of Nomogram points in the training cohort (Log rank test, p < 0.0001.) and validation cohort (Log rank test, p < 0.0001.). H-I The comparing between nomogram and TNM system with ROC in training cohort and validation cohort. J Time-dependent ROC curves of nomogram in training cohort

References

    1. Bapat AA, et al. Perineural invasion and associated pain in pancreatic cancer. Nat Rev Cancer. 2011;11(10):695–707. - PubMed
    1. Wang K, et al. Nervous system and gastric cancer. Biochim Biophys Acta Rev Cancer. 2020;1873(1):188313. - PubMed
    1. Lubig S, et al. Quantitative perineural invasion is a prognostic marker in prostate cancer. Pathology. 2018;50(3):298–304. - PubMed
    1. Batsakis JG. Nerves and neurotropic carcinomas. Ann Otol Rhinol Laryngol. 1985;94(4 Pt 1):426–427. - PubMed
    1. Chen SH, et al. Perineural invasion of cancer: a complex crosstalk between cells and molecules in the perineural niche. Am J Cancer Res. 2019;9(1):1–21. - PMC - PubMed