. 2023 Aug 10;12(1):71.
doi: 10.1186/s40164-023-00434-x.

Lysin (K)-specific demethylase 1 inhibition enhances proteasome inhibitor response and overcomes drug resistance in multiple myeloma

Affiliations

Lysin (K)-specific demethylase 1 inhibition enhances proteasome inhibitor response and overcomes drug resistance in multiple myeloma

Cecilia Bandini et al. Exp Hematol Oncol. .

Erratum in

Abstract

Background: Multiple myeloma (MM) is an incurable plasma cell malignancy, accounting for approximately 1% of all cancers. Despite recent advances in the treatment of MM, due to the introduction of proteasome inhibitors (PIs) such as bortezomib (BTZ) and carfilzomib (CFZ), relapses and disease progression remain common. Therefore, a major challenge is the development of novel therapeutic approaches to overcome drug resistance, improve patient outcomes, and broaden PIs applicability to other pathologies.

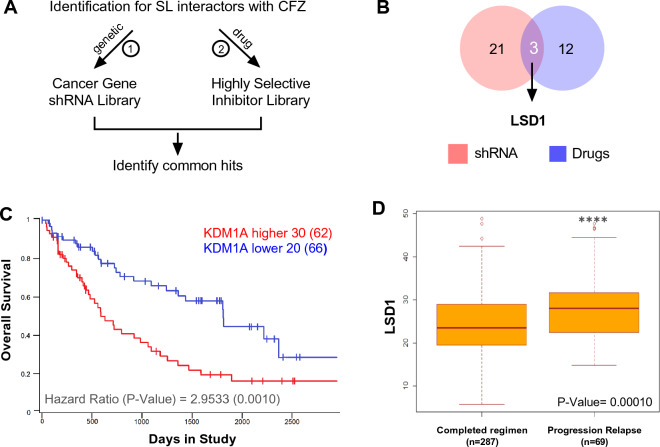
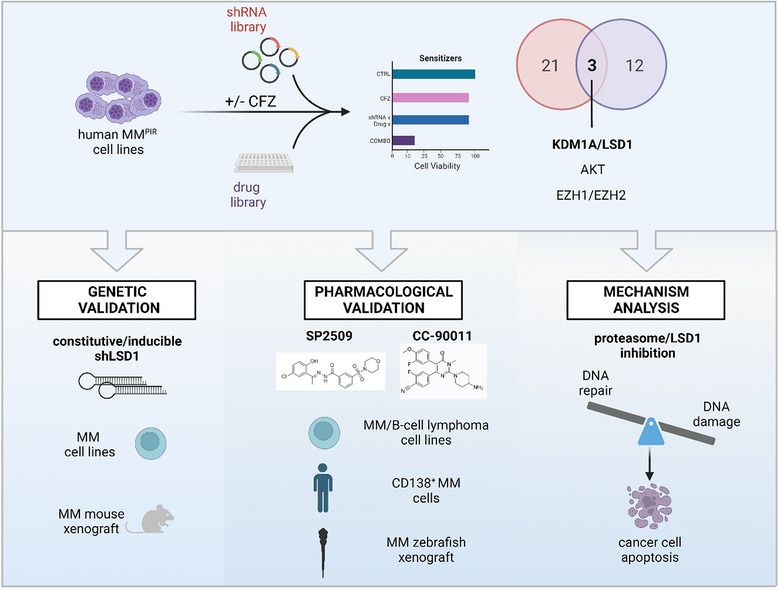
Methods: We performed genetic and drug screens to identify new synthetic lethal partners to PIs, and validated candidates in PI-sensitive and -resistant MM cells. We also tested best synthetic lethal interactions in other B-cell malignancies, such as mantle cell, Burkitt's and diffuse large B-cell lymphomas. We evaluated the toxicity of combination treatments in normal peripheral blood mononuclear cells (PBMCs) and bone marrow stromal cells (BMSCs). We confirmed the combo treatment' synergistic effects ex vivo in primary CD138+ cells from MM patients, and in different MM xenograft models. We exploited RNA-sequencing and Reverse-Phase Protein Arrays (RPPA) to investigate the molecular mechanisms of the synergy.

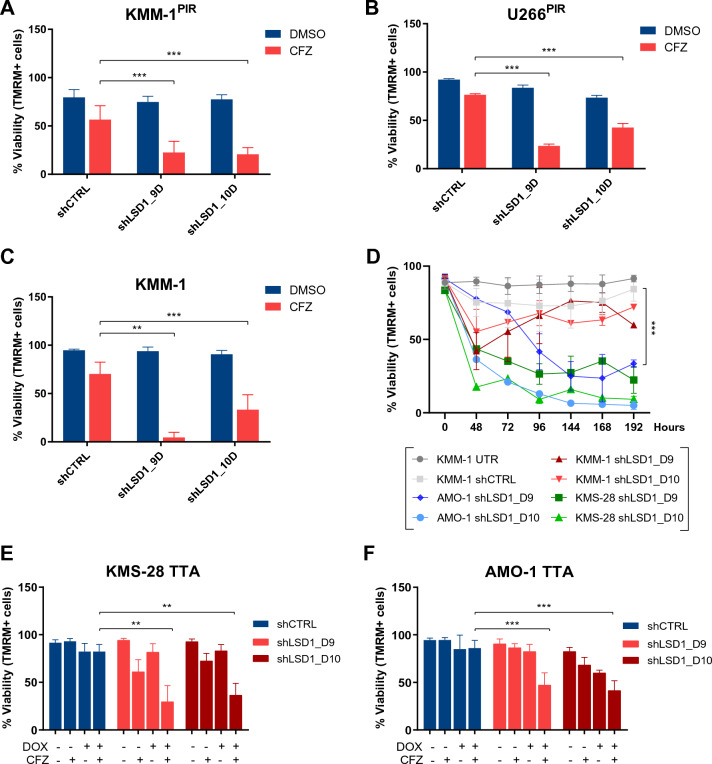
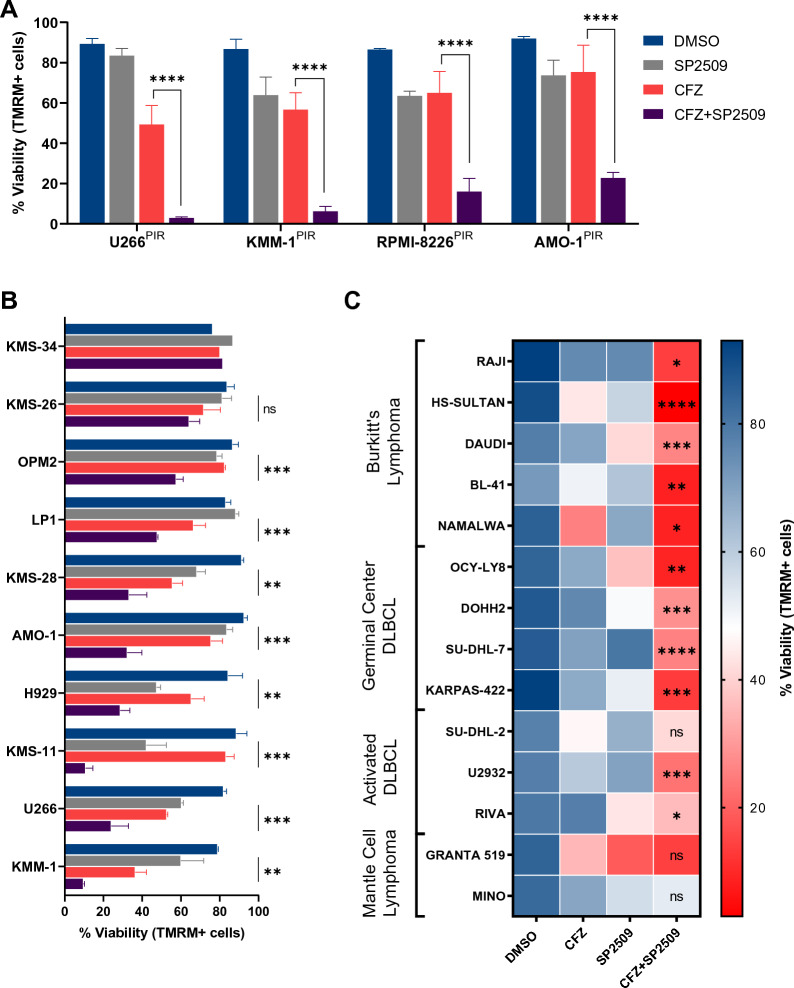
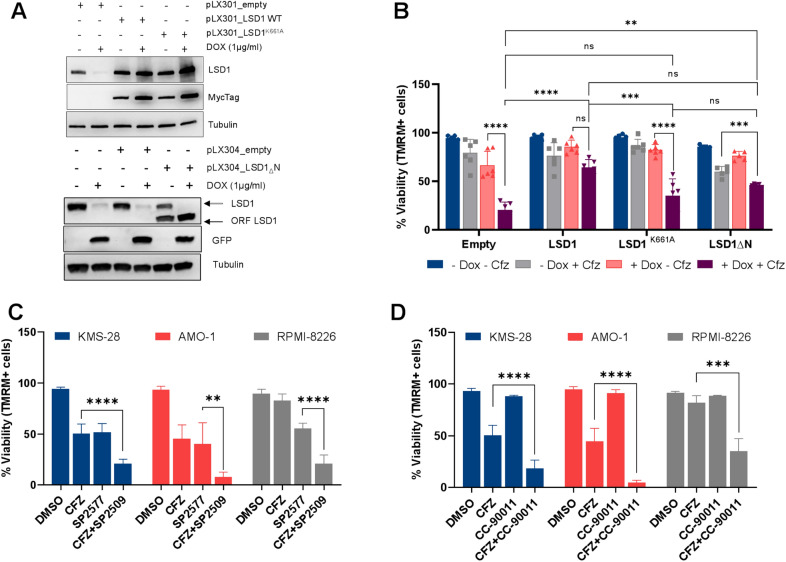
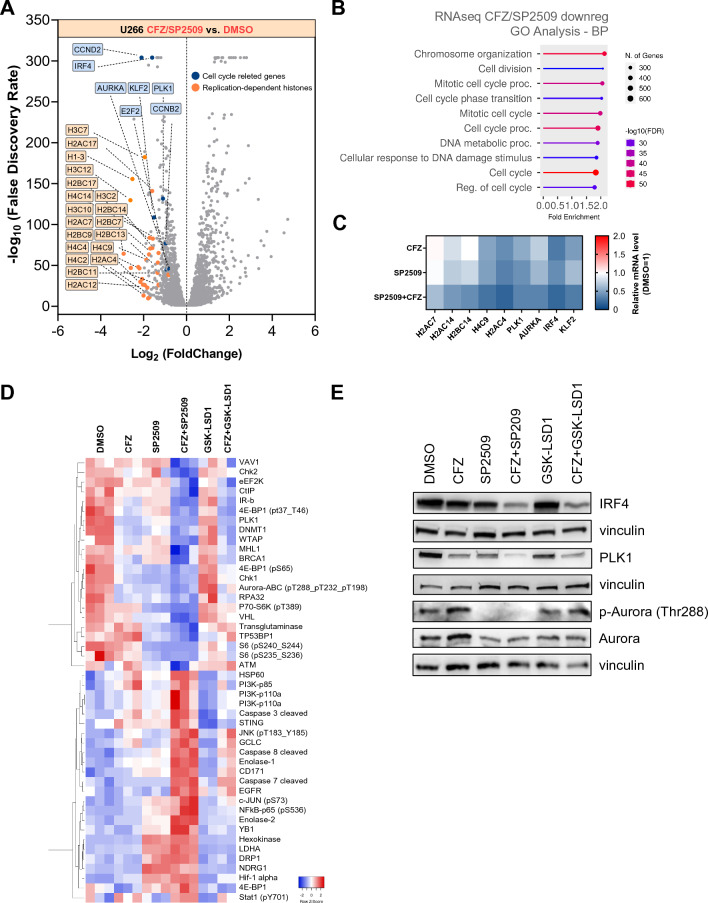
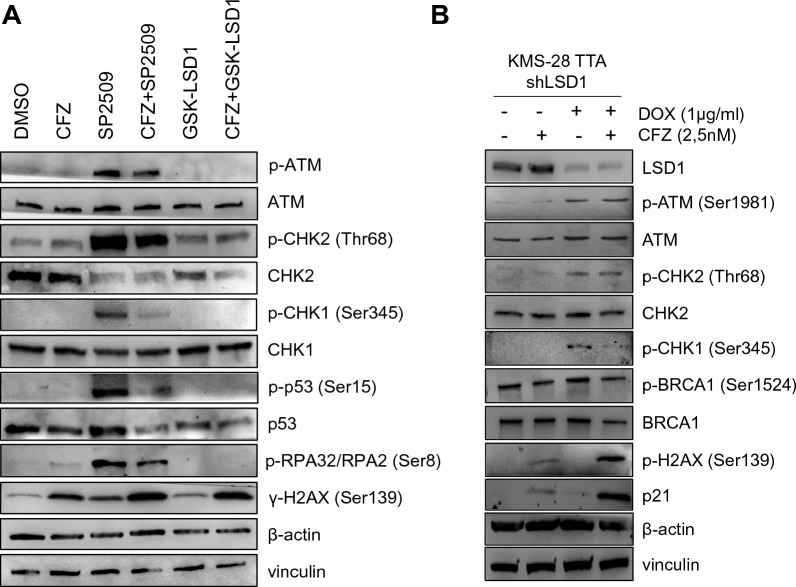
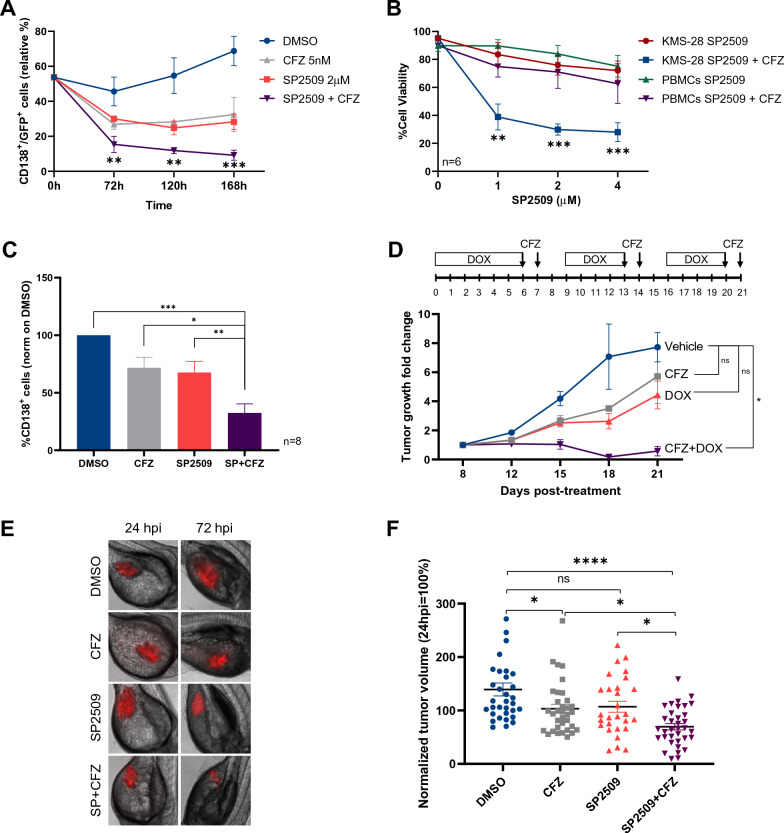
Results: We identified lysine (K)-specific demethylase 1 (LSD1) as a top candidate whose inhibition can synergize with CFZ treatment. LSD1 silencing enhanced CFZ sensitivity in both PI-resistant and -sensitive MM cells, resulting in increased tumor cell death. Several LSD1 inhibitors (SP2509, SP2577, and CC-90011) triggered synergistic cytotoxicity in combination with different PIs in MM and other B-cell neoplasms. CFZ/SP2509 treatment exhibited a favorable cytotoxicity profile toward PBMCs and BMSCs. We confirmed the clinical potential of LSD1-proteasome inhibition in primary CD138+ cells of MM patients, and in MM xenograft models, leading to the inhibition of tumor progression. DNA damage response (DDR) and proliferation machinery were the most affected pathways by CFZ/SP2509 combo treatment, responsible for the anti-tumoral effects.

Conclusions: The present study preclinically demonstrated that LSD1 inhibition could provide a valuable strategy to enhance PI sensitivity and overcome drug resistance in MM patients and that this combination might be exploited for the treatment of other B-cell malignancies, thus extending the therapeutic impact of the project.

Keywords: B-cell neoplasms; Drug resistance; LSD1; Multiple myeloma; Proteasome inhibitors; Synthetic lethality.


Conflict of interest statement

The authors declare that they have no competing interests.

Figures

Fig. 1
Fig. 1
Loss-of-function screenings converge on KDM1A/LSD1 as synthetic lethal target to the proteasome inhibitor carfilzomib. A Schematic representation of the experimental strategy used in this study, showing the workflow of the loss-of-function screening to identify synthetic lethal targets for carfilzomib. SL, synthetic lethal. B Venn diagram of the top target hits found with shRNA and drug library screening indicating that KDM1A/LSD1 is a common hit from both screens. C Analysis of the MMRF CoMMpass dataset IA18 showed a significant correlation between LSD1 expression (RNAseq, TPM) and overall survival in 128 MM patients (P = 0.001). Sub-populations with low (blue line) or high (red line) LSD1 expression were defined using one standard deviation from the mean expression. D Box plots of gene expression levels in 287 MM cases that completed a regimen compared to 69 MM patients who experienced disease progression/relapse after bortezomib treatment (CoMMpass dataset). Differential expression was tested by the Wilcoxon rank-sum test with continuity correction (P = 0.0001018)
Fig. 2
Fig. 2
LSD1 silencing enhances sensitivity to CFZ in PI-resistant and PI-sensitive MM cell lines. A KMM-1PIR and B U266PIR cell lines were transduced with control shRNA (shCTRL) or shRNA targeting LSD1 (shLSD1_D9, shLSD1_D10) and treated with CFZ (20 nM for KMM-1PIR and 10 nM forU266PIR) or DMSO. Cell viability was measured by TMRM staining-flow cytometry 72 hpt. C KMM-1 cell line was transduced with shCTRL or with indicated shLSD1 and treated with CFZ (2.5 nM). Cell viability was measured by TMRM staining-flow cytometry 72 hpt. D KMM-1, AMO-1, and KMS-28 cell lines were transduced with shCTRL or with indicated shLSD1 following puromycin selection (1.5 µg/ml). Cell viability was measured by TMRM staining-flow cytometry over time. E Inducible KMS-28 TTA and F inducible AMO-1 TTA cells were transduced with shCTRL or with reported shLSD1 and treated or not with DOX (1 µg/ml) for 120 h and then 72 h with CFZ (2.5 nM for KMS-28 and 1.25 nM for AMO-1). Cell viability was measured by TMRM staining-flow cytometry 72 hpt. Data are the means ± standard deviation (s.d.) of at least three independent experiments. Asterisks denote statistical significance (**P < 0.01; ***P < 0.001). PIR: proteasome inhibitors resistant; hpt: hours post-treatment; TMRM: tetramethylrhodamine; DOX: doxycycline. E Inducible KMS-28 TTA and F inducible AMO-1 TTA were transduced with shCTRL or with reported shLSD1 and treated or not with DOX (1 µg/ml) for 120 h and then 72 h with CFZ (2.5 nM for KMS-28 and 1.25 nM for AMO-1). Cell viability was measured by TMRM staining-flow cytometry 72 hpt
Fig. 3
Fig. 3
Pharmacological inhibition of LSD1 enhances sensitivity to CFZ in B-cell malignancies. A U266PIR (20 nM CFZ; 0.5 µM SP2509), KMM-1PIR (10 nM CFZ; 0.5 µM SP2509), RPMI-8226PIR (60 nM CFZ; 1.5 µM SP2509), and AMO-1PIR (20 nM CFZ; 0.5 µM SP2509) cells were treated with SP2509, CFZ or the combination. Cell viability was measured by TMRM staining-flow cytometry 48-, 120-, 72-, and 96- hpt, respectively. B MM cell lines were treated with CFZ (1.25 nM for AMO-1, OPM2, LP1, U266; 2.5 nM for KMS-28, KMM-1; 5 nM for KMS-11, KMS-34, KMS-26, NCI-H929), SP2509 (0.1 µM for KMS-11, KMS-26, KMS-34; 0.25 µM for KMS-28; 0.5 µM for AMO-1, H929, U266, KMM-1, OPM2, LP1), or the combination. Cell viability was measured by TMRM staining-flow cytometry spanning a range between 24 and 120 hpt. C Sensitivity heatmap to DMSO, CFZ, SP2509, or the combination in a panel of B-cell lymphoma cell lines. Cells were treated with CFZ (1.25 nM for BL-41; 2 nM for U2932; 2.5 nM for Mino, SU-DHL-2, Daudi, Namalwa, Riva, Granta519; 3.75 nM for Karpas-422; 5 nM for Raji, HS-Sultan, DOHH-2, SU-DHL-7; 7.5 nM for OCI-Ly8), SP2509 (0.25 µM for Namalwa; 0.5 µM for Raji, HS-Sultan, Daudi, OCI-Ly8, Granta-519; 0.75 µM for Mino, Riva, Karpas-422; 1 µM for DOHH-2, BL-41, Su-DHL-7), or the combination. Cell viability was measured by TMRM staining-flow cytometry at 72 or 96 hpt. Heatmap was generated using RStudio and ggplot2 package. Data are the means ± s.d. of at least three independent experiments. Asterisks denote statistical significance (*P < .05; **P < .01; ***P < .001; ****P < .0001; ns > .05). hpt: hours post-treatment
Fig. 4
Fig. 4
LSD1 specifically mediates CFZ sensitivity. A Inducible KMS-28 TTA_shLSD1-D6 cells were transduced with shRNA-resistant and Myc_tagged LSD1 WT (pLX301_LSD1 WT), catalytically inactive LSD1K661A (pLX301_LSD1K661A), N-terminal lacking LSD1 (pLX304_LSD1ΔN) or empty vector (pLX301_empty, pLX304_empty). Cells were treated or not with DOX (1 µg/ml) and pellets collected after 5 days. LSD1, MycTag and GFP expression were analyzed by western blot. α-tubulin was used for protein loading normalization. B Inducible KMS-28 TTA_shLSD1-D6 cells were pre-treated with DOX (1 µg/ml) for 5 days, then with 2.5 nM CFZ. Cell viability was measured by TMRM staining-flow cytometry 120 h post-CFZ treatment. C, D Indicated cells were treated with SP2577 (2 µM for AMO-1 and RPMI-8226; 4 µM for KMS-28), CC-90011 (20 µM), CFZ (2.5 nM for KMS-28 and RPMI-8226; 5 nM for AMO-1) or the combinations. Cell viability was measured by TMRM staining-flow cytometry 72 hpt. Data are the means ± s.d. of at least three independent experiments. (**P < .01; ***P < .001; ****P < .0001; ns > .05)
Fig. 5
Fig. 5
SP2509/CFZ treatment affects cell cycle regulation and apoptosis. A Volcano plot showing differentially expressed genes (DEGs) with |Log2FoldChange|> 0.5 between CFZ/SP2509 treatment and DMSO control. Analysis was performed 24 h post-treatment. Blue dots represent significantly downregulated genes related to cell cycle processes, orange dots represent significantly downregulated genes belonging to the replication-dependent histones family. B Dot plot graph of enriched Gene Ontology (GO) terms from genes in A. The nine GO processes with the largest gene ratios are plotted in order of fold enrichment. The size of the dots represents the number of genes in the significant DEG list associated with the GO term, and the color of the dots represents the P-adjusted values. C Representative heatmap of RT-qPCR validation performed in the U266 cell line treated with CFZ (2.5 nM), SP2509 (1 µM), or the combination for 48 h. HUPO was used as a housekeeping gene. DMSO-treated cells were used to normalize mRNA expression levels equal to 1. D Heatmap showing non-supervised hierarchical clustering of normalized reverse phase protein array (RPPA) intensities using the average-linkage method and Pearson distance. U266 cells were treated with DMSO (n = 3), CFZ (2.5 nM, n = 3), SP2509 (1 µM, n = 3), CFZ/SP2509 (n = 3), GSK-LSD1 (1 µM, n = 2), or CFZ/GSK-LSD1 (n = 2). Pellets were collected 48 hpt. E Western blot analysis of U266 cells treated with the indicated drugs. Pellets were collected 48 h post-treatment. Vinculin was used for protein loading normalization. DEG: differential expressed genes, GO: gene ontology; RPPA: reverse phase protein array
Fig. 6
Fig. 6
LSD1 and proteasome inhibition activate the DNA damage pathway. A U266 cells were treated with 2.5 nM CFZ, 1 µM SP2509, 1 µM GSK-LSD1, or the combinations. Cell pellets were collected at 48 h post-treatment: Expression of the indicated proteins was analyzed by Western blot. β-actin and vinculin were used as loading controls. B KMS28-TTA_shLSD1-D6 cells were pre-treated with DOX for 5 days and then treated with CFZ. Cell pellets were collected 72 h post-CFZ treatment, and protein expression was analyzed by Western blot. β-actin and vinculin were used as loading controls
Fig. 7
Fig. 7
LSD1 and proteasome inhibition have anti-multiple myeloma activity in vivo. A U266 cell lines were cultured on a layer of GFP+ HS-5 stromal cells and treated with the indicated concentrations of SP2509, CFZ, or the combination. Percentage of MM cells was measured overtime by FACS analysis after anti-CD138-APC staining and the ratio with GFP + cells was calculated. Data are the means ± s.d. of four independent experiments B KMS-28 and PBMCs from six healthy donors were treated or not with 2.5 nM of CFZ and increasing concentration of SP2509, as reported. Cell viability was estimated by FACS analysis with Annexin V-PI staining, 72 hpt. Data are the means ± s.d. of 6 independent experiments. C Buffy coats derived from bone marrow aspirates of MM patients were treated with CFZ (2.5 nM) in combination or not with SP2509 (4 µM). Cell viability was estimated by flow cytometry measuring PI and CD138+ cells 72 hpt. Histograms represent the percentage of viable cells normalized vs DMSO samples. Data are the means ± s.e.m. of 8 independent MM patients. D Growth rate fold change (normalized on tumor volume measured 8 days post-treatment) of KMS-28-TTA_shLSD1 cells injected subcutaneously into the flanks of NSG mice. When tumor masses became palpable, mice were randomized for treatment with vehicle (n = 22), 4 mg/kg CFZ (n = 19), 0.25 mg/ml DOXY (n = 11), or a combination of both compounds (n = 7) over 3 weeks. The timeline above shows the schedule of treatment followed for in vivo treatments. E Fluorescent microscopy images (×10 magnification) of DsRed+KMS-28 TTA xenografts at 24 hpi (left) and 72 hpi (right) into the yolk of zebrafish embryos treated with indicated compounds. F Dot-plot shows the trend in tumor burden at 72 hpi, normalized to tumor area at 24 hpi (DMSO = 24 embryos; CFZ = 24 embryos; SP2509 = 24 embryos; SP2509/CFZ = 30 embryos). (**P < 0.01; ***P < 0.001; ****P < 0.0001). PBMC, Peripheral blood mononuclear cell; s.e.m.: standard error of the mean; hpi: hours post-injection
Fig. 8
Fig. 8
Genetic and pharmacologic inhibition of LSD1 is synthetic lethal with CFZ enhancing DNA damage in multiple myeloma and other B-cell neoplasms. Representative scheme indicating the study workflow and derived results

References

    1. Siegel RL, Miller KD, Wagle NS, Jemal A. Cancer statistics, 2023. CA Cancer J Clin. 2023;73:17–48. 10.3322/caac.21763. - PubMed
    1. Cowan AJ, Green DJ, Kwok M, Lee S, Coffey DG, Holmberg LA, et al. Diagnosis and management of multiple myeloma: a review. JAMA. 2022;327:464–77. 10.1001/JAMA.2022.0003. - PubMed
    1. Fricker LD. Proteasome inhibitor drugs. Annu Rev Pharmacol Toxicol. 2020;60:457–76. 10.1146/annurev-pharmtox-010919-023603. - PubMed
    1. Obeng EA, Carlson LM, Gutman DM, Harrington WJ, Lee KP, Boise LH. Proteasome inhibitors induce a terminal unfolded protein response in multiple myeloma cells. Blood. 2006;107:4907–16. 10.1182/blood-2005-08-3531. - PMC - PubMed
    1. Palumbo A, Anderson K. Multiple myeloma. N Engl J Med. 2011;364:1046–60. 10.1056/NEJMra1011442. - PubMed