. 2023 Aug 10;42(1):205.
doi: 10.1186/s13046-023-02770-6.

CIS deletion by CRISPR/Cas9 enhances human primary natural killer cell functions against allogeneic glioblastoma

Affiliations

CIS deletion by CRISPR/Cas9 enhances human primary natural killer cell functions against allogeneic glioblastoma

Tsutomu Nakazawa et al. J Exp Clin Cancer Res. .

Abstract

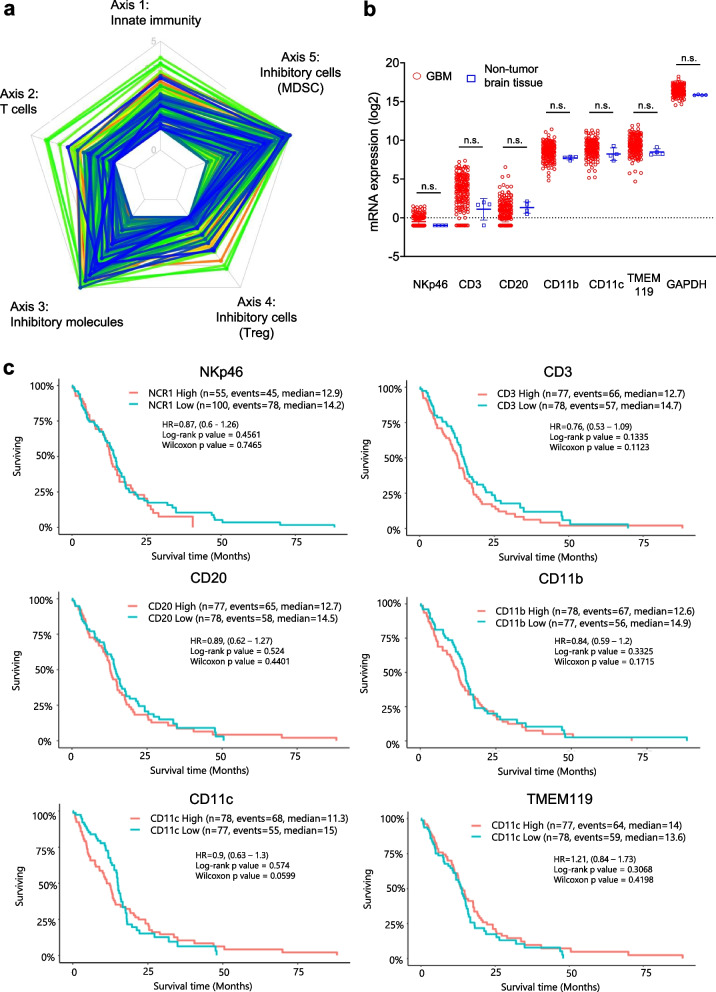
Background: Glioblastoma (GBM) is the most common malignant brain tumor and has "immunologically cold" features. Changing GBM to an "immunologically hot" tumor requires a strong trigger that induces initial immune responses in GBM. Allogeneic natural killer cells (NKCs) have gained considerable attention as promising immunotherapeutic tools against cancer, where gene-edited NKCs would result in effective anti-cancer treatment. The present study focused on the immune checkpoint molecule cytokine-inducible SH2-containing protein (CISH, or CIS) as a critical negative regulator in NKCs.

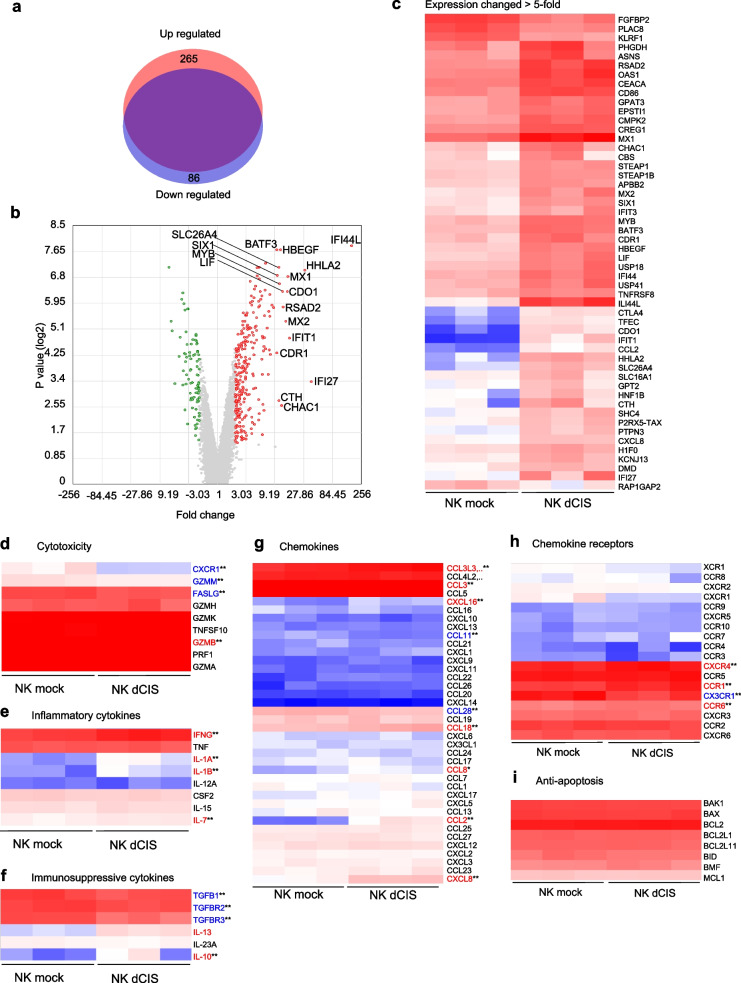
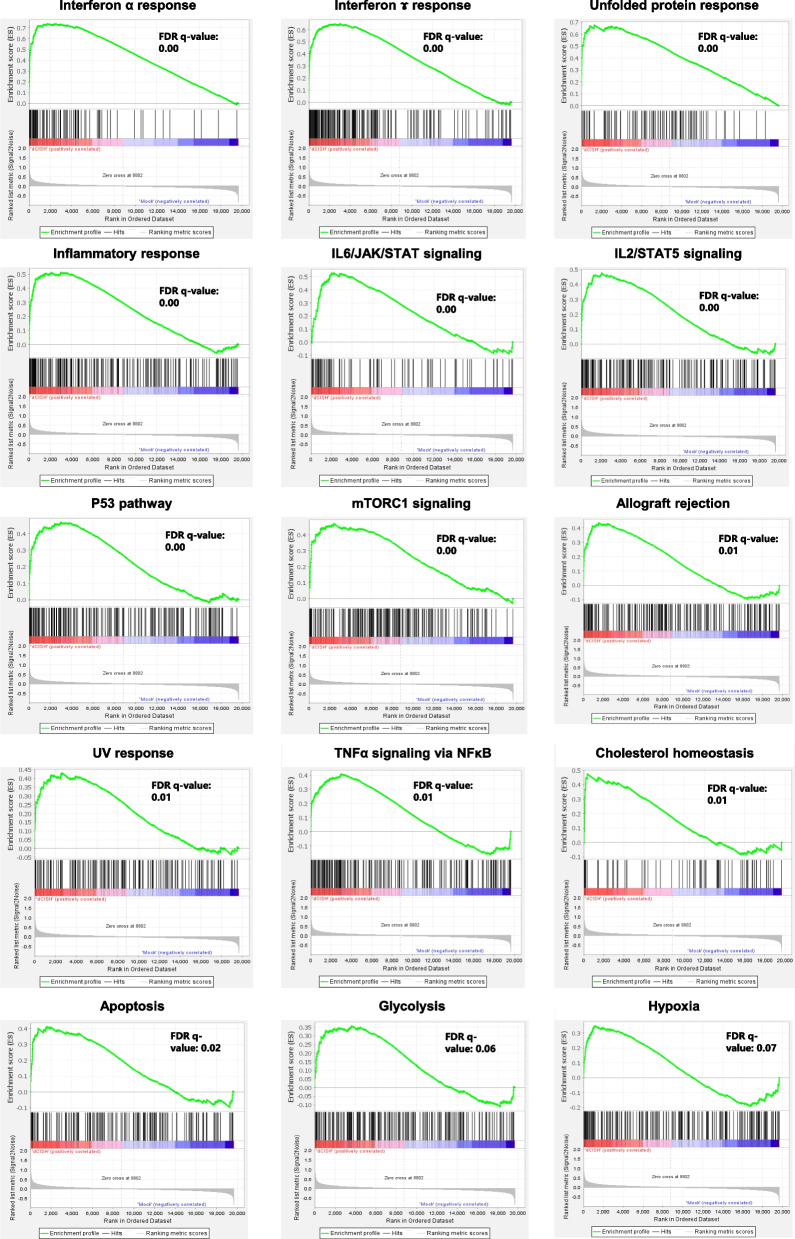
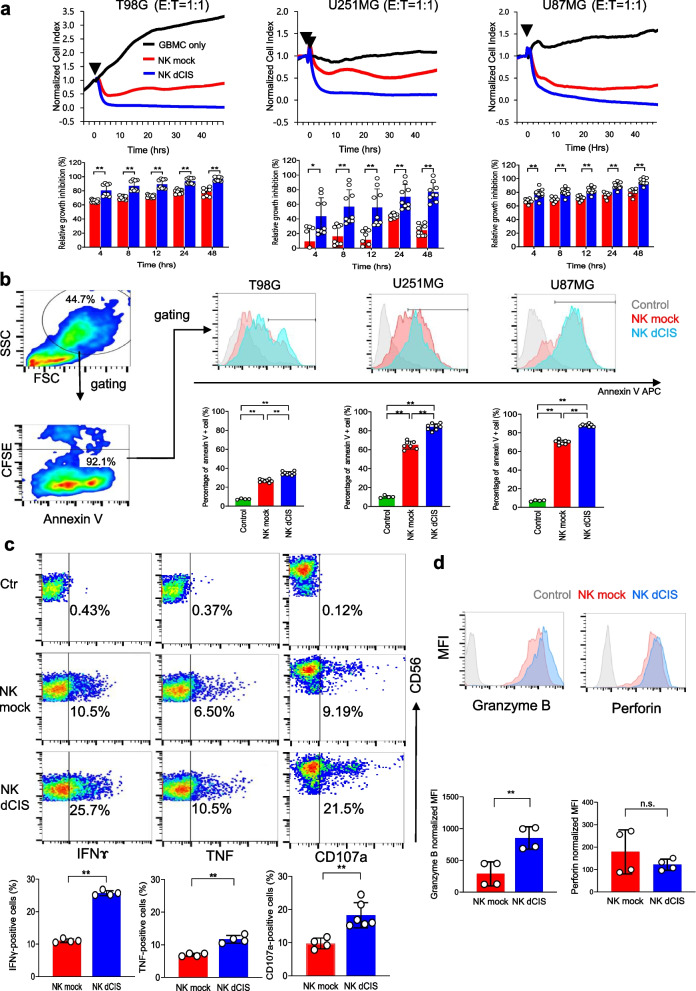
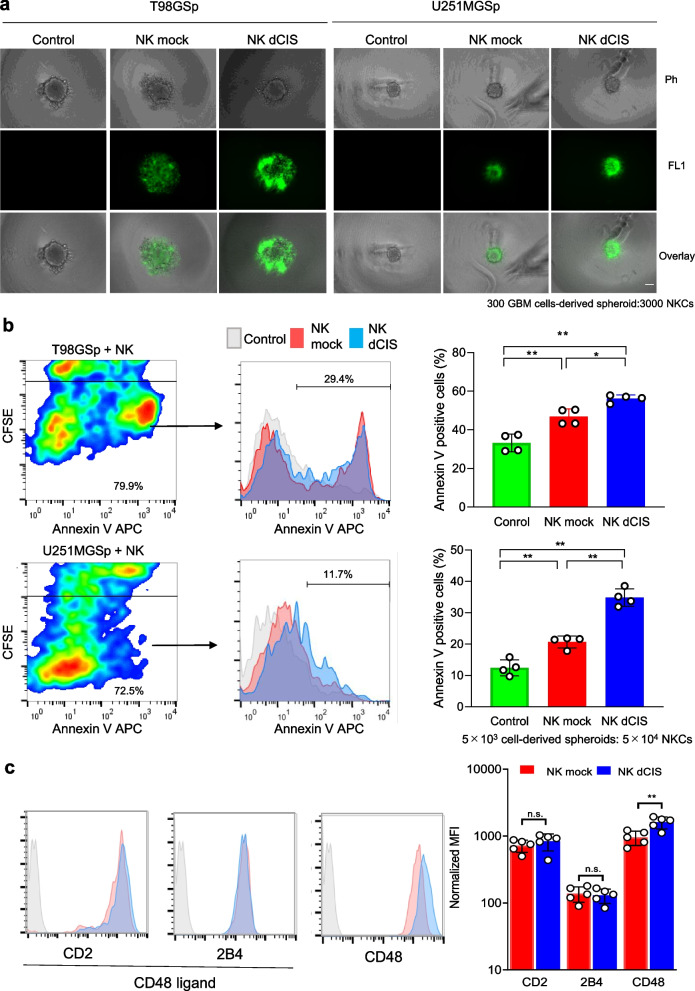
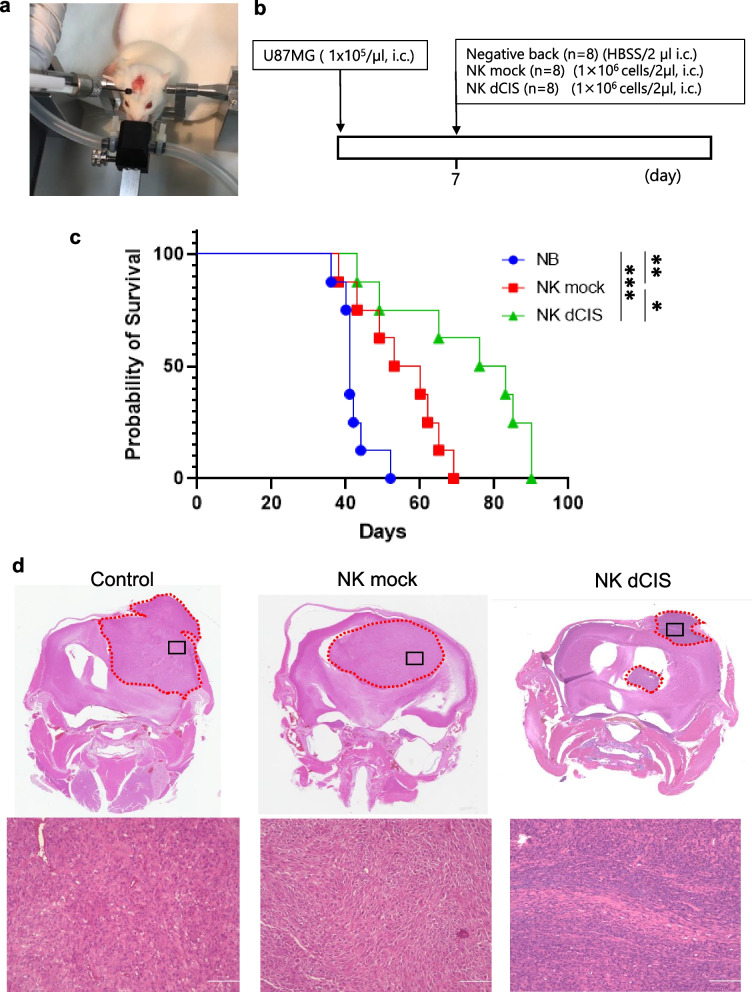
Methods: The GBM tumor environment featured with immunological aspect was analyzed with Cancer immunogram and GlioVis. We generated human primary CIS-deleted NKCs (NK dCIS) using clustered regularly interspaced short palindromic repeats/CRISPR-associated protein 9 (CRISPR/Cas9) with single guide RNA targeting genome sites on CIS coding exons. The genome-edited NKCs underwent microarray with differential expression analysis and gene set enrichment analysis (GSEA). The anti-GBM activity of the genome-edited NKCs was evaluated by apoptosis induction effects against allogeneic GBM cells and spheroids. We further detected in vivo antitumor effects using xenograft brain tumor mice.

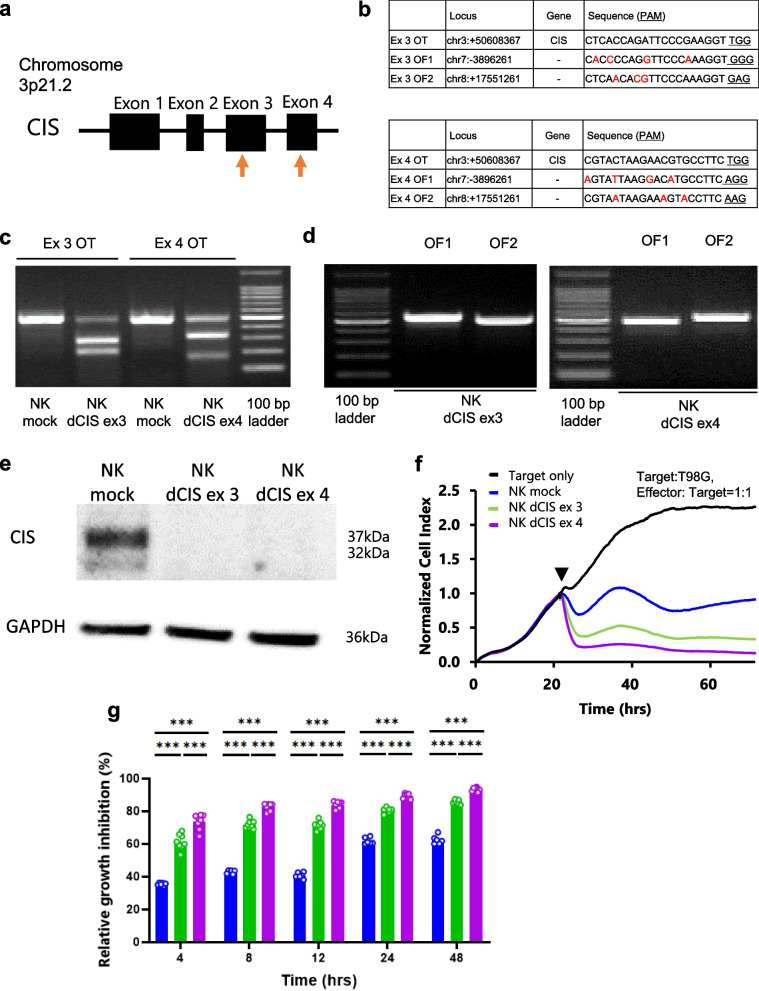
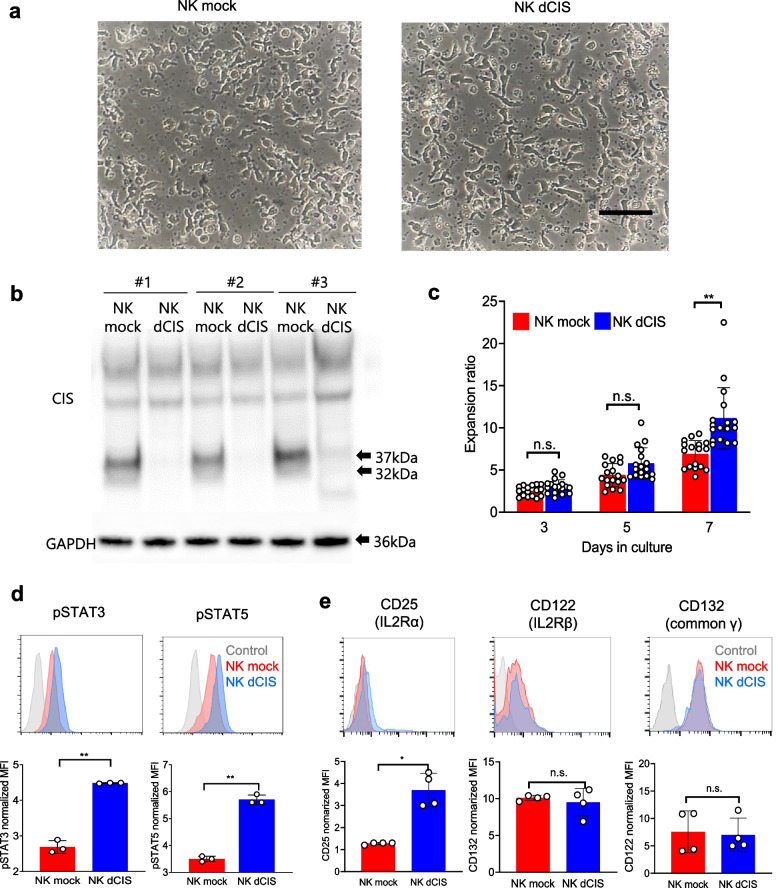
Results: We successfully induced human CIS-deleted NKCs (NK dCIS) by combining our specific human NKC expansion method available for clinical application and genome editing technology. CIS gene-specific guide RNA/Cas9 protein complex suppressed CIS expression in the expanded NKCs with high expansion efficacy. Comprehensive gene expression analysis demonstrated increased expression of 265 genes and decreased expression of 86 genes in the NK dCIS. Gene set enrichment analysis revealed that the enriched genes were involved in NKC effector functions. Functional analysis revealed that the NK dCIS had increased interferon (IFN)ɤ and tumor necrosis factor (TNF) production. CIS deletion enhanced NKC-mediated apoptosis induction against allogeneic GBM cells and spheroids. Intracranial administration of the allogeneic NKCs prolonged the overall survival of xenograft brain tumor mice. Furthermore, the NK dCIS extended the overall survival of the mice.

Conclusion: The findings demonstrated the successful induction of human primary NK dCIS with CRISPR/Cas9 with efficient expansion. CIS deletion enhanced the NKC-mediated anti-tumor effects in allogeneic GBM and could be a promising immunotherapeutic alternative for patients with GBM.

Keywords: CIS; CRISPR/Cas9; Glioblastoma; Natural killer cell; Peripheral blood.


Conflict of interest statement

T.N. and M.N. are employees of Grandsoul Research Institute for Immunology, Inc. and Clinic Grandsoul Nara, respectively. The other authors declare no conflicts of interest. There are no competing financial interests in relation to the work described.

Figures

Fig. 1
Fig. 1
Immune cell-related gene expression in human GBM. a RNA-seq immunogram radar plots for human GBM. Five tumor immunity-related parameters were scored and plotted on the radar plot to depict the molecular immune profiles of the TME in 156 patients with GBM. Radar plot line colors denote each of the 156 samples. The radar plot consists of innate immunity (axis 1), T cell (axis 2), inhibitory molecules (axis 3), inhibitory cells (Treg, axis 4), and inhibitory cells (MDSC, axis 5). b NKp46, CD3, CD20, CD11b, CD11c, TMEM119, and GAPDH expression in GBM (n = 156 samples) and nontumor tissue (n = 4 samples). The data were from TCGA-based GlioVis analysis. Data are the mean ± SD. Statistical differences were determined by the Kruskal–Wallis test. n.s.: not significant. c Kaplan–Meier curves based on NKp46, CD3, CD20, CD11b, CD11c, and TMEM119 high and low expression. The data were from TCGA-based GlioVis analysis
Fig. 2
Fig. 2
Design of sgRNAs targeting the CIS gene. a Schematic representation of the CIS gene. Orange arrows indicate sgRNA targeting sites. b OT (on target: top table) and OF (off target: bottom table) sequences of the CIS exon 3- and exon 4-targeting sgRNAs, respectively. Underlined letters in the target sequences indicate the protospacer adjacent motif (PAM) sequence. Red letters indicate sequences that differ from the target sgRNAs. c OT effects in the genome-edited NKCs. NKC genomic DNA was isolated and PCR was performed using primers flanking the OT region (Ex3 OT and Ex4 OT). The PCR product was reacted with T7E1. NK mock, NK dCIS ex3, and NK dCIS ex 4 indicate sgRNA/Cas9, CIS exon 3-targeting sgRNA/Cas9, and CIS exon 4-targeting sgRNA/Cas9-electroplated NKC DNA, respectively. d OF detection by T7E1 assays. PCR was performed using primers flanking the OF region. OF sites were predicted by an off-targeting potential checking system based on a homology-based algorithm. The top two expected sites were analyzed. Left and right photos depict the CIS exon 3 and exon 4-targeting sgRNAs, respectively, in the genomic DNA of the NK mock and NK dCIS. e CIS protein expression in genome-edited NKCs expanded from human peripheral blood. Top and bottom blots depict CIS protein and GAPDH protein, respectively. NK dCIS ex 3 and NK dCIS ex 4 were electroporated to exon 3 and exon 4, respectively, of the CIS-targeting sgRNA, tracrRNA, and Cas9 complex (RNP) and cultured for 7 days (total, 14-day culture). f Representative graphs of RTCA-based growth inhibition assay. The X- and Y-axes represent the co-culture duration and normalized cell index, respectively. The black arrowhead indicates the start of the culture. Black, blue, green, and purple lines indicate target only, NK mock, NK dCIS ex 3, and NK dCIS ex 4, respectively. The NKC-to-T98G cell co-culture ratio was 1:1 (2 × 104:2 × 10.4 per well). g Graphs depicting relative growth inhibition of genome-edited NKCs. The X- and Y-axes represent co-culture duration and relative growth inhibition effects, respectively. Blue, green, and purple lines indicate NK mock, NK dCIS ex 3, and NK dCIS exon 4, respectively. Data are the mean ± SD. Statistical differences were determined by two-way ANOVA following Tukey’s test. At least two independent experiments were performed. n = 6, ***P < 0.001
Fig. 3
Fig. 3
CRISPR/Cas9 Induction of NK dCIS. a NKC morphology under an inverted microscope. Left and right photographs depict NK mock and NK dCIS edited by CIS exon 4-targeting sgRNA, respectively. Black bar = 100 µm. b CIS expression in genome-edited NKCs. The RNP-electroporated NKCs were collected from three independent experiments and western blotting was performed. Top: The 32- and 37-kDa bands indicate the CIS protein. Bottom: GAPDH. c The NKC expansion ratio at 3, 5, and 7 days after electroporation. Data are the mean ± SD (n = 17). The significance of differences was determined by one-way ANOVA followed by Tukey’s test. n.s.: not significant. **P < 0.01. Data are from at least two independent experiments. d (Top) Representative histograms showing enhanced phosphorylation of STAT5 (pSTAT5) and STAT3 (pSTAT3) in NK mock vs. NK dCIS. Blue, red, and gray represent NK dCIS, NK mock, and negative background (NB) cells, respectively. (Bottom) Graphs depicting the normalized mean fluorescence intensity (MFI). Red and blue bars represent NK mock and NK dCIS, respectively (bottom). Data are the mean ± SD, n = 4. The significance of differences was determined by the unpaired t-test. **P < 0.01. e (Top) Representative histograms depicting IL-2 receptor expression on genome-edited NKCs. Blue, red, and gray represent NK dCIS, NK mock, and NB cells, respectively. (Bottom) Normalized MFI. Blue and red bars indicate NK mock and NK dCIS, respectively. Data are the mean ± SD, n = 4. The significance of differences was determined by the unpaired t-test. n.s.: not significant, *P < 0.05, **P < 0.01. All data were obtained from at least two independent experiments
Fig. 4
Fig. 4
Comprehensive gene expression profiles of NK dCIS. a Upregulated (red) and downregulated (blue) genes in the NK dCIS. The purple region indicates unchanged genes. Fold change > 2 and > -2 and P < 0.05 indicated significant change. b Volcano plot analysis. Red and green dots indicate fold change > 2 and > -2, respectively, at P < 0.05. Genes with > tenfold change in expression are labeled. c Heatmap depicting genes with fold change > 5 or < -5 in NK dCIS as compared to NK mock with scaled intensity. Red and blue tones denote increased and decreased gene expression, respectively, as compared to the NK mock. d–i Heat maps representing genes clustered in cytotoxicity (d), inflammatory cytokine (e), immune suppression (f), chemokines (g), chemokine receptors (h), and anti-apoptosis (i) with scaled intensities under GOBP (Gene Ontology Biological Process). Red and blue tones denote increased and decreased gene expression, respectively, as compared to the NK mock. The significance of differences was determined by the t-test. n = 3, **P < 0.01. All data were from at least two independent experiments
Fig. 5
Fig. 5
GSEA of NK dCIS. Representative GSEA plot depicting enrichment in IFNα response, IFNɤ response, unfolded protein response, inflammatory response, IL-6–JAK–STAT signaling, IL-2–STAT5 signaling, p53 pathway, mTORC1 signaling, allograft rejection, UV response, TNFα signaling via NFκB, cholesterol homeostasis, apoptosis, glycolysis, and hypoxia. (Top) X-axis indicates NK dCIS-correlated genes (left) and NK mock-correlated genes (right), represented by bar code data. Y-axis indicates the enrichment score. Bottom: X- and Y-axes indicate the rank in ordered dataset and ranked list metrics, respectively. A false discovery rate q value < 0.05 indicated a significant difference
Fig. 6
Fig. 6
CIS deletion enhances effector function of the expanded NKCs on allogeneic GBM cells. a (Top): Representative graphs of the RTCA-based growth inhibition assay. X- and Y-axes denote the co-culture duration and normalized cell index, respectively. The normalized cell index indicates which NKC addition time was selected and set by the software as 1.0, based on which all values are depicted as a percentage. Black arrowhead indicates the start of the culture. The target cells were T98G, U251MG, and U87MG cells. Black, red, and blue curves indicate target only, mock NKCs, NK dCIS, respectively. The effector (NKCs)-to-target cell (T98G, U251MG, U87MG) co-culture ratio was 1:1 (2 × 104:2 × 104 per well). (Bottom) Graphs depicting relative growth inhibition of NK dCIS. X- and Y-axes denote co-culture duration and relative growth inhibition effects, respectively. Red and blue bars indicate NK mock and NK dCIS, respectively. Data are the mean ± SD. Statistical differences were determined by two-way ANOVA followed by Tukey’s test. n = 5–10, **P < 0.01. b Flow cytometry-based apoptosis assay. The target cells were T98G, U251MG, and U87MG cells. The NKC-to-target cell co-culture ratio was 1:1. The co-culture spanned 24 h. (Left) Red and blue color maps indicate high and low density, respectively. (Top right) Histograms depict annexin V-positive cells gated by CD45-negative fractions. Gray, red, and blue histograms represent the control, NK mock, and NK dCIS, respectively. (Bottom right) Graphs illustrate the percentage of annexin V-positive cells. Statistical differences were determined by one-way ANOVA followed by Tukey’s test. n = 4–7, **P < 0.01. c Cytokine production assays and evaluation of CD107a expression in NKCs. The NKCs were co-cultured with T98G cells for 5 h. Representative red and blue color maps gated by the CD56-positive fraction denote high and low density, respectively. Y-axes denote CD56 positivity. X-axes denote IFNɤ (left), TNF (center), and CD107a (right) expression. (Top) Graphs denote IFNɤ (left), TNF (center), and CD107a (right) positivity. Red and blue bars indicate NK mock and NK dCIS, respectively. Data are the mean ± SD. Statistical differences were determined by the t-test or Mann–Whitney U test. n = 4–6, **P < 0.01. d Expression of cytotoxic granules in NKCs. (Top) Representative histograms gated by the CD56-positive fraction. Gray, red, and blue bars indicate control, NK mock, and NK dCIS, respectively. (Bottom) Graphs depict granzyme B and perforin expression in NKCs. Statistical differences were determined by the t-test or Mann–Whitney U test. n = 4, n.s.: not significant, **P < 0.01. At least two independent experiments were performed
Fig. 7
Fig. 7
CIS deletion enhances apoptosis in GBM spheroids. a Fluorescent microscopic evaluation of T98G- and U251MG-derived spheroids co-cultured with NKCs. Scale bars = 100 μm. GBM cells (300 cells/well) were seeded onto nonadherent V-bottom 96-well plates for 1 day, co-cultured with 3 × 103 CFSE-labeled NKCs, and observed under a BZ-X700 fluorescence microscope. The cells within all spheroids were visualized by recording merged Z-stack images using the BZ-X700 quick full-focus function. Phase contrast (top, Ph), FL1-based fluorescent (middle, FL1), and overlay (bottom, overlay) images are shown. b Flow cytometric analysis of the apoptosis of T98G- and U251MG-derived spheroids co-cultured with NKCs. The spheroids (5 × 103) were co-cultured for 24 h with 5 × 104 CFSE-labeled NKCs. Subsequently, the cells were centrifuged and detached with Accutase, then stained with APC-conjugated annexin V. Apoptotic GBM cells were detected with a flow cytometer. To ensure that the analysis was accurate, the CFSE-positive fraction was gated out to assess GBM cell apoptosis. (Left) Flow cytometry-based apoptosis assay of T98G (top) and U251MG cells (bottom). Red and blue color maps indicate high and low density, respectively. (Middle) Histograms negatively fractionated by FL-1-positive cells (CFSE) depict annexin V-positive cells. X-axis denotes APC-conjugated annexin V. (Right) Graphs indicate the percentage of annexin V-positive GBM cells. Data are the mean ± SD of four experiments. Statistical differences were determined by two-way ANOVA followed by Tukey’s test. *P < 0.05, **P < 0.01. c Adhesion molecule expression in NKCs. (Left) Histograms depict CD2, 2B4, and CD48. CD2 and 2B4 are CD48 ligands. Gray, red, and blue histograms represent the control, NK mock, and NK dCIS, respectively. (Right) Graph depicts normalized MFI. Red and blue bars indicate NK mock and NK dCIS, respectively. Data are the mean ± SD of five experiments. Statistical differences were determined by the t-test. n.s.: not significant, *P < 0.05, **P < 0.01. At least two independent experiments were performed
Fig. 8
Fig. 8
NK dCIS prolong overall survival in an allogeneic xenograft brain tumor model. a Photo depicts injection of U87MG cells into NOG mouse brain. b Schematic of the experimental design. c Graph depicting the Kaplan–Meier curve. Blue, red, and green lines represent the NB (n = 8; HBSS/2 µL), NK mock (n = 8; 1 × 106 NK mock/2 µL), and NK dCIS (n = 8; 1 × 106 NK dCIS/2 µL), respectively. Survival in each group was estimated using the Kaplan–Meier curve method. The statistical significance of differences was determined using the log rank test. ***P < 0.001, **P < 0.01, ***P < 0.05. d Photo of HE staining. Top and bottom images depict × 40 and × 400 magnification, respectively. Representative histocytological features at the time of autopsy of NB (left), NK mock (center), and NK dCIS (right) tumors are shown. Black squares in × 40 photos indicate the area observed under × 400 magnification

References

    1. Louis DN, Perry A, Wesseling P, Brat DJ, Cree IA, Figarella-Branger D, et al. The 2021 WHO Classification of Tumors of the Central Nervous System: a summary. Neuro Oncol. 2021;23(8):1231–1251. - PMC - PubMed
    1. Stupp R, Mason WP, van den Bent MJ, Weller M, Fisher B, Taphoorn MJ, et al. Radiotherapy plus concomitant and adjuvant temozolomide for glioblastoma. N Engl J Med. 2005;352(10):987–996. - PubMed
    1. Ostrom QT, Cote DJ, Ascha M, Kruchko C, Barnholtz-Sloan JS. Adult Glioma Incidence and Survival by Race or Ethnicity in the United States From 2000 to 2014. JAMA Oncol. 2018;4(9):1254–1262. - PMC - PubMed
    1. Stupp R, Taillibert S, Kanner A, Read W, Steinberg D, Lhermitte B, et al. Effect of Tumor-Treating Fields Plus Maintenance Temozolomide vs Maintenance Temozolomide Alone on Survival in Patients With Glioblastoma: A Randomized Clinical Trial. JAMA. 2017;318(23):2306–2316. - PMC - PubMed
    1. Todo T, Ito H, Ino Y, Ohtsu H, Ota Y, Shibahara J, et al. Intratumoral oncolytic herpes virus G47∆ for residual or recurrent glioblastoma: a phase 2 trial. Nat Med. 2022;28(8):1630–1639. - PMC - PubMed

Substances