. 2023 Aug;12(8):e12341.
doi: 10.1002/jev2.12341.

Tumour extracellular vesicles induce neutrophil extracellular traps to promote lymph node metastasis

Affiliations

Tumour extracellular vesicles induce neutrophil extracellular traps to promote lymph node metastasis

Xin Su et al. J Extracell Vesicles. 2023 Aug.

Abstract

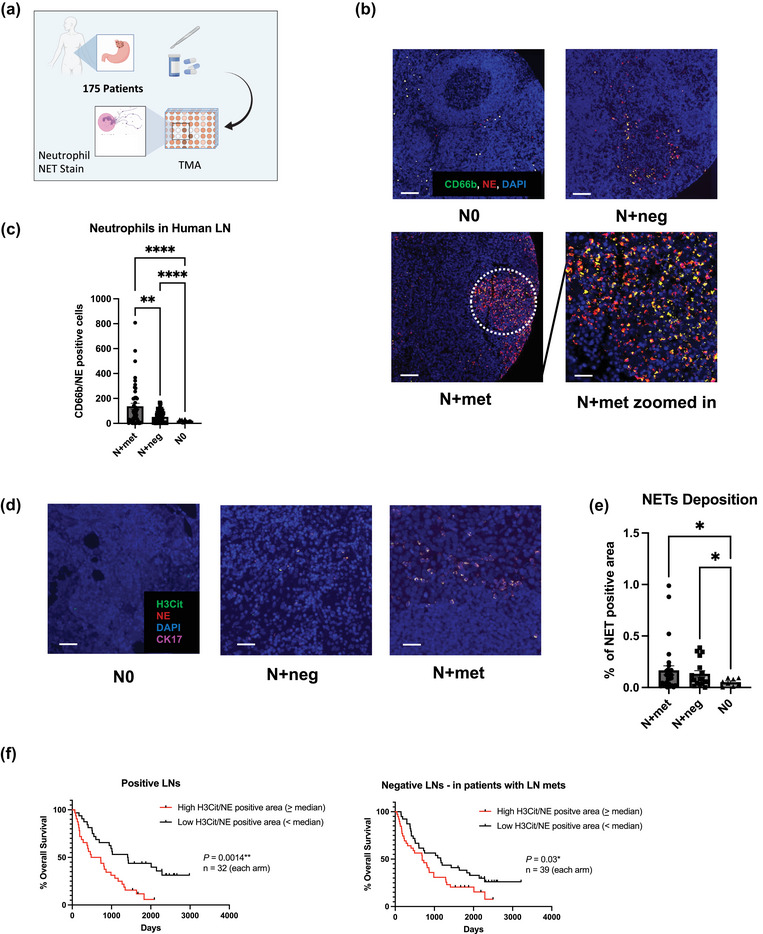
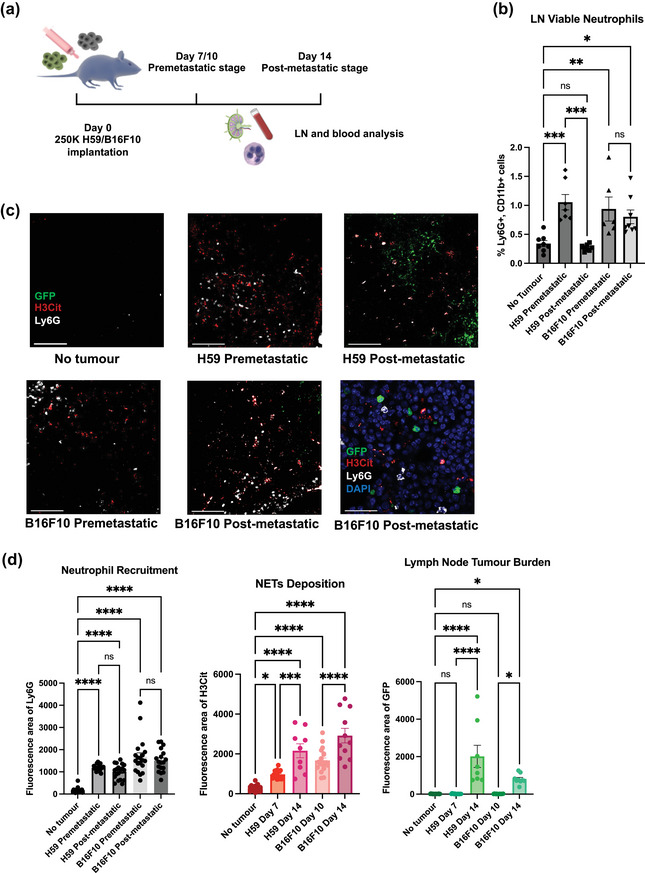
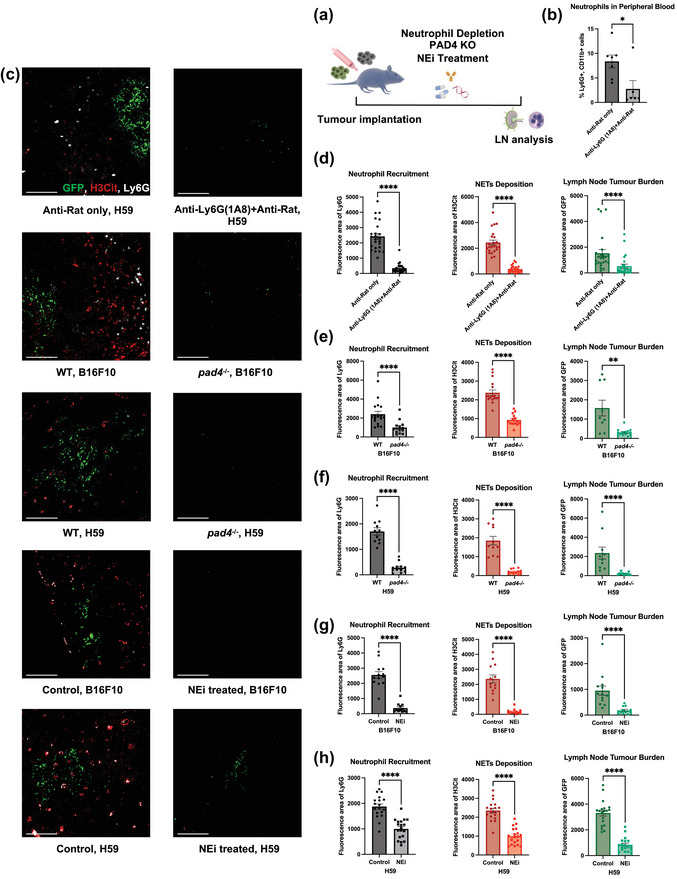
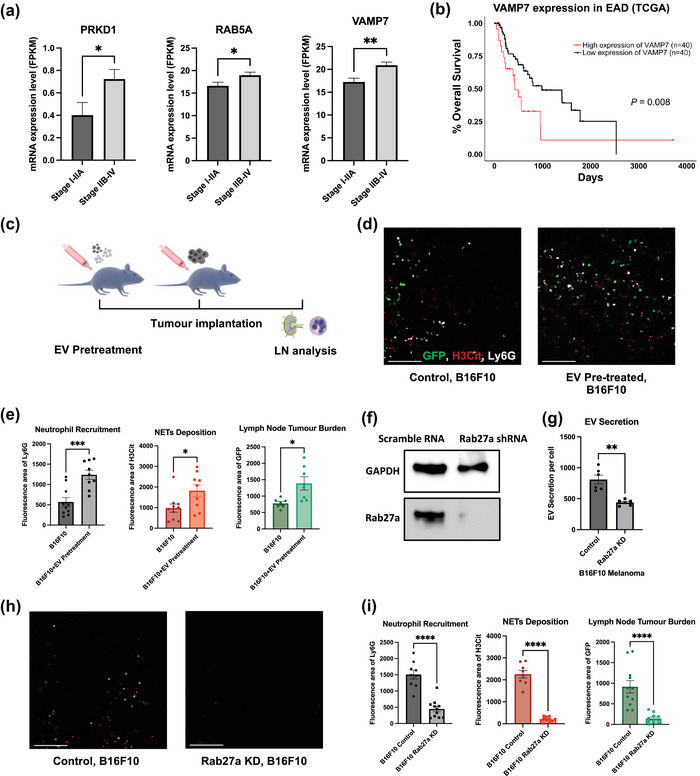
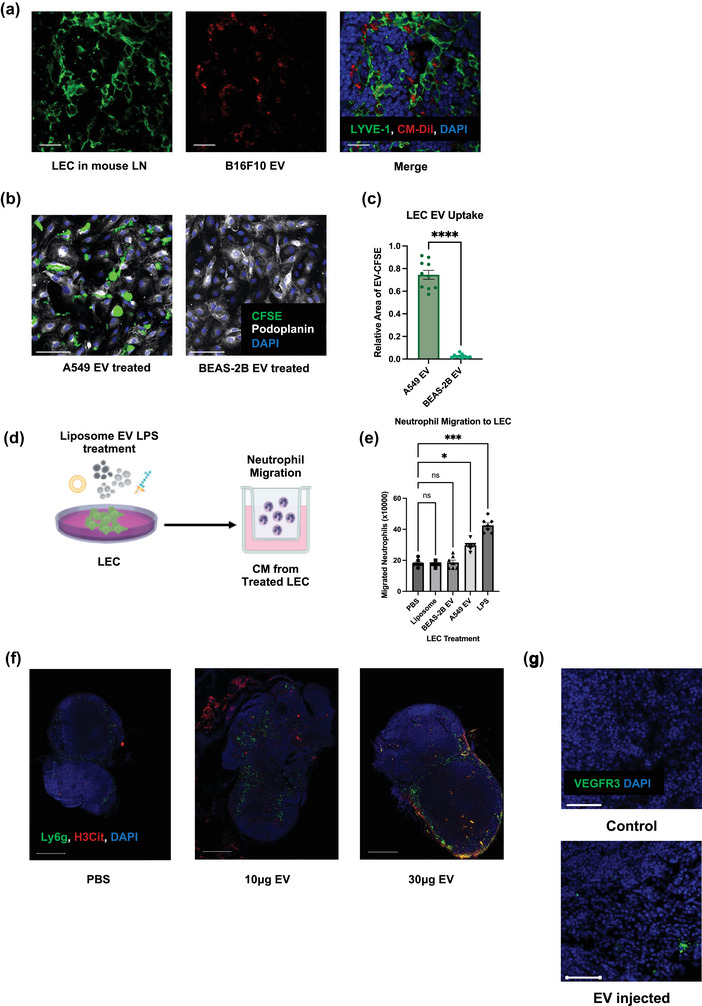
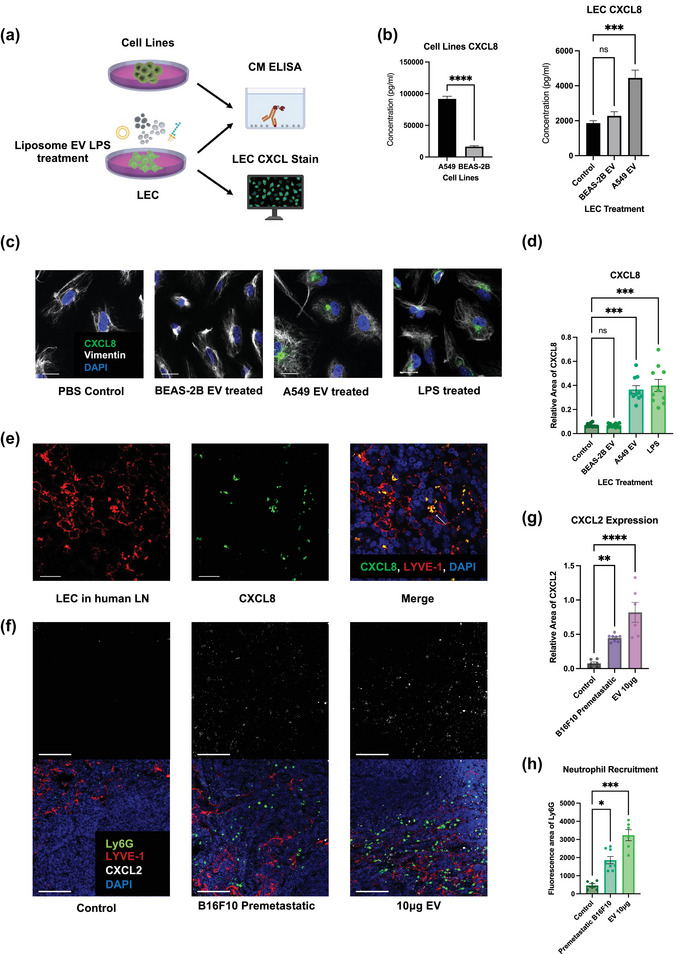
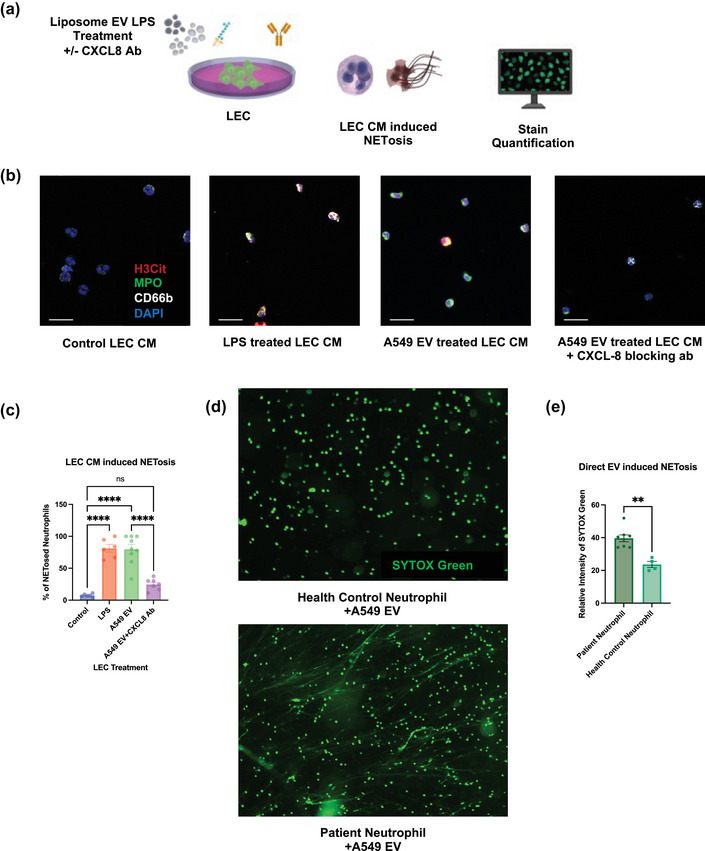
Lymph nodes (LNs) are frequently the first sites of metastasis. Currently, the only prognostic LN assessment is determining metastatic status. However, there is evidence suggesting that LN metastasis is facilitated by the formation of a pre-metastatic niche induced by tumour derived extracellular vehicles (EVs). Therefore, it is important to detect and modify the LN environmental changes. Earlier work has demonstrated that neutrophil extracellular traps (NETs) can sequester and promote distant metastasis. Here, we first confirmed that LN NETs are associated with reduced patient survival. Next, we demonstrated that NETs deposition precedes LN metastasis and NETs inhibition diminishes LN metastases in animal models. Furthermore, we discovered that EVs are essential to the formation of LN NETs. Finally, we showed that lymphatic endothelial cells secrete CXCL8/2 in response to EVs inducing NETs formation and the promotion of LN metastasis. Our findings reveal the role of EV-induced NETs in LN metastasis and provide potential immunotherapeutic vulnerabilities that may occur early in the metastatic cascade.

Keywords: NETs; cancer; lymph node; metastasis; neutrophils.


Conflict of interest statement

All authors declare no conflict of interest.

Figures

FIGURE 1
FIGURE 1
Neutrophils and NETs in regional lymph nodes (LNs) of gastroesophageal adenocarcinoma (GEA) patients. (a) Schematic illustration of the TMA constructions. Sample size: LNs from node negative patients (N0) = 13, tumour negative LNs from node positive patients (N+neg) = 91 and tumour positive LNs (N+met) = 71. Each patient sample corresponds to one tissue core on TMA slides. (b) Representative images of neutrophils in different patient LNs. Scale bars represent 100 μm. White circle indicates the zoomed area shown in bottom right. Scale bars represent 50μm. (c) Quantification of LN neutrophils (CD66b/NE double positive cells) per TMA core for N+met, N+neg and N0 LNs. (d) Representative images of NETs deposition pattern in N+met, N+neg and N0 LNs. Scale bars represent 50μm. (e) Quantification of %NETs positive area per core in N+met, N+neg and N0 LNs. Data shown as mean ± SEM. *, P < 0.05; **, P < 0.01; **** P < 0.001 by Brown‐Forsythe ANOVA test. (f) Kaplan‐Meier survival curves comparing survival of nodal positive GEA patients with low versus high levels of median lymphatic NETs positive area, in both tumour positive and negative LNs. P value by Log‐rank (Mantel‐Cox) test.
FIGURE 2
FIGURE 2
The dynamic of LN neutrophil recruitment and NET deposition in mouse model. (a) Schematic illustration of the animal model construction. 250k H59 or B16F10 cells were injected into the flank of C57bl/6 mice (b) Percentage of LN viable neutrophils within all viable LN cells on a time course by flow cytometry. (c) Representative images of LNs on a time course for both H59 lung cancer and B16F10 melanoma. Scale bars represent 100μm. Zoomed NETs details are shown in bottom right. Scale bars represent 20 μm. (d) Quantification of the area of LN neutrophils (Ly6G), NETs (H3Cit) and tumour (GFP). Each data point is an image analysed, mouse n =10. Data shown as mean ± SEM. *, P < 0.05; **, P < 0.01; ***, P < 0.005; **** P < 0.001 by one‐way ANOVA.
FIGURE 3
FIGURE 3
Neutrophil depletion and NETs inhibition abolishes LN metastasis. (a) Schematic illustration of the treatments in animal models. (b) Flow cytometry on blood leukocyte indicates sufficient depletion of neutrophils. (c) Representative images of tumour draining LNs on day 14 post tumour inoculation for both H59 and B16F10, comparing wildtype/no treatment mice to neutrophil‐depleted, pad4 knockout or NEi treated mice. Scale bars represent 100 μm. (d)–(h) Quantification of the area of neutrophils (Ly6G), NETs (H3Cit) and metastasis (GFP) in fay 14 LNs for both H59 and B16F10, comparing wildtype/no treatment mice to neutrophil‐depleted, pad4 knockout or NEi treated mice. Each data point is an image analysed, mouse n =10. Data shown as mean ± SEM. *, P < 0.05; **, P < 0.01; ***, P < 0.005; **** P < 0.001 by Mann‐Whitney t test.
FIGURE 4
FIGURE 4
EVs are essential for LNs NETs formation and metastasis. (a) Statistical analysis of TCGA mRNA data of EV synthesis related genes in primary esophageal adenocarcinoma (EAD) tumour tissue. n = 15 (Stage I‐IIA), n = 65 (Stage IIb‐IV). (b) Kaplan‐Meier survival curves comparing the survival of EAD patients with low versus high levels of VAMP7 mRNA in tumour. (c) Schematic illustration of EV pre‐treatment in animal models. (d) Representative images of tumour draining LNs on day 14 post tumour inoculation for B16F10, with or without pre‐treatment of EVs Scale bars represent 100μm. (e) Quantification of the area of neutrophils (Ly6G), NETs (H3Cit) and tumour (GFP) in day 14 LN for B16F10, with or without EV pre‐treatment. (f) Representative Western Blot images indicating the knockdown of Rab27a expression in B16F10 cells. (g) Nanoparticle Tracking Analysis (NTA) indicates Rab27a knockdown in B16F10 cells leads to decreased EV secretion. (h) Representative images of tumour draining LNs on day 14 post tumour inoculation for B16F10, comparing mice injected with B16F10 infected with lentivirus containing scramble RNA or Rab27a shRNA. Scale bars represent 100μm. (i) Quantification of the area of neutrophils (Ly6G), NETs (H3Cit) and metastasis (GFP) in day 14 LNs for B16F10, comparing mice injected with B16F10 infected with lentivirus contain scramble RNA or Rab27a shRNA. Each data point is an image analysed, mouse n =10. Data shown as mean ± SEM. *, P < 0.05; **, P < 0.01; ***, P < 0.005; **** P < 0.001 by Mann–Whitney t test.
FIGURE 5
FIGURE 5
Lymphatic endothelial cells (LECs) are the LN recipient cells of EVs LECs regulate neutrophil recruitment and NETs formation. (a) Representative images of draining LNs after footpad B16F10 EV injection, showing LECs uptaking EVs Scale bars represent 20μm. (b) Representative images of LECs after A549 and BEAS‐2B EV treatment. Scale bars represent 100μm. (c) Quantification of the EV uptake (relative fluorescence area of CFSE to DAPI) in LECs. (d) Schematic illustration of the Boyden chamber transwell assay. (e) Quantification of Boyden chamber transwell assay, showing neutrophil migration towards CM from treated LECs. Data shown as mean ± SEM. *, P < 0.05; ***, P < 0.005; **** P < 0.001 by Mann–Whitney t test or One‐Way ANOVA. (f) Representative images of draining LNs after footpad PBS or different doses of B16F10 EV injection, indicating the subsequent neutrophil recruitment and NETs deposition. Scale bars represent 500 μm. (g) Representative images of draining LNs after footpad PBS or 10 μg B16F10 EV injection, indicating the increased expression of premetastatic marker VEGFR3. Scale bars represent 50 μm.
FIGURE 6
FIGURE 6
LECs secrete neutrophil chemoattractants and NETs inducers upon EV uptake. (a) Schematic illustration of the ELISA and LEC CXCL8 stain. (b) ELISA of CXCL8 level in conditioned media (CM) of A549, BEAS‐2B and EV‐treated LECs. (c) Representative images of LECs expressing CXCL8 after different kinds of treatments. Scale bars represent 20μm. (d) Quantification of CXCL8 expression in LECs (relative fluorescence area of CXCL8 to DAPI). (e) Representative images of LECs expressing CXCL8 in tumour positive nodes of lung cancer patients. Scale bars represent 20μm. (f) Representative images of LECs expressing CXCL2 and recruiting neutrophils mouse LNs. Scale bars represent 100μm. (g) and (h) Quantification of CXCL2 expression (relative fluorescence area of CXCL2 to LYVE‐1) in LECs and neutrophil recruitment (Ly6G fluorescence area) in mouse LNs. Each data point is an image analysed, mouse n =10. Data shown as mean ± SEM. *, P < 0.05; **, P < 0.01; ***, P < 0.005; **** P < 0.001 by Mann–Whitney t test, One‐Way ANOVA or Kruskal–Wallis test.
FIGURE 7
FIGURE 7
Lymphatic CXCL8 secretion upon EV uptake leads to NETs formation. (a)Schematic illustration of the in vitro NETosis assay induced by CM of treated LECs. (b) Representative images of neutrophils treated with CM from treated LECs. Scale bars represent 20 μm. (c) Quantification of LEC CM induced NETosis (% of H3Cit positive neutrophils). (d) Representative images of indicating the different proneness to form NETs for neutrophils from health control and GEA patients after A549 EV treatment. Scale bars represent 100μm. (d) Quantification of propensity of neutrophil to form NETs induced by EVs (Relative fluorescence intensity of SYTOX Green treated to untreated neutrophil) from health control and GEA patients). Data shown as mean ± SEM.**, P < 0.01; ****, P < 0.001 by Kruskal–Wallis test or Mann–Whitney t test.

References

    1. Abdel‐Latif, M. M. , Duggan, S. , Reynolds, J. V. , & Kelleher, D. (2009). Inflammation and esophageal carcinogenesis. Current Opinion in Pharmacology, 9(4), 396–404. 10.1016/j.coph.2009.06.010 - DOI - PubMed
    1. Albrengues, J. , Shields, M. A. , Ng, D. , Park, C. G. , Ambrico, A. , Poindexter, M. E. , Upadhyay, P. , Uyeminami, D. L. , Pommier, A. , Küttner, V. , Bružas, E. , Maiorino, L. , Bautista, C. , Carmona, E. M. , Gimotty, P. A. , Fearon, D. T. , Chang, K. , Lyons, S. K. , Pinkerton, K. E. , … Egeblad, M. (2018). Neutrophil extracellular traps produced during inflammation awaken dormant cancer cells in mice. Science, 361(6409), eaao4227. 10.1126/science.aao4227 - DOI - PMC - PubMed
    1. Al Lawati, Y. , Alkaaki, A. , Luis Ramírez García Luna, J. , Skothos, E. , Mueller, C. , Spicer, J. , Mulder, D. , Ferri, L. , & Cools‐Lartigue, J. (2021). The predictive value of inflammatory biomarkers in esophageal anastomotic leaks. The Annals of Thoracic Surgery, 112(6), 1790–1796. 10.1016/j.athoracsur.2020.12.033 - DOI - PubMed
    1. Amulic, B. , Cazalet, C. , Hayes, G. L. , Metzler, K. D. , & Zychlinsky, A. (2012). Neutrophil function: From mechanisms to disease. Annual Review of Immunology, 30(1), 459–489. 10.1146/annurev-immunol-020711-074942 - DOI - PubMed
    1. An, Z. , Li, J. , Yu, J. , Wang, X. , Gao, H. , Zhang, W. , Wei, Z. , Zhang, J. , Zhang, Y. , Zhao, J. , & Liang, X. (2019). Neutrophil extracellular traps induced by IL‐8 aggravate atherosclerosis via activation NF‐κB signaling in macrophages. Cell Cycle, 18(21), 2928–2938. 10.1080/15384101.2019.1662678 - DOI - PMC - PubMed

Publication types

LinkOut - more resources