. 2023 Jul 20:10:1197814.
doi: 10.3389/fmolb.2023.1197814. eCollection 2023.

Regulation of cellular contractile force, shape and migration of fibroblasts by oncogenes and Histone deacetylase 6

Affiliations

Regulation of cellular contractile force, shape and migration of fibroblasts by oncogenes and Histone deacetylase 6

Ana López-Guajardo et al. Front Mol Biosci. .

Abstract

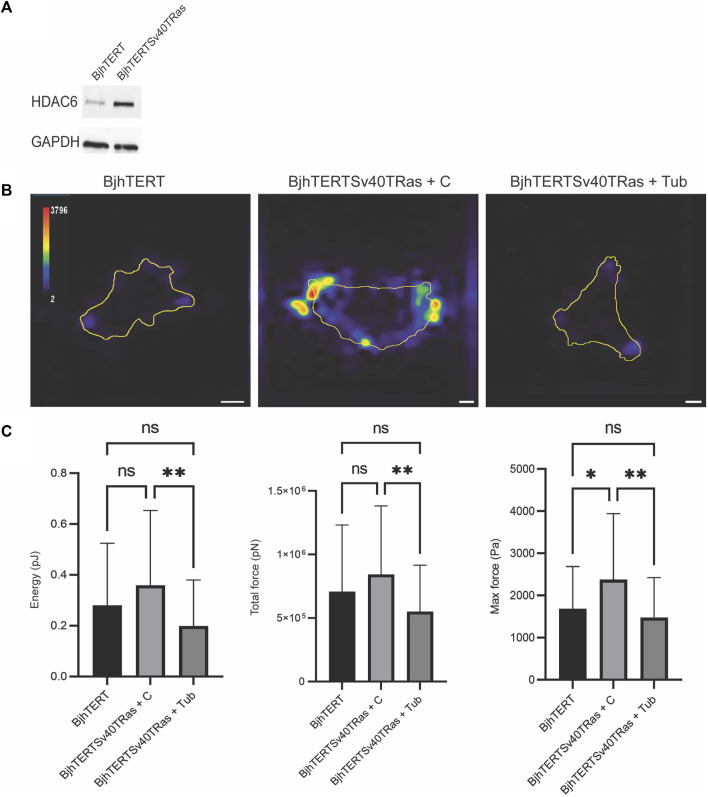
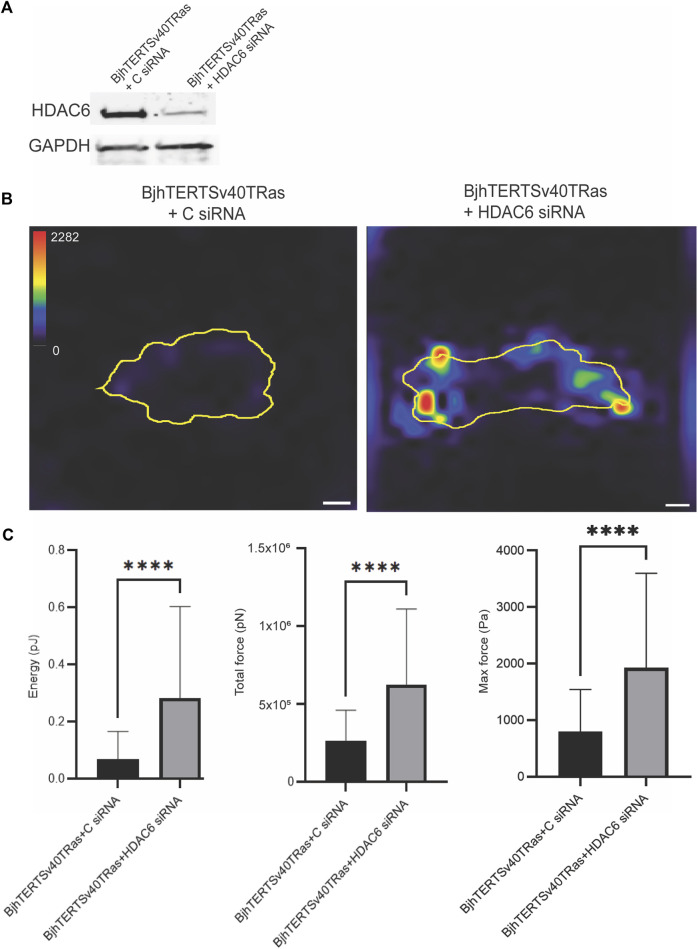
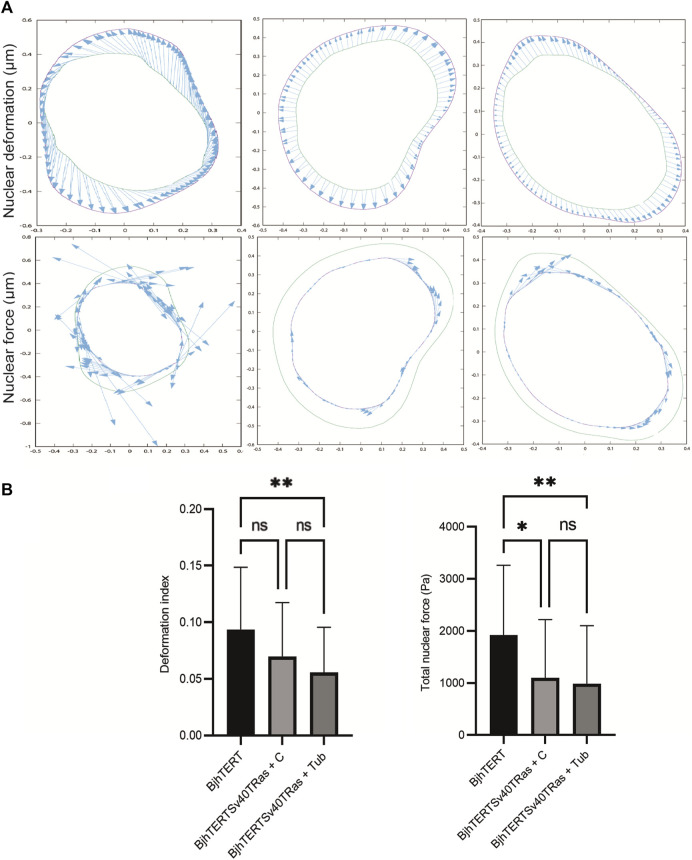
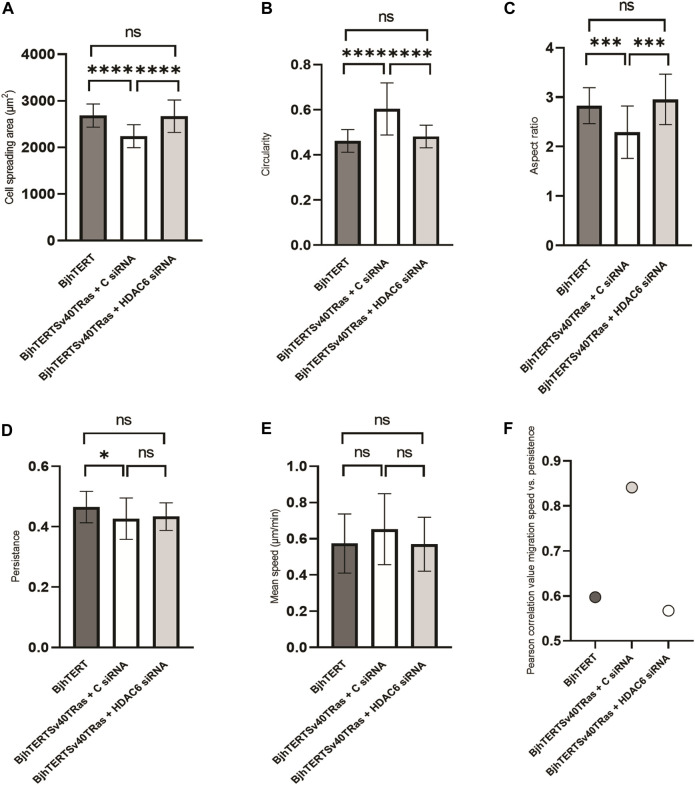
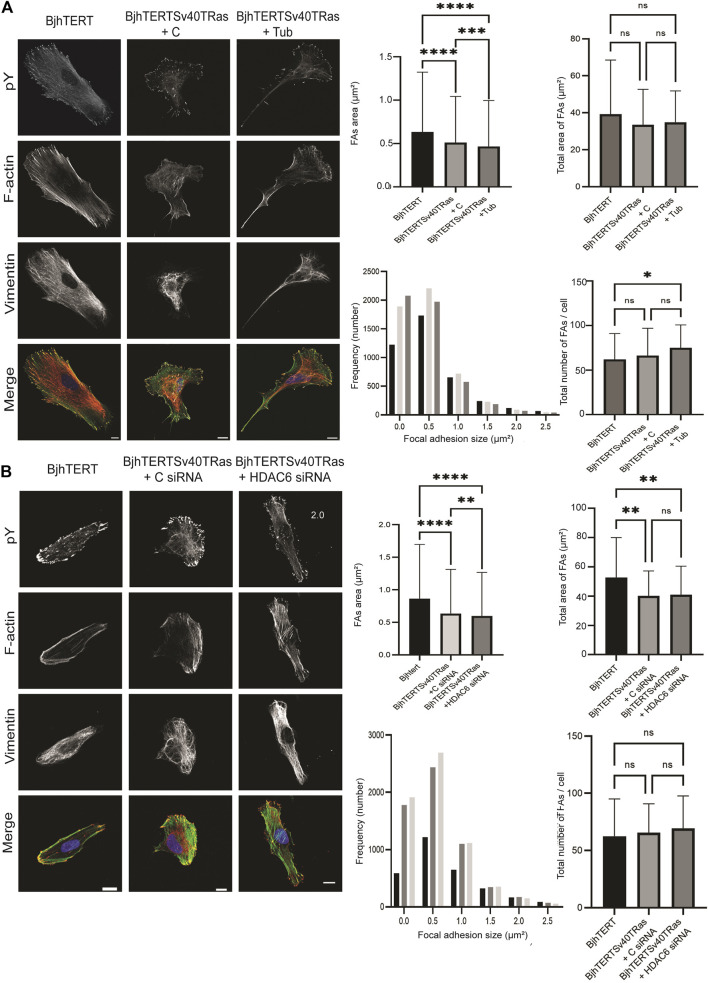
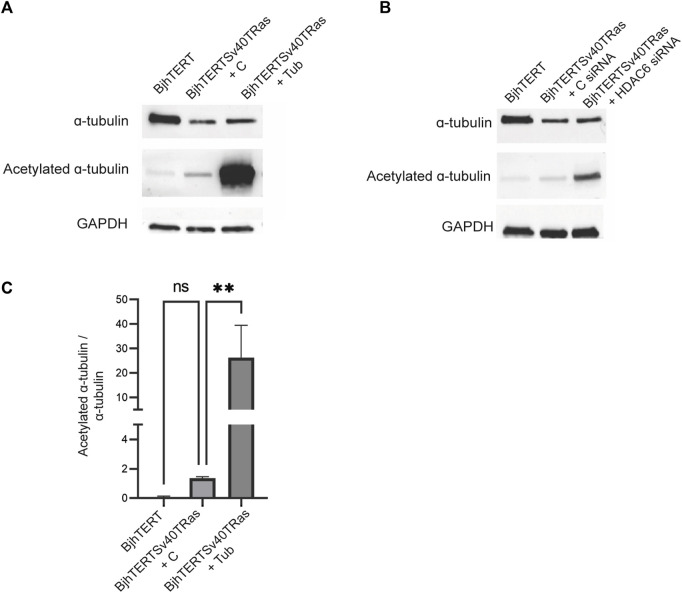
The capacity of cells to adhere to, exert forces upon and migrate through their surrounding environment governs tissue regeneration and cancer metastasis. The role of the physical contractile forces that cells exert in this process, and the underlying molecular mechanisms are not fully understood. We, therefore, aimed to clarify if the extracellular forces that cells exert on their environment and/or the intracellular forces that deform the cell nucleus, and the link between these forces, are defective in transformed and invasive fibroblasts, and to indicate the underlying molecular mechanism of control. Confocal, Epifluorescence and Traction force microscopy, followed by computational analysis, showed an increased maximum contractile force that cells apply on their environment and a decreased intracellular force on the cell nucleus in the invasive fibroblasts, as compared to normal control cells. Loss of HDAC6 activity by tubacin-treatment and siRNA-mediated HDAC6 knockdown also reversed the reduced size and more circular shape and defective migration of the transformed and invasive cells to normal. However, only tubacin-mediated, and not siRNA knockdown reversed the increased force of the invasive cells on their surrounding environment to normal, with no effects on nuclear forces. We observed that the forces on the environment and the nucleus were weakly positively correlated, with the exception of HDAC6 siRNA-treated cells, in which the correlation was weakly negative. The transformed and invasive fibroblasts showed an increased number and smaller cell-matrix adhesions than control, and neither tubacin-treatment, nor HDAC6 knockdown reversed this phenotype to normal, but instead increased it further. This highlights the possibility that the control of contractile force requires separate functions of HDAC6, than the control of cell adhesions, spreading and shape. These data are consistent with the possibility that defective force-transduction from the extracellular environment to the nucleus contributes to metastasis, via a mechanism that depends upon HDAC6. To our knowledge, our findings present the first correlation between the cellular forces that deforms the surrounding environment and the nucleus in fibroblasts, and it expands our understanding of how cells generate contractile forces that contribute to cell invasion and metastasis.

Keywords: Histone deacetylase 6; Traction force microscopy; cell adhesion; cellular contractile forces; fibroblasts; intracellular forces on nucleus; metastasis; oncogenes.


Conflict of interest statement

The authors declare that the research was conducted in the absence of any commercial or financial relationships that could be construed as a potential conflict of interest.

Figures

FIGURE 1
FIGURE 1
Transformed and invasive fibroblasts show increased maximum force, which is reversed to normal by tubacin-mediated inhibition of HDAC6. (A) The protein l evels of HDAC6 and GAPDH loading control in normal BjhTERT and metastasising BjhTERTSv40TRas cells, as indicated. (B) Representative traction force maps of control and Transformed and invasive fibroblasts, treated without or with tubacin (Tub), as indicated, with colour key indicating the magnitude of traction force, in Pascals. (C) The corresponding quantification graphs of the total strain energy (left), the total traction forces exerted by the cells (i.e., the traction forces integrated over cell area) (middle), and the maximum force of cells (right) are shown, as indicated. Data from at least three independent biological repeats, represented as mean ± SD. *p ≤ 0.05, **p ≤ 0.01 (One way ANOVA tests) (t-tests). For Energy and Total force analysis: BjhTERT n = 55, BjhTERTSv40TRas + C n = 54, BjhTERTSv40TRas + Tub n = 61. For Max Force analysis: BjhTERT n = 37, BjhTERTSv40TRas + C n = 49, BjhTERTSv40TRas + Tub n = 51. Scale bar: 10 µm.
FIGURE 2
FIGURE 2
siRNA-mediated knockdown of HDAC6 increases the contractile forces in invasive cells. (A) The protein levels of HDAC6 and GAPDH loading control in cells transfected with HDAC6-targeting siRNA or control siRNA, as indicated. (B) Representative traction force maps of control and transformed and invasive fibroblasts, treated without or with HDAC6 siRNA as indicated with the colour key indicating the magnitude of traction force, in Pascals. The corresponding graphs of the total strain energy (left), the total traction forces (i.e., the traction forces integrated over the cell area) (middle), and the maximum force of cells (right) are shown, as indicated. Data from at least three independent biological repeats. Data presented as mean **p ≤ 0.01.± SD. *p ≤ 0.05 (One way ANOVA tests) (t-tests). BjhTERTSv40TRas + (C) siRNA n = 72, BjhTERTSv40TRas + HDAC6 siRNA n = 96. Scale bar: 10 µm.
FIGURE 3
FIGURE 3
Transformed and invasive cells show lower intracellular forces on the nucleus. (A) Representative images of the nuclei of normal and transformed and invasive cells treated without or with tubacin (Tub), showing the nuclear deformation (top panel), with the deformed shape (magenta line), undeformed shape (green line) and deformation (cyan arrows), with each arrow scaled such that one unit of length on the axes represents a traction force of 250 Pa. and (bottom panel) the nuclear force with the undeformed shape (magenta line), deformed shape (green line) and traction forces (cyan arrows), with each arrow scaled such that one unit of length on the axes represents a traction force of 250 Pa .(B) Graphs of the deformation index (left) and the total nuclear force (right). Data from at least three independent biological repeats and presented as mean ± SD. *p ≤ 0.05, **p ≤ 0.01 (One way ANOVA tests). BjhTERT n = 26, BjhTERTSv40TRas + C n = 43, BjhTERTSv40TRas + Tub n = 41. Scale bar: 10 µm.
FIGURE 4
FIGURE 4
siRNA-mediated HDAC6 knockdown reverses the reduced spreading area, and the loss of the elongated cell shape of transformed and invasive cells back to normal, with no effect on cell migration, speed or persistence. The (A) cell spreading area, (B) cell circularity, (C) aspect ratio, (D) cell migration persistance, (E) cell migration mean speed, and (F) Pearson’s correlation between mean speed and persistence of fibroblasts treated with siRNA or controls, as indicated. Data from three independent biological repeats. *, p ≤ 0.05; **, p ≤ 0.01; ***, p ≤ 0.001; ****, p ≤ 0.0001 (One way ANOVA tests). BjhTERT n = 81, BjhTERTSv40TRas + C siRNA n = 81, BjhTERTSv40TRas + HDAC6 siRNA n = 81.
FIGURE 5
FIGURE 5
Transformed and invasive cells show smaller and increased number of focal adhesions, with further reduced sizes and increased numbers upon HDAC6 inhibition or HDAC6 knockdown. Left, representative images of normal, control or transformed and invasive cells treated with (A) tubacin (Tub) or DMSO control, or (B) HDAC6-targeting siRNA or control, showing phosphotyrosine (pY), F-actin, Vimentin, and merged images, as indicated, with quantification (right panel) of the average size of focal adhesions area and total size of focal adhesions area in μm2 (top panel) and frequency distribution of number of focal adhesions and total number of focal adhesions/cell (lower panel). Data is obtained from three independent biological repeats. *, p ≤ 0.05; **, p ≤ 0.01; ***, p ≤ 0.001; ****, p ≤ 0.0001 (One way ANOVA tests) (Frequency distribution test). For Figure 5A, BjhTERT n = 66, BjhTERTSv40TRas + C n = 76, BjhTERTSv40TRas + Tub n = 65. For Figure 5B, BjhTERT n = 49, BjhTERTSv40TRas + C siRNA n = 91, BjhTERTSv40TRas + HDAC6 siRNA n = 92.
FIGURE 6
FIGURE 6
Tubacin and HDAC6 siRNA increase the acetylation of ɑ-tubulin in transformed and invasive fibroblasts. Normal and transformed and invasive cells treated without or with Tubacin (A), or HDAC6 siRNA (B), showing total acetylated tubulin and GAPDH loading control, as indicated with corresponding graph quantifying ratio between acetylated ɑ-tubulin and ɑ-tubulin treated without or with tubacin (C). Data is obtained from three independent biological repeats **p ≤ 0.01.

Similar articles

References

    1. Alisafaei F., Jokhun D. S., Shivashankar G. V., Shenoy V. B. (2019). Regulation of nuclear architecture, mechanics, and nucleocytoplasmic shuttling of epigenetic factors by cell geometric constraints. Proc. Natl. Acad. Sci. U. S. A. 116, 13200–13209. 10.1073/pnas.1902035116 - DOI - PMC - PubMed
    1. Aspenström P., Fransson Å., Saras J. (2004). Rho GTPases have diverse effects on the organization of the actin filament system. Biochem. J. 377 (Pt 2), 327–337. 10.1042/BJ20031041 - DOI - PMC - PubMed
    1. Asthana J., Kapoor S., Mohan R., Panda D. (2013). Inhibition of HDAC6 deacetylase activity increases its binding with microtubules and suppresses microtubule dynamic instability in MCF-7 cells. J. Biol. Chem. 288, 22516–22526. 10.1074/jbc.M113.489328 - DOI - PMC - PubMed
    1. Bance B., Seetharaman S., Leduc C., Boeda B., Etienne-Manneville S. (2019). Microtubule acetylation but not detyrosination promotes focal adhesion dynamics and astrocyte migration. J. Cell Sci. 132, jcs225805. 10.1242/jcs.225805 - DOI - PubMed
    1. Bershadsky A. D., Ballestrem C., Carramusa L., Zilberman Y., Gilquin B., Khochbin S., et al. (2006). Assembly and mechanosensory function of focal adhesions: Experiments and models. Eur. J. Cell Biol. 85, 165–173. 10.1016/j.ejcb.2005.11.001 - DOI - PubMed

LinkOut - more resources