. 2023;16(8):683-688.
doi: 10.1038/s41561-023-01237-9. Epub 2023 Aug 7.

Shortwave absorption by wildfire smoke dominated by dark brown carbon

Affiliations

Shortwave absorption by wildfire smoke dominated by dark brown carbon

Rajan K Chakrabarty et al. Nat Geosci. 2023.

Abstract

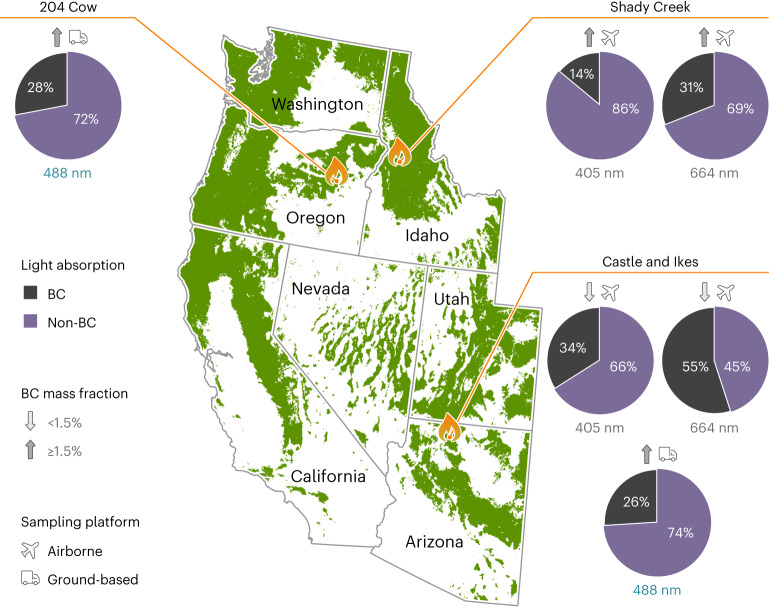
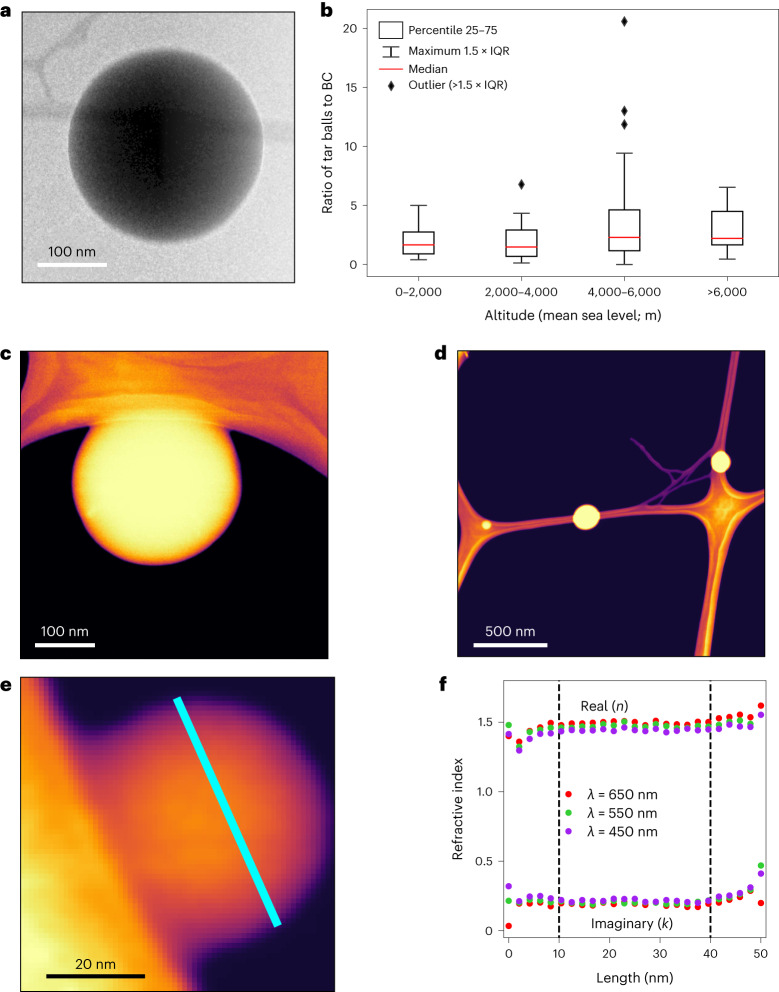
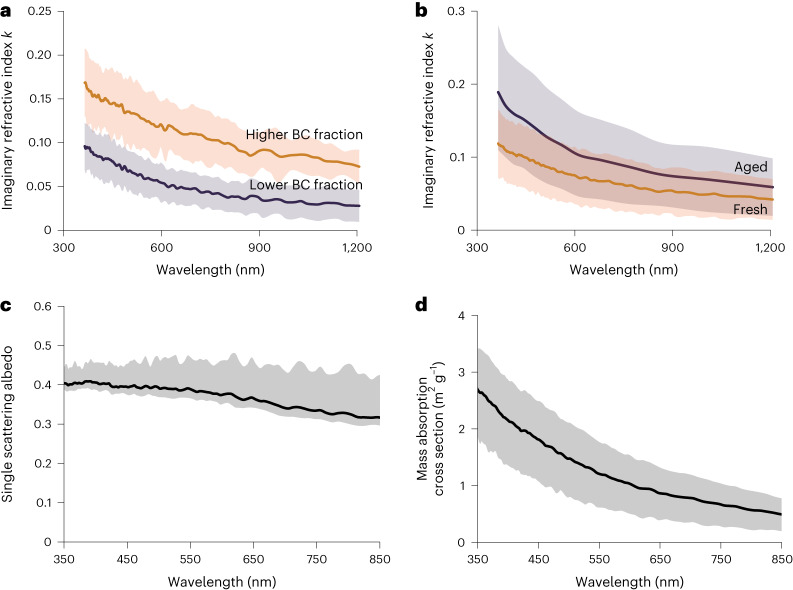
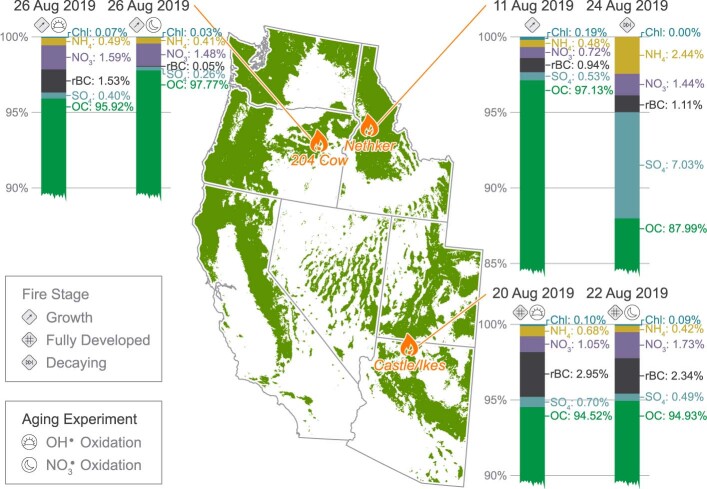
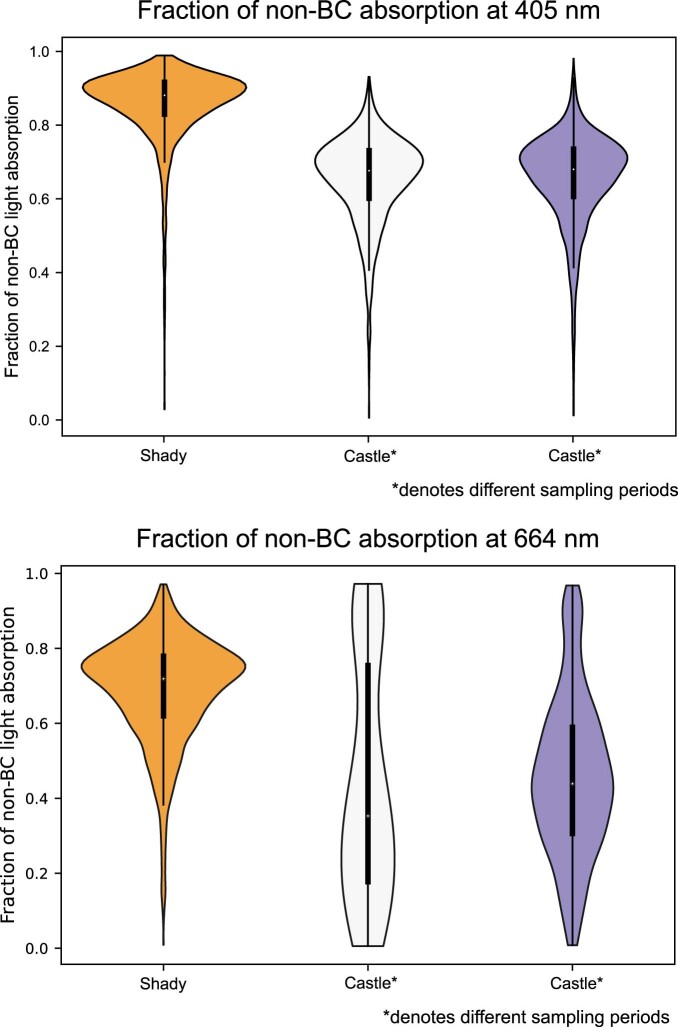
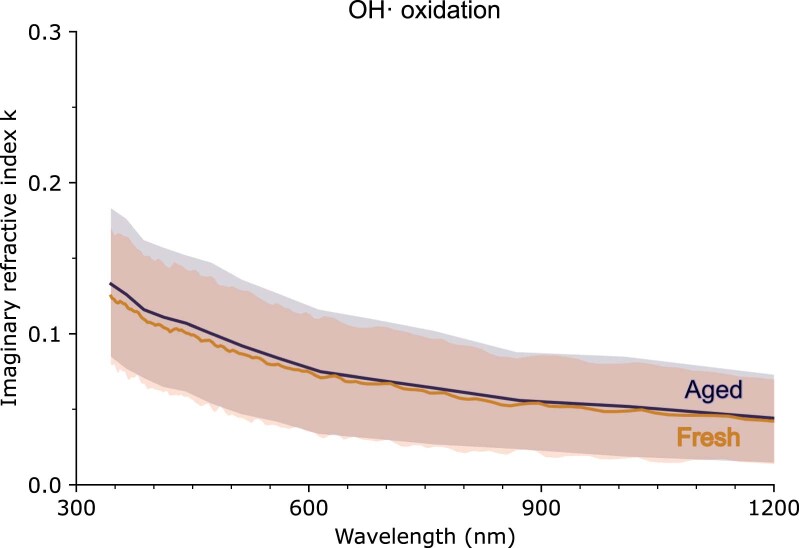
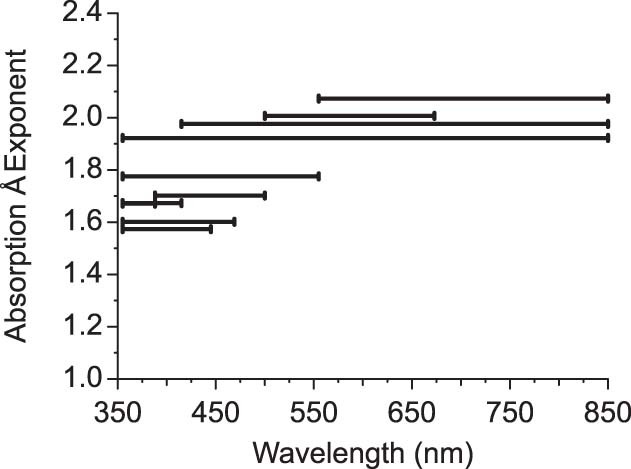
Wildfires emit large amounts of black carbon and light-absorbing organic carbon, known as brown carbon, into the atmosphere. These particles perturb Earth's radiation budget through absorption of incoming shortwave radiation. It is generally thought that brown carbon loses its absorptivity after emission in the atmosphere due to sunlight-driven photochemical bleaching. Consequently, the atmospheric warming effect exerted by brown carbon remains highly variable and poorly represented in climate models compared with that of the relatively nonreactive black carbon. Given that wildfires are predicted to increase globally in the coming decades, it is increasingly important to quantify these radiative impacts. Here we present measurements of ensemble-scale and particle-scale shortwave absorption in smoke plumes from wildfires in the western United States. We find that a type of dark brown carbon contributes three-quarters of the short visible light absorption and half of the long visible light absorption. This strongly absorbing organic aerosol species is water insoluble, resists daytime photobleaching and increases in absorptivity with night-time atmospheric processing. Our findings suggest that parameterizations of brown carbon in climate models need to be revised to improve the estimation of smoke aerosol radiative forcing and associated warming.

Keywords: Atmospheric science; Climate sciences; Environmental impact.


Conflict of interest statement

Competing interestsThe authors declare no competing interests.

Figures

Fig. 1
Fig. 1. Shortwave absorption contributions by aerosols during the 2019 wildfire season in western United States.
In situ ground and airborne measurements of refractory BC mass concentration and total aerosol light absorption by the SP2 and PAS, respectively, in smoke plumes of three wildfires—Shady Creek (Idaho), 204 Cow (Oregon) and Castle and Ikes (Arizona)—during July and August of 2019. The pie charts depict mean relative contributions by BC and non-BC components to total light absorption at wavelengths 405 nm and 664 nm (aircraft) and 488 nm (ground). Total mass fractions of refractory BC and non-refractory inorganic and organic components in aerosols near the fire emission sites are shown in Extended Data Fig. 1. Tree coverage data from radicalcartography.net courtesy of William Rankin.
Fig. 2
Fig. 2. d-BrC tar balls abundant in smoke plumes.
a, TEM image of a d-BrC tar ball abundant in the smoke plumes sampled at altitudes ranging from ground to 10 km. Identification of these tar balls involves use of secondary electron imaging at low accelerating voltage and low working distance. b, Relative abundance of d-BrC tar balls and BC as a function of sampling altitude along the smoke plume height. The total number of particles analysed was n = 3,837. c, High-angle annular dark field (HAADF) image of a single d-BrC tar ball with a diameter of ~290 nm sampled close to a fire. d, HAADF images of multiple d-BrC tar balls with diameters of 70 nm, 150 nm and 185 nm. A Nion HERMES scanning TEM was used for acquiring these images. e, HAADF image of a tar ball with a diameter of ~50 nm, acquired simultaneously with EEL spectra. f, Variation in the real (n) and imaginary (k) refractive index across the diameter of the tar ball. The data points corresponding to the diameter of the tar ball are highlighted in e with the cyan-coloured line. The n and k values, corresponding to wavelengths of λ = 450 nm, 550 nm and 650 nm, remained consistent for all the three wavelengths for EEL spectra collected >10 nm from the particle edges. The particles show a high degree of material homogeneity and uniformity in refractive index across their physical cross sections.
Fig. 3
Fig. 3. Spectral optical properties of d-BrC.
a, Mean imaginary part (k) of the complex refractive index, derived from EEL spectra, against optical wavelength λ for the analysed d-BrC tar balls corresponding to the three wildfires. The k values showed sensitivity to co-emitted BC mass fractions in the smoke plumes. b, Enhancement in the spectral k values on atmospheric ageing, dictated predominantly by night-time NO3· oxidation. The particles showed resistivity to daytime OH· oxidation over three equivalent days (Extended Data Fig. 6). The shaded regions in the plots represent errors corresponding to one standard deviation of the measurements. Power-law scaling coefficients with mean and error bars (one standard deviation) for the measured k values have been tabulated in Extended Data Table 1. c,d, Single scattering albedo (c) and mass absorption cross sections of the particles (d). Shaded region corresponds to one standard deviation and accounts for uncertainties in density, particle size distribution, refractive index and individual measurements.
Extended Data Fig. 1
Extended Data Fig. 1. Compositional analysis of sampled smoke.
A map showing the ground-based sampling location and dates of the three wildfires–Nethker/Shady Creek (Idaho), 204 Cow (Oregon), and Castle and Ikes (Arizona)–along with the fire stages investigated and any in situ oxidation experiment (denoted by sun and moon symbols) conducted on the intercepted smoke plumes. The colored bars show the chemical composition of smoke aerosol emissions – non-refractory matter, measured using an aerosol mass spectrometer, and refractory black carbon, measured using a single-particle soot photometer. Tree coverage data from radicalcartography.net courtesy of William Rankin.
Extended Data Fig. 2
Extended Data Fig. 2. Fraction of non-BC light absorption in the troposphere.
Violin plots showing the fraction of non-BC light absorption determined from tropospheric measurement datasets (n = 33 samples) of the SP2 and PAS onboard NASA’s DC-8 aircraft. An enhancement factor of 1.5 was included to account for black carbon ‘lensing effect’ in this calculation. At 405 nm, the non-BC light absorption contribution in the Shady and Castle fires were 0.86 ± 0.10 and 0.65 ± 0.12, respectively. At 664 nm, the non-BC light absorption contribution in the Shady and Castle fires were 0.7 ± 0.14 and 0.46 ± 0.25, respectively. Violin plots show the shape of a data set by using a Probability Density Function (PDF), or a density plot, which is effectively a smoothed-over histogram. The width of the PDF describes how frequently that value occurs in the data set. The wider regions of the density plot indicate values that occur more frequently. Violin plots include a boxplot that is used to show the minimum, first quartile, median, third quartile, and maximum.
Extended Data Fig. 3
Extended Data Fig. 3. Imaginary refractive index of water-soluble and dark BrC.
Ratio of spectral imaginary refractive index of water-soluble BrC (kWS-BrC) and d-BrC tar balls observed during this study. Water-soluble BrC refractive index was measured using spectrally-resolved light absorption in water extracts of particles from fresh smoke collected on filters at ground level. Water extraction of aerosol particles collected on filters from wildfire smoke typically accounts for approximately half of the overall solvent extractible BrC species. The shaded region in the plot represent errors corresponding to one standard deviation of the measurements.
Extended Data Fig. 4
Extended Data Fig. 4. Real refractive index of dark BrC.
Spectrally resolved real (n) = 1.31 ± 0.03 of the complex refractive index values of d-BrC tar balls sampled across all fires in this study. The shaded region represents errors corresponding to one standard deviation of the measurements.
Extended Data Fig. 5
Extended Data Fig. 5. Orbital Hybridization.
The low-loss EEL spectra < 30 eV of a typical d-BrC tar ball in comparison to those of a co-emitted BC aggregate and a reference single-layer graphene sample. The π peak, which represents the π electron excitation, is observed to be at ~5 eV for graphene and ~6 eV for both carbonaceous aerosol types. The broadening of the π peak as we go from single-layer graphene to the observed tar ball is a measure of increasing amorphization, or decreasing graphitization. This is associated with decreasing sp2 hybridization of neighboring carbon atoms, and hence relative lowering of π- π transitions. The tar ball is much less graphitized than the carbon in BC, in accordance with its lower sp2 hybridization. This points to its formation along the BC formation pathway in high-temperature flames. The formation process of tar balls likely includes carbonization but not graphitization, and therefore, they do not convert to the thermodynamically favorable allotrope of graphitic carbon upon heat treatment in the fire. The π+σ peak, which represents the excitations involving all valence electrons, is observed at ~15 eV for graphene and ~22–25 eV for tar ball and BC. It has been previously shown that the π+σ peak for graphene shifts to higher energies as the number of layers increase, and a third broad peak appears at around 25 eV. This broad peak at ~25 eV is a characteristic feature of graphitic samples.
Extended Data Fig. 6
Extended Data Fig. 6. Daytime oxidation effects on imaginary refractive index.
The spectral k values upon daytime OH· oxidation over a duration of three equivalent days. The slight fluctuations in k values of the aged plume is likely due to gas-phase oxidation of volatile organic compounds in the plume, leading to formation of secondary BrC. The shaded regions in the plots represent errors corresponding to one standard deviation of the measurements.
Extended Data Fig. 7
Extended Data Fig. 7. Absorption Ångström Exponent of dark BrC.
Absorption Ångström Exponent (AÅE) across the near-UV and visible spectra in wavelength intervals corresponding to different wavelength intervals used extensively for detecting and characterizing wildfire smoke plumes,. The two ends of a solid black line represent the two wavelengths λ1 and λ2 between which the AÅE, which is defined as the exponent in a power law expressing the ratio of the mean absorption coefficients (λ1, λ2), is calculated. A total of 33 smoke samples were analyzed for the calculation of AÅE. Only one estimate of AÅE is available, so the standard error cannot be calculated directly.

References

    1. Ditas J, et al. Strong impact of wildfires on the abundance and aging of black carbon in the lowermost stratosphere. Proc. Natl Acad. Sci. USA. 2018;115:E11595–E11603. doi: 10.1073/pnas.1806868115. - DOI - PMC - PubMed
    1. Yu P, et al. Black carbon lofts wildfire smoke high into the stratosphere to form a persistent plume. Science. 2019;365:587–590. doi: 10.1126/science.aax1748. - DOI - PubMed
    1. Yu P, et al. Surface dimming by the 2013 Rim Fire simulated by a sectional aerosol model. J. Geophys. Res. 2016;121:7079–7087. doi: 10.1002/2015JD024702. - DOI - PMC - PubMed
    1. Bond T, et al. Bounding the role of black carbon in the climate system: a scientific assessment. J. Geophys. Res. 2013;118:5380–5552. doi: 10.1002/jgrd.50171. - DOI
    1. Arias, P. A. et al. in Climate Change 2021: The Physical Science Basis (eds Masson-Delmotte, V. et al.) 33–144 (IPCC, Cambridge Univ. Press, 2021).